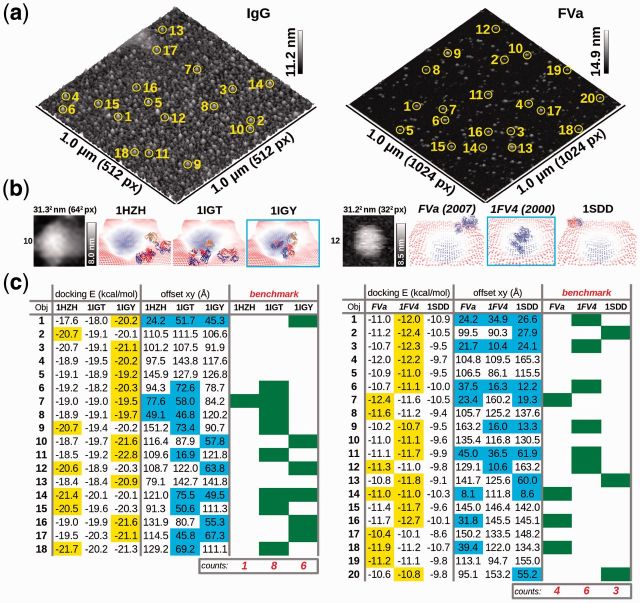
Fig. 1.
DockAFM test cases: immunoglobulin (IgG) and activated blood coagulation factor V (FVa): (a) AFM images of IgG (left) and FVa (right) show each individual topographic surface used for running DockAFM (b) AFM topographic surfaces used for docking protein structures are shown in gray scale as well as three different docked structures are shown for both IgG and FVa systems (bottom side view) (c) For each system, the docking score as well as the shift of the docked structure from the center of the topographic surface are shown. The most favorable structure is chosen as that having the smallest shift from the center. Counting most favorable structures is used for the benchmarking purpose of DockAFM

