

Abstract
In patients undergoing percutaneous coronary intervention after acute myocardial infarction, hyperglycaemia on admission is associated with an increased risk of contrast-induced nephropathy (CIN). However, the effects of hyperglycaemia and elevated glycosylated haemoglobin (HbA1c) on CIN have remained to be fully elucidated. Therefore, a prospective cohort study was performed, comprising 258 patients who underwent coronary angiography between May 2017 and November 2017 at Zhongda Hospital affiliated with Southeast University (Nanjing, China). According to the diagnostic criteria for CIN (increase of serum creatinine by >44.2 µmol/l or by 25% within 48–72 h of using contrast agent), the patients were divided into two groups: CIN (45 cases) and non-CIN (213 cases). For all patients, the baseline data, medical history, laboratory parameters, medication history and intraoperative situation were recorded and assessed using single-factor analysis and multiple logistic regression analysis to analyse the risk factors of CIN. The incidence of CIN in the hyperglycaemia group (blood glucose on admission, >11.1 mmol/l) was 25%, compared with 13.8% in the non-hyperglycaemia group (P=0.026). Furthermore, the incidence of CIN in the elevated HbA1c group (HbA1c on admission, upper limit of normal) was 26.1%, compared with 14.3% in the group without elevated HbA1c (P=0.027). Hyperglycaemia was present on hospital admission in 84 of 258 patients (32.6%). The percentage of patients with elevated HbA1c was 26.7%. Age, estimated glomerular filtration rate, pre-operative blood cholesterol, hyperglycaemia on admission and elevated HbA1c were all identified to be associated with CIN. According to the multivariate logistic regression analysis, hyperglycaemia was an independent predictor of CIN (odds ratio, 2.815; 95% confidence interval, 1.042–4.581; P=0.029). In the acute coronary syndrome (ACS) and diabetes subgroups, hyperglycaemia was significantly associated with CIN. In the ACS subgroup, the incidence of CIN was 38.1%. It was indicated that hyperglycaemia is an independent risk factor for CIN, particularly in patients with ACS or diabetes. Trial registration no. ChiCTR-OOC-17011466.
Keywords: hyperglycaemia, glycosylated haemoglobin, contrast-induced nephropathy
Introduction
Contrast-induced nephropathy (CIN) refers to acute renal dysfunction caused by contrast agents and is the third-leading in-hospital cause of acute renal injury (1). At present, no effective methods for treating CIN are available, so that its prevention is essential. Studies have indicated that stress hyperglycaemia is a stronger predictor for the prognosis of patients with acute myocardial infarction than a history of diabetes mellitus and should therefore be considered during risk assessment (2). In patients with CIN after percutaneous coronary intervention (PCI), hyperglycaemia tends to increase the risk of infection and in-hospital mortality (3). Stolker et al (4) reported that hyperglycemia is associated with contrast-induced kidney injury, while this association is hardly tenable in diabetic populations. Perkan et al (5) indicated that hyperglycemia on admission is linked to an increased risk of CIN, particularly when it occurs acutely. A study by Barbieri et al (6) indicated that elevated glycated-haemoglobin but not glucose levels is an independent factor associated with CIN among patients without diabetes undergoing coronary angiography or PCI. This issue remains to be widely debated, and no clear conclusions have been reached. Therefore, the present study aimed to explore the effects of hyperglycaemia and elevated glycosylated haemoglobin on CIN after coronary angiography and their predictive value in patients undergoing coronary angiography.
Materials and methods
Patients
The present study was a prospective single-centre cohort study performed at Zhongda Hospital affiliated to Southeast University (Nanjing, China; trial registration no. ChiCTR-OOC-17011466). A total of 258 patients, including 172 males and 86 females, who underwent coronary angiography between May 2017 and November 2017, were enrolled in a prospective, randomized manner. The inclusion criteria were as follows: Age between 18 and 75 years, and planned coronary angiography due to chest tightness or chest pain. The exclusion criteria were as follows: Allergy to contrast agent; chronic renal insufficiency, stage-5 chronic kidney disease (CKD), haemodialysis and renal transplantation; computed tomography, magnetic resonance or other angiography within the previous 2 weeks; acute renal insufficiency or intake of a nephrotoxic drug within the previous 2 weeks; severe cardiac insufficiency, severe valvular heart disease or haemodynamic instability; and severe liver dysfunction, malignancy or severe infectious disease.
The present study was approved by the Ethics Committee of Zhongda Hospital (Nanjing, China) and all patients provided written informed consent. The subjects were divided into a CIN and a non-CIN group. The baseline information of the patients is presented in Table I.
Table I.
Baseline data and medical history of 258 patients undergoing coronary angiography stratified by the presence of contrast-induced nephropathy.
| Variables | Non-CIN group (n=213) | CIN group (n=45) | P-value |
|---|---|---|---|
| Male gender | 145.000 (68.100) | 27.000 (60.000) | 0.296 |
| Age (years) | 66.670±10.490 | 69.330±11.080 | 0.045 |
| Height (cm) | 164.140±13.570 | 164.460±8.140 | 0.882 |
| Weight (kg) | 69.170±12.040 | 66.330±12.700 | 0.170 |
| SBP (mmHg) | 134.170±18.040 | 137.290±19.400 | 0.299 |
| DBP (mmHg) | 77.290±11.789 | 80.330±15.190 | 0.137 |
| BMI (kg/m2) | 25.450±3.690 | 24.470±3.920 | 0.123 |
| Hypertension | 150.000 (70.400) | 31.000 (68.900) | 0.838 |
| Diabetes | 86.000 (53.300) | 24.000 (40.400) | 0.110 |
| Anemia | 0.000 (0.000) | 1.000 (2.200) | 0.174 |
| Hypotension | 0.000 (0.000) | 0.000 (0.000) | 1.000 |
| Chronic kidney dysfunction | 9.000 (4.200) | 3.000 (6.700) | 0.444 |
| NYHA class | 1.850 | 1.820 | 0.844 |
| Previous myocardial infarction | 43.000 (18.000) | 2.000 (10.500) | 0.409 |
| ACS | 34.000 (22.000) | 11.000 (16.300) | 0.344 |
| AMI | 25.000 (11.700) | 7.000 (15.600) | 0.480 |
| Emergency PCI | 4.000 (1.900) | 2.000 (4.400) | 0.281 |
| Atrial fibrillation | 42.000 (17.900) | 3.000 (13.000) | 0.775 |
Values are expressed as n (%) or the mean ± standard deviation. SBP, systolic blood pressure; DBP, diastolic blood pressure; BMI, body mass index; NYHA, New York Heart Association class; ACS, acute coronary syndrome; AMI, acute myocardial infarction; PCI, percutaneous coronary intervention; CIN, contrast-induced nephropathy.
Evaluation of CIN and hyperglycaemia
The pre- and post-operative serum creatinine levels within 48–72 h after coronary angiography were assessed to evaluate whether CIN occurred. On admission, blood glucose and glycosylated haemoglobin (HbA1c) were determined, and the differences in hyperglycaemia and elevated HbA1c were compared between the CIN and non-CIN groups. Binary logistic regression analysis was performed and the receiver operating characteristic (ROC) curve was drawn to assess whether hyperglycaemia and elevated HbA1c are independent risk factors for CIN, and thereby determine their predictive value.
Observational indexes and evaluation methods
Hyperglycaemia, elevated HbA1C, baseline data, haematology indexes, medication history and the intraoperative condition were compared between the CIN and non-CIN groups in order to identify independent risk factors for CIN.
Definitions of hyperglycaemia, elevated HbA1C and CIN
No exact criteria have been established to define stress hyperglycaemia in China or other countries. The international literature generally defines hyperglycaemia as blood glucose >11.1 mmol/l on admission (7). Therefore, the patients of the present study were divided into a hyperglycaemia group (blood glucose on admission, >11.1 mmol/l; 84 cases) and a control group (blood glucose on admission, ≤11.1 mmol/l). A reasonable HbA1c control target is <7%. Therefore, HbA1c ≥7% may be used as a criterion for type 2 diabetes patients who require clinical treatment or a treatment adjustment. Patients with HbA1c ≥7% on admission were considered as the elevated HbA1c group. CIN was diagnosed based on an increase in serum creatinine by >25% or by 44.2 µmol/l within 48–72 h of coronary angiography after excluding other factors that cause acute kidney injury. Accordingly, the patients were divided into a non-CIN group (213 cases) and a CIN group (45 cases). The CKD-Epidemiology Collaboration formula was used to calculate the estimated glomerular filtration rate (eGFR) (8).
PCI and clinical medication
Using the Seldinger puncture method, the right radial or right femoral artery was selected. If necessary, PCI was performed. One of two types of contrast agent, iodopuron (a non-ionic hypotonic contrast agent; Bayer AG, Leverkusen, Germany) or iodixanol (a non-ionic isotonic contrast agent; GE Healthcare, Little Chalfont, UK), was selected. Based on the individual clinical condition, the use of drugs including aspirin, renin-angiotensin converting enzyme inhibitors, angiotensin II receptor antagonists, beta-blockers, calcium channel antagonists, statins, diuretics, alprostadil and cardiac drugs, as well as measures including hydration and intensive statin treatment were adopted. For patients with chronic renal insufficiency or elderly patients, the reduction of contrast agent use, hydration, the close monitoring of renal function, and temporary blood purification treatment was performed depending on the clinicians' decision based on the patient's individual condition.
Statistical analysis
SPSS 19.0 statistical software (IBM Corp., Armonk, NY, USA) was used for data analysis. The normally distributed numerical data were expressed as the mean ± standard deviation and compared using the independent-samples t-test. Non-normally distributed numerical data were expressed as the median and 25–75 interquartile range and compared using the rank-sum test. Classification data were expressed as numbers and percentages and compared using the χ2 test. Binary logistic regression analysis was used to assess the risk factors for CIN. The predictive value of blood glucose for CIN was evaluated by generating a ROC curve. P<0.05 was considered to indicate a statistically significant difference.
Results
Clinical characteristics in the CIN and non-CIN groups
Table I compares the baseline data and past history of the CIN and non-CIN patients. Results demonstrated that CIN occurred in 45 patients (Table I). No significant differences in sex, height, weight, body mass index, systolic or diastolic blood pressure, diabetes, hypertension, acute myocardial infarction, New York Heart Association class, emergency PCI, anemia, hypotension, CKD, past myocardial infarction, atrial fibrillation or acute coronary syndrome (ACS) were present between the CIN and non-CIN groups (P>0.05). However, the age in the CIN group was significantly higher than that in the non-CIN group (P=0.045).
Comparison of the haematological parameters (Table II), drug use and intraoperative conditions (Table III) between the CIN and non-CIN groups revealed no significant differences in white or red blood cell counts, Hb, platelet count, alanine aminotransferase, aspartate transaminase, lactate dehydrogenase, blood glucose, triglycerides, cholesterol low-density lipoprotein, pre-operative serum urea nitrogen, as well as the intake of aspirin, beta blockers, renin-angiotensin converting enzyme inhibitor, angiotensin II receptor antagonist, calcium channel blocker or renal protective drugs, and the dosage of contrast agent, type of contrast agent, multiple vasculopathy, multi-stent implantation, hydration and hydration dosage (P>0.05). Pre-operative serum creatinine, total cholesterol, pre-operative eGFR, hyperglycemia and elevated HbA1c in the CIN group were significantly higher than those in the non-CIN group (P=0.048, 0.026, 0.028, 0.028 and 0.022, respectively). Hyperglycaemia was present in 84 of 258 (32.6%) patients upon hospital admission and 69 (26.7%) patients exhibited elevated HbA1c.
Table II.
Comparison of the haematological indexes between CIN and non-CIN groups.
| Variables | Non-CIN group (n=213) | CIN group (n=45) | P-values |
|---|---|---|---|
| WBC P50 (P25-P75) (109/l) | 6.440 (5.250–8.140) | 6.700 (5.400–8.900) | 0.425 |
| RBC (1012/l) | 4.510±0.530 | 4.480±0.650 | 0.733 |
| Hb (g/l) | 137.340±15.540 | 135.280±19.350 | 0.450 |
| PLT P50 (P25-P75) (109/l) | 189.000 (154.000–231.000) | 184.000 (154.000–273.000) | 0.687 |
| ALB (g/l) | 40.350±4.560 | 39.380±4.670 | 0.197 |
| ALT P50 (P25-P75) (IU/l) | 19.000 (14.000–30.000) | 18.500 (13.750–31.000) | 0.506 |
| AST 18.5 (13.75–31) (IU/l) | 20.000 (16.000–27.000) | 20.000 (16.000–27.750) | 0.645 |
| LDH P50 (P25-P75) (IU/l) | 182.000 (162.000–214.000) | 184.000 (152.250–236.000) | 0.641 |
| Glu P50 (P25-P75) (mmol/l) | 6.160 (5.130–8.530) | 7.760 (5.080–12.050) | 0.089 |
| TG P50 (P25-P75) (mmol/l) | 6.160 (8.530–12.610) | 1.330 (0.960–1.980) | 0.970 |
| TC P50 (P25-P75) (mmol/l) | 4.130 (3.390–4.990) | 4.470 (3.670–5.470) | 0.026 |
| LDL-C P50 (P25-P75) (mmol/l) | 2.370 (1.830–2.950) | 2.5900 (2.140–3.160) | 0.090 |
| Pre-operative Scr P50 (P25-P75) (µmol/l) | 80.000 (70.000–94.000) | 65.000 (55.000–83.500) | 0.048 |
| Pre-operative Bun P50 (P25-P75) (mmol/l) | 5.800 (4.900–7.000) | 5.500 (4.500–6.350) | 0.167 |
| Pre-operative eGFR P50 (P25-P75) (ml/min/1.73 m2) | 80.300 (65.600–92.700) | 91.700 (74.500–100.500) | 0.028 |
| Elevated HbA1c | 51.000 (23.944) | 18.000 (40.000) | 0.022 |
| Hyperglycaemia | 63.000 (29.577) | 21.000 (46.667) | 0.028 |
| Elevated HbA1c | 69 | ||
| Hyperglycaemia | 84 |
Values are expressed as n (%), the median (quartile) or the mean ± standard deviation. RBC, red blood cells; HbA1c, glycosylated haemoglobin; PLT, platelets; ALB, albumin; ALT, alanine transaminase; AST, aspartate transaminase; GOT, glutamic-oxalate transaminase; LDH, lactate dehydrogenase; Glu, glucose; TG, triglycerides; TC, total cholesterol; LDL-C, low-density lipoprotein cholesterol; Scr, serum creatinine; eGFR, estimated glomerular filtration rate; Bun, blood urea nitrogen; HbA1c, glycosylated haemoglobin; CIN, contrast-induced nephropathy.
Table III.
Comparison of drug use and intraoperative situation between the CIN and non-CIN groups.
| Parameter | Non-CIN group (n=213) | CIN group (n=45) | P-values |
|---|---|---|---|
| Aspirin | 193.000 (90.600) | 41.000 (91.100) | 0.916 |
| Beta-blocker | 170.000 (79.800) | 36.000 (80.000) | 0.977 |
| ACEI | 115.000 (54.000) | 24.000 (53.300) | 0.936 |
| CCB | 86.000 (40.400) | 12.000 (26.700) | 0.085 |
| Statin | 205.000 (96.200) | 44.000 (97.800) | 0.610 |
| Renoprotective drug | 7.000 (3.300) | 2.000 (4.400) | 0.658 |
| Digoxin | 4.000 (1.900) | 3 (6.700) | 0.072 |
| Spironolactone | 33.000 (15.500) | 11.000 (24.400) | 0.147 |
| Hydration | 163.000 (76.500) | 35.000 (77.800) | 0.857 |
| Hydration dosage (ml) | 500.000 | 500.000 | 1.000 |
| Dosage of contrast agent P50 (P25-P75) (ml) | 146.000 (135.000–163.000) | 158.000 (142.000–175.000) | 0.403 |
| Iodixanol | 153.000 (71.800) | 36.000 (80.000) | 0.261 |
| Multiple vasculopathy | 107.000 (50.200) | 24.000 (53.300) | 0.706 |
| Multi-stent implantation | 44.000 (20.700) | 6.000 (13.300) | 0.259 |
Values are expressed as n (%), median (quartile) or the mean ± standard deviation. ACEI, angiotensin-converting enzyme inhibitors; CCB, calcium channel blocker; CIN, contrast-induced nephropathy.
Binary logistic regression analysis of potential risk factors for CIN revealed that age, pre-operative eGFR, total cholesterol and hyperglycaemia are independent risk factors [P=0.037, 0.024, 0.009 and 0.039, respectively; odds ratio (OR)=1.075, 0.779, 1.500 and 2.815; 95% confidence interval (CI) 1.005–1.151, 0.628–0.869, 1.105–2.030 and 1.042–4.581; Table IV].
Table IV.
Binary logistic regression analysis of the risk factors for contrast-induced nephropathy after coronary angiography.
| Single-factor analysis | Multiple logistic regression | |||||
|---|---|---|---|---|---|---|
| Variable | OR | 95% CI | P-values | OR | 95% CI | P-values |
| Age | 1.025 | 1.013–1.058 | 0.045 | 1.075 | 1.005–1.151 | 0.037 |
| Preoperative Scr | 1.021 | 1.002–1.041 | 0.048 | 0.990 | 0.968–1.020 | 0.590 |
| Preoperative eGFR | 0.984 | 0.969–1.000 | 0.028 | 0.779 | 0.628–0.869 | 0.024 |
| Elevated HbA1C | 2.206 | 1.108–4.393 | 0.022 | 1.240 | 0.843–1.450 | 0.630 |
| Cholesterol | 1.365 | 1.034–1.802 | 0.026 | 1.500 | 1.105–2.030 | 0.009 |
| Hyperglycaemia | 2.083 | 1.082–4.012 | 0.028 | 2.815 | 1.042–4.581 | 0.039 |
| ACS | 1.443 | 0.673–3.097 | 0.346 | 1.389 | 0.553–3.493 | 0.484 |
| Diabetes | 1.688 | 0.884–3.221 | 0.110 | 1.474 | 0.585–3.713 | 0.410 |
OR, odds ratio; 95% CI, 95% confidence interval; Scr, serum creatine; eGFR, estimated glomerular filtration rate; ACS, acute coronary syndrome.
CIN incidence in different groups
The incidence of CIN in the hyperglycaemia group (25.0%; blood glucose on admission, >11.1 mmol/l) was significantly higher (P=0.026; Fig. 1) compared with the non-hyperglycemia group (13.8%; blood glucose on admission, >11.1 mmol/l). Furthermore, the incidence of CIN in the elevated HbA1c group (26.1%; HbA1c on admission, upper limit of normal) was significantly higher (P=0.027; Fig. 1) compared with the group without elevated HbA1c (14.3%).
Figure 1.

CIN incidence in different groups. The incidence of CIN in the hyperglycaemia group was 25.0%, compared with the non-hyperglycaemia group (13.8%). The incidence of CIN in the elevated HbA1c group (26.1%) was, significantly higher (P=0.027) compared with the group without elevated HbA1c (14.3%).
Subgroup analyses
In the ACS subgroup, the incidence of CIN was 38.1%. The difference in the incidence of CIN between the hyperglycaemia and control groups was significant in the ACS (P=0.046) and diabetes (P=0.037) subgroups (Fig. 2), but not in the non-ACS or non-diabetic subgroups (P=0.270 and 0.936, respectively).
Figure 2.

Comparison of the incidence of CIN in the different subgroups. In ACS and diabetes patients, the CIN incidence differed significantly between the hyperglycaemia and control groups. ACS, acute coronary syndrome; CIN, contrast-induced nephropathy.
ROC analysis
The ROC curves for the predictive value of the blood glucose levels for CIN for all patients and diabetes patients are presented in Figs. 3 and 4, respectively; the areas under the curve with 95% CIs were 0.569 (0.469–0.669) and 0.652 (0.427–0.876), respectively. The ROC curves for the predictive value of post-operative serum creatinine for CIN is presented in Fig. 5, and the area under the curve with 95% CI was 0.559 (0.427–0.618). The area under the curve value was relatively poor, indicating that blood glucose levels do not exhibit a strong predictive value for CIN; however, the area under the curve value was stronger in patients with diabetes (Fig. 4).
Figure 3.
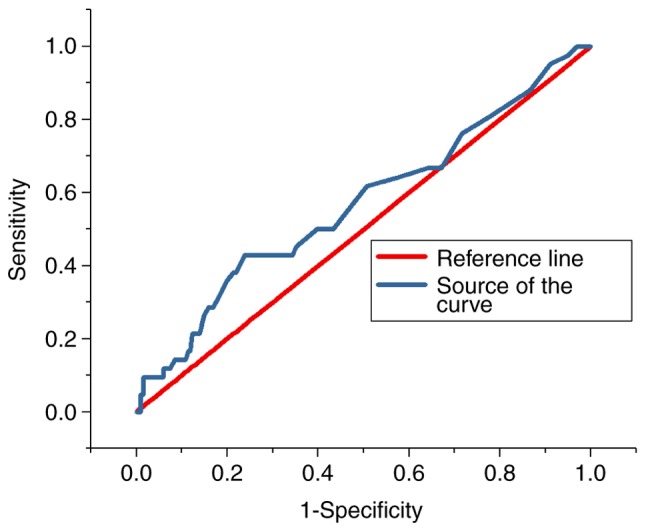
Receiver operating characteristic curve indicating the predictive value of hyperglycaemia in contrast-induced nephropathy in all patients.
Figure 4.
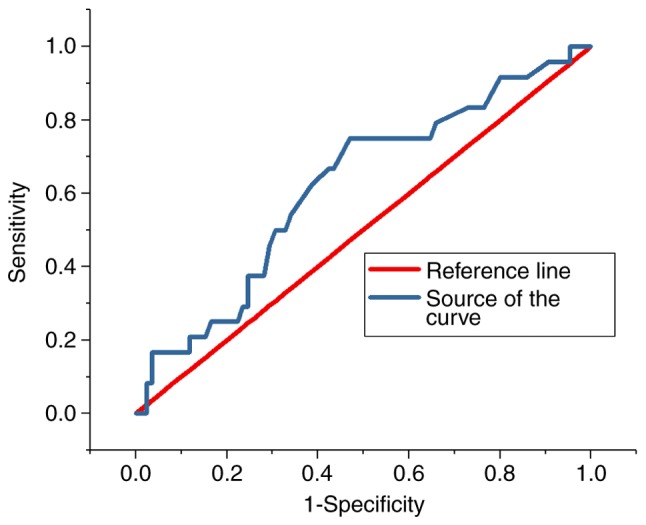
Receiver operating characteristic curve indicating the predictive value of hyperglycaemia in contrast-induced nephropathy in diabetes patients.
Figure 5.
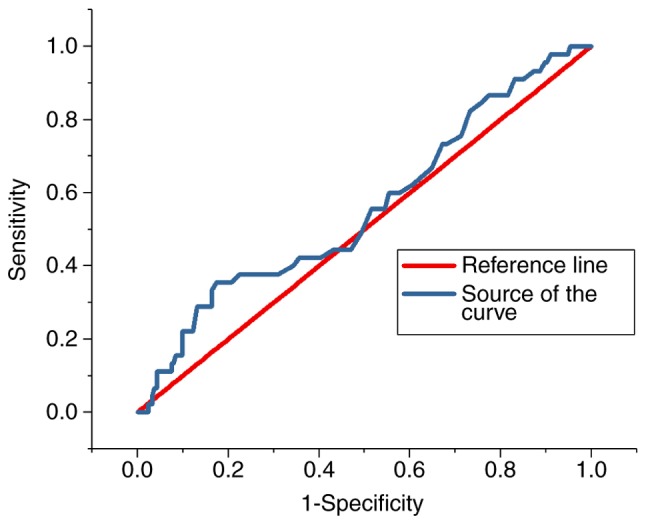
Receiver operating characteristic curve indicating the predictive value of post-operative serum creatinine in contrast-induced nephropathy in patients.
Discussion
CIN is an acute renal injury caused by contrast agents. It is the third major cause of acute in-hospital renal injury and increases the burden on patients and society in terms of hospitalisation time, all-cause mortality and kidney disease morbidity (9). Therefore, CIN has drawn the attention of radiologists, interventionists, nephrologists and cardiovascular specialists.
Diabetic patients have twice the risk of cardiovascular events of that of healthy individuals. Cardiovascular disease is the leading cause of mortality in diabetic patients, accounting for 75% of mortalities (10). A 20-year follow-up of the Whitehall study demonstrated an association between hyperglycaemia and cardiovascular events in non-diabetic populations (11). In 2010, a Chinese chronic disease surveillance and diabetes investigation revealed that the prevalence of diabetes in China was 11.6% (12). In diabetes patients with cardiovascular disease who required coronary angiography or percutaneous coronary intervention, diabetes is a risk factor for acute renal injury after coronary angiography (13). Therefore, it is important to study the correlation between blood glucose and CIN.
Stress hyperglycaemia usually refers to the transient hyperglycaemia that occurs during a disease. The American Diabetes Association consensus defined the concept of hyperglycaemia as fasting glucose >6.9 mmol/l or random glucose >11.1 mmol/l without any evidence of previous diabetes (7). This concept was used to define stress hyperglycemia: Random glucose on admission, >11.1 mmol/l, regardless of the patient's diabetes status.
Stress hyperglycaemia is widely recognised as a predictive factor of poor prognosis in myocardial infarction patients (14). It is also closely associated with mortality and in-hospital complications (15,16). Stress hyperglycaemia increases the risk of acute kidney injury and is an independent risk factor for acute renal injury in acute myocardial infarction patients. Furthermore, acute kidney injury is correlated with in-hospital mortality (17). A study by Stolker et al (4) comprising 6,358 non-diabetic patients with acute myocardial infarction indicated that hyperglycemia is associated with contrast-induced kidney injury, the risk of CIN is dependent on hyperglycemia. In a presentation at the European Society of Cardiology congress in 2013, Perkan et al (5) reported that hyperglycemia on admission is associated with an increased risk of CIN, particularly when hyperglycemia occurs acutely. A study including high-risk elderly patients with impaired renal function indicated that the incidence of CIN is associated with diabetes mellitus (18).
Due to hyperglycaemia leading to CIN, hyperglycaemia may be a stress response phenomenon due to sympathetic nervous system activation, which promotes cortisol and catecholamine release, leading to ischemic injury of the renal outer medulla. Hyperglycaemia increases the production of oxygen free radicals and inhibits blood flow-mediated vascular dilation, leading to hypoxia and ischemia. Acute hyperglycaemia may also act as an osmotic diuretic, resulting in insufficient renal perfusion, which increases the risk of CIN. Hyperglycaemic patients also develop more metabolic abnormalities in comparison with non-hyperglycaemic patients, resulting in elevated levels of inflammatory biomarkers. These increase the systemic inflammatory response and the risk of nephrotoxicity. Particularly in patients with acute myocardial infarction, a variety of neurohormones, as well as immune and inflammatory pathways are activated, leading to kidney damage (3,19). Stress hyperglycaemia is also a response to insulin deficiency, which is associated with increased circulating free fatty acids, causing kidney injury. In brief, contrast medium and an elevated glucose levels have a synergistic effect on CIN (20).
HbA1c is a product of Hb and blood glucose. It more accurately reflects long-term glycaemic control with blood glucose and helps to identify undiagnosed diabetic patients (21). A study by Barbieri et al (6) indicated that among patients without diabetes undergoing coronary angiography or PCI, elevated HbA1c but not glucose levels is a factor independently associated with CIN, and the adjusted OR with 95% CI was 1.69 (1.14–2.51).
In the present study, the subjects were divided into hyperglycaemia and control groups using a cut-off of 11.1 mmol/l. The association between hyperglycaemia and the incidence of CIN was significant. This association was confirmed in the diabetes and ACS subgroups. However, in patients with stable coronary heart disease and patients without diabetes, the incidence of CIN was not significantly associated with hyperglycaemia. The reason may be that hyperglycaemia was not obvious in the patients without ACS. The percentage of patients with unstable angina, non-ST-elevation myocardial infarction or ST-elevation myocardial infarction was only 19.4% (50 patients). The binary logistic regression analysis indicated that age, pre-operative eGFR, total cholesterol and hyperglycemia were independent risk factors for CIN after regression analysis was performed on patients with ACS and diabetes. The area under the curve value of pre-operative creatinine for CIN was 0.559, indicating that blood glucose is rather poor at predicting CIN, but is more effective when compared with serum creatinine. This may be due to the following reasons: When pre-operative serum creatinine levels are low, post-operative creatinine levels easily rise by >25% of the pre-operative level, and it is therefore easy to achieve the diagnostic criteria for CIN. Furthermore, when basal serum creatinine is high, considering that chronic renal insufficiency may be present, the probability of CIN is high. Therefore, it is inappropriate to use pre-operative serum creatinine or eGFR to predict the probability of CIN. The Chinese type 2 diabetes prevention and treatment guidelines (2013 version) state that HbA1c is one of the major indicators of blood glucose control in the long-term (22); for most non-pregnant adults with type 2 diabetes, a reasonable HbA1c control target is <7%. HbA1c ≥7% may be used as the level at which type 2 diabetes patients need to start clinical treatment or adjust their treatment. The results of the present study suggested that the incidence of CIN was significantly higher in the high HbA1c group than in the control group, but the binary logistic regression analysis indicated that HbA1c was not an independent risk factor for CIN. Larger studies are required to confirm this association.
The results of the present study indicated that the incidence of CIN is as high as 17%. At present, no specific methods are available for the prevention or treatment of CIN. Commonly used measures include minimising the amount of contrast agent, hydration, using a pre-heated isotonic contrast agent and stopping the use of nephrotoxic drugs, including non-steroidal anti-inflammatory drugs, cyclosporine and aminoglycoside antibiotics prior to angiography (23). In addition, a meta-analysis suggested that low-dose N-acetylcysteine and statins had a significant effect on reducing the incidence of CIN (24).
In conclusion, the present study suggested that in patients undergoing coronary angiography, acute hyperglycaemia is closely associated with the risk of CIN, particularly in ACS and diabetes patients. Further research is required to evaluate the association between CIN and HbA1c.
Acknowledgements
This study was supported by the National Natural Science Foundation of China.
Funding
The present study was supported by the National Natural Science Foundation of China (grant no. 81600227).
Availability of data and materials
The analyzed data sets generated during the study are available from the corresponding author on reasonable request.
Authors' contributions
YQ and CM made substantial contributions to the conception of the study and acquisition of data. YQ was responsible for the statistic analysis of data and was a major contributor in writing the manuscript. GY designed the clinical trial, confirmed the specific procedure of the trial and gave advice on the specific parameters for this study. CT and GM helped design the trial, contributed in the interpretation of data and revised the manuscript critically for important intellectual content. All authors read and approved the final manuscript.
Ethical approval and consent to participate
This study was approved by the Ethics Committee of Zhongda Hospital (Nanjing, China) and all patients provided informed consent.
Consent for publication
Not applicable.
Competing interests
The authors declare that they have no competing interests.
References
- 1.James MT, Samuel SM, Manning MA, Tonelli M, Ghali WA, Faris P, Knudtson ML, Pannu N, Hemmelgarn BR. Contrast-induced acute kidney injury and risk of adverse clinical outcomes after coronary angiography: A systematic review and meta-analysis. Circ Cardiovasc Interv. 2013;6:37–43. doi: 10.1161/CIRCINTERVENTIONS.112.974493. [DOI] [PubMed] [Google Scholar]
- 2.Goyal A, Mehta SR, Gerstein HC, Díaz R, Afzal R, Xavier D, Zhu J, Pais P, Lisheng L, Kazmi KA, et al. Glucose levels compared with diabetes history in the risk assessment of patients with acute myocardial infarction. Am Heart J. 2009;157:763–770. doi: 10.1016/j.ahj.2008.12.007. [DOI] [PubMed] [Google Scholar]
- 3.Marenzi G, De Metrio M, Rubino M, Lauri G, Cavallero A, Assanelli E, Grazi M, Moltrasio M, Marana I, Campodonico J, et al. Acute hyperglycemia and contrast-induced nephropathy in primary percutaneous coronary intervention. Am Heart J. 2010;160:1170–1177. doi: 10.1016/j.ahj.2010.09.022. [DOI] [PubMed] [Google Scholar]
- 4.Stolker JM, McCullough PA, Rao S, Inzucchi SE, Spertus JA, Maddox TM, Masoudi FA, Xiao L, Kosiborod M. Pre-procedural glucose levels and the risk for contrast-induced acute kidney injury in patients undergoing coronary angiography. J Am Coll Cardiol. 2010;55:1433–1440. doi: 10.1016/j.jacc.2009.09.072. [DOI] [PubMed] [Google Scholar]
- 5.Perkan A, Cinquetti M, Giannini F, Santangelo S, Pirozzi F, Barbati G, Vitrella G, Rakar S, Salvi A, Sinagra G. Admission hyperglycemia and contrast induced nephropathy. Eur Heart J. 2013;34:555–555. doi: 10.1093/eurheartj/eht309.P3062. [DOI] [Google Scholar]
- 6.Barbieri L, Verdoia M, Schaffer A, Cassetti E, Di Giovine G, Marino P, Suryapranata H, De Luca G. Pre-diabetes and the risk of contrast induced nephropathy in patients undergoing coronary angiography or percutaneous intervention. Diabetes Res Clin Pract. 2014;106:458–464. doi: 10.1016/j.diabres.2014.09.041. [DOI] [PubMed] [Google Scholar]
- 7.Dungan KM, Braithwaite SS, Preiser J-C. Stress hyperglycaemia. Lancet. 2009;373:1798–1807. doi: 10.1016/S0140-6736(09)60553-5. [DOI] [PMC free article] [PubMed] [Google Scholar]
- 8.Levey AS, Stevens LA, Schmid CH, Zhang YL, Castro AF, III, Feldman HI, Kusek JW, Eggers P, Van Lente F, Greene T, et al. A new equation to estimate glomerular filtration rate. Ann Intern Med. 2009;150:604–612. doi: 10.7326/0003-4819-150-9-200905050-00006. [DOI] [PMC free article] [PubMed] [Google Scholar]
- 9.Katsiki N, Athyros VG, Karagiannis A, Mikhailidis DP. Contrast-induced nephropathy: An ‘All or None’ phenomenon? Angiology. 2015;66:508–513. doi: 10.1177/0003319714550309. [DOI] [PubMed] [Google Scholar]
- 10.Selvin E, Marinopoulos S, Berkenblit G, Rami T, Brancati FL, Powe NR, Golden SH. Meta-analysis: Glycosylated hemoglobin and cardiovascular disease in diabetes mellitus. Ann Internal Med. 2004;141:421–431. doi: 10.7326/0003-4819-141-6-200409210-00007. [DOI] [PubMed] [Google Scholar]
- 11.Balkau B, Shipley M, Jarrett RJ, Pyorala K, Pyörälä K, Pyörälä M, Forhan A, Eschwège E. High blood glucose concentration is a risk factor for mortality in middle-aged nondiabetic men. 20-year follow-up in the Whitehall Study, the Paris Prospective Study, and the Helsinki Policemen Study. Diabetes Care. 1998;21:360–367. doi: 10.2337/diacare.21.3.360. [DOI] [PubMed] [Google Scholar]
- 12.Xu Y, Wang L, He J, Bi Y, Li M, Wang T, Wang L, Jiang Y, Dai M, Lu J, et al. Prevalence and control of diabetes in Chinese adults. JAMA. 2013;310:948–959. doi: 10.1001/jama.2013.168118. [DOI] [PubMed] [Google Scholar]
- 13.McCullough PA, Wolyn R, Rocher LL, Levin RN, Oneill WW. Acute renal failure after coronary intervention: Incidence, risk factors, and relationship to mortality. Am J Med. 1997;103:368–375. doi: 10.1016/S0002-9343(97)00150-2. [DOI] [PubMed] [Google Scholar]
- 14.Norhammar A, Tenerz Å, Nilsson G, Hamsten A, Efendíc S, Rydén L, Malmberg K. Glucose metabolism in patients with acute myocardial infarction and no previous diagnosis of diabetes mellitus: A prospective study. Lancet. 2002;359:2140–2144. doi: 10.1016/S0140-6736(02)09089-X. [DOI] [PubMed] [Google Scholar]
- 15.Naruse H, Ishii J, Hashimoto T, Kawai T, Hattori K, Okumura M, Motoyama S, Matsui S, Tanaka I, Izawa H, et al. Pre-procedural glucose levels and the risk for contrast-induced acute kidney injury in patients undergoing emergency coronary intervention. Circ J. 2012;76:1848–1855. doi: 10.1253/circj.CJ-11-1248. [DOI] [PubMed] [Google Scholar]
- 16.Allison SP, Tomlin PJ, Chamberlain MJ. Some effects of anaesthesia and surgery on carbohydrate and fat metabolism. Br J Anaesth. 1969;41:588–593. doi: 10.1093/bja/41.7.588. [DOI] [PubMed] [Google Scholar]
- 17.Shacham Y, Steinvil A, Arbel Y. Acute kidney injury among ST elevation myocardial infarction patients treated by primary percutaneous coronary intervention: A multifactorial entity. J Nephrol. 2016;29:169–174. doi: 10.1007/s40620-015-0255-4. [DOI] [PubMed] [Google Scholar]
- 18.Park KW, Koo BK, Kim HL, Kim YS, Jo SH, Lee HY, Kang HJ, Cho YS, Chung WY, Yeon TJ, et al. The incidence and predictors of contrast-induced nephropathy in adequately hydrated elderly patients with impaired renal function. Nephrol Dial Transplant. 2007;22:1794–1795. doi: 10.1093/ndt/gfm074. [DOI] [PubMed] [Google Scholar]
- 19.Persson PB, Tepel M. Contrast medium-induced nephropathy: The pathophysiology. Kidney Int Suppl. 2006:S8–S10. doi: 10.1038/sj.ki.5000367. [DOI] [PubMed] [Google Scholar]
- 20.O'Donnell DH, Moloney MA, Bouchier-Hayes DJ, Lee MJ. Contrast-induced nephrotoxicity: Possible synergistic effect of stress hyperglycemia. AJR Am J Roentgenol. 2010;195:W45–W49. doi: 10.2214/AJR.09.2847. [DOI] [PubMed] [Google Scholar]
- 21.Goldstein DE, Little RR, Lorenz RA, Malone JI, Nathan DM, Peterson CM. American Diabetes Association: Tests of glycemia in diabetes. Diabetes Care. 2004;27(Suppl 1):S91–S93. doi: 10.2337/diacare.27.7.1761. [DOI] [PubMed] [Google Scholar]
- 22.Chinese Diabetes Society, corp-author. China Guideline For Type 2 Diabetes (2013 Edition) Chin J Diabet Mellitus. 2014;6:447–498. (In Chinese) [Google Scholar]
- 23.Azzalini L, Spagnoli V, Ly HQ. Contrast-induced nephropathy: From pathophysiology to preventive strategies. Can J Cardiol. 2016;32:247–255. doi: 10.1016/j.cjca.2015.05.013. [DOI] [PubMed] [Google Scholar]
- 24.Subramaniam RM, Suarez-Cuervo C, Wilson RF, Turban S, Zhang A, Sherrod C, Aboagye J, Eng J, Choi MJ, Hutfless S, Bass EB. Effectiveness of prevention strategies for contrast-induced nephropathy: A systematic review and meta-analysis. Ann Intern Med. 2016;164:406–416. doi: 10.7326/M15-1456. [DOI] [PubMed] [Google Scholar]
Associated Data
This section collects any data citations, data availability statements, or supplementary materials included in this article.
Data Availability Statement
The analyzed data sets generated during the study are available from the corresponding author on reasonable request.