

Abstract
The role of Ca2+-activated Cl− current (ICl(Ca)) in cardiac arrhythmias is still controversial. It can generate delayed afterdepolarizations in Ca2+-overloaded cells while in other studies incidence of early afterdepolarization (EAD) was reduced by ICl(Ca). Therefore our goal was to examine the role of ICl(Ca) in spatial and temporal heterogeneity of cardiac repolarization and EAD formation.
Experiments were performed on isolated canine cardiomyocytes originating from various regions of the left ventricle; subepicardial, midmyocardial and subendocardial cells, as well as apical and basal cells of the midmyocardium. ICl(Ca) was blocked by 0.5 mmol/L 9-anthracene carboxylic acid (9-AC). Action potential (AP) changes were tested with sharp microelectrode recording. Whole-cell 9-AC-sensitive current was measured with either square pulse voltage-clamp or AP voltage-clamp (APVC). Protein expression of TMEM16A and Bestrophin-3, ion channel proteins mediating ICl(Ca), was detected by Western blot.
9-AC reduced phase-1 repolarization in every tested cell. 9-AC also increased AP duration in a reverse rate-dependent manner in all cell types except for subepicardial cells. Neither ICl(Ca) density recorded with square pulses nor the normalized expressions of TMEM16A and Bestrophin-3 proteins differed significantly among the examined groups of cells. The early outward component of ICl(Ca) was significantly larger in subepicardial than in subendocardial cells in APVC setting. Applying a typical subepicardial AP as a command pulse resulted in a significantly larger early outward component in both subepicardial and subendocardial cells, compared to experiments when a typical subendocardial AP was applied.
Inhibiting ICl(Ca) by 9-AC generated EADs at low stimulation rates and their incidence increased upon beta-adrenergic stimulation. 9-AC increased the short-term variability of repolarization also.
We suggest a protective role for ICl(Ca) against risk of arrhythmias by reducing spatial and temporal heterogeneity of cardiac repolarization and EAD formation.
Keywords: Ca2+-activated Cl− current, TMEM16A, Bestrophin-3, Spatial heterogeneity of repolarization, Short-term variability of repolarization, Early afterdepolarization
1. Introduction
In cardiac arrhythmias the regular electrical activity of the heart is altered. Some of these arrhythmias can be life-threatening tachyarrhythmias like torsades de pointes ventricular tachycardia (TdP) and ventricular fibrillation (VF). These tachyarrhythmias can result in sudden cardiac death which is the major cause of mortality in Europe and in the USA [1,2].
Cardiac action potentials (APs) characteristically differ between regions of the working myocardium. Inhomogeneity of repolarization is a peculiarity of even healthy myocardium and includes transmural dispersion of repolarization [3], the apico-basal gradient in repolarization [4] as well as different repolarization times in left versus right ventricular muscle [5]. This regional heterogeneity contributes to development of ECG waves [6] whereas the increase of this heterogeneity is considered to be arrhythmogenic by possible reentry formation [7,8].
QT interval prolongation is considered as a risk factor of cardiac arrhythmias as it promotes the development of the highly arrhythmogenic early afterdepolarizations (EADs) and TdP [9]. Short-term variability of repolarization has a higher predictive value than the extent of QT interval prolongation [10]. This temporal heterogeneity of repolarization can be measured on isolated cells and monitored as the variability of ventricular AP duration (APD) [11,12].
Abnormalities of intracellular Ca2+ homeostasis (Ca2+ overload and spontaneous Ca2+ release from the sarcoplasmic reticulum (SR)) may also influence the onset of TdP [13]. Spontaneous SR Ca2+ release activates the Ca2+ removal mechanisms of the cell generating a transient inward current leading to membrane depolarization (delayed afterdepolarization, DAD) and triggered activity. The source of the transient inward current can be the Na+/Ca2+ exchange current (INCX) operating in forward mode or the activation of Ca2+-activated Cl− current (ICl(Ca)) [14,15].
ICl(Ca) is present in mammalian myocardium where it contributes to early repolarization [16] and to DAD formation at least in Ca2+-overloaded cells [15,17]. On the contrary, incidence of both EADs and DADs evoked by various stimulations was increased in the presence of 9-anthracene carboxylic acid (9-AC), an inhibitor of ICl(Ca) in canine ventricular cells [18] suggesting an antiarrhythmic role for ICl(Ca). Similarly, ICl(Ca) may play an important role in the prevention of arrhythmias in acidosis in rabbit ventricular myocytes [19]. This however was not the case in an ovine EAD model where 4,4′-diisothiocyanostilbene-2,2′-disulfonic acid (DIDS), another inhibitor of ICl(Ca), barely had any action [20]. These conflicting results need further clarification to determine the pro-, or antiarrhythmic role of ICl(Ca).
The molecular identity of ICl(Ca) is still controversial but TMEM16A (also known as Anoctamin1 or Ano1) [21–23] and Bestrophins are the most likely candidates, the latter ones at least as the Ca2+-sensitive channel subunits [24]. More and more information is available on the physiological functions of TMEM16 in smooth muscle [25], neuronal and other tissues [26]. Moreover, TMEM16A is expressed in murine ventricle and it was confirmed to be responsible for ICl(Ca) in ventricular myocytes [27]. Previously we have confirmed the expression of TMEM16A and Bestrophin-3 on both canine and human isolated left ventricular cardiomyocytes [28]. It was also shown that these two proteins co-localize with each other and Cav1.2 suggesting a direct control of ICl(Ca) by Ca2+ entry through L-type Ca2+ channels (LTCCs) in canine ventricular myocytes [28]. Although a previous publication found no evidence for the existence of ICl(Ca) in healthy human ventricular myocytes [29] but this was not confirmed later. Only two other publications used human cells but in both studies the examined cells were obtained from patients with end-stage heart failure [20,30] and only extrapolated to healthy human tissue from the fact that heart failure does not change the density of ICl(Ca) in sheep ventricle [20].
The goal of our study was to assess the possible role of ICl(Ca) in spatial and temporal heterogeneity of cardiac repolarization using two techniques which are probably the closest to physiological conditions.
First, conventional sharp microelectrode recordings were performed to assess the role of ICl(Ca) on AP of cells isolated from various regions of the left ventricular myocardium (subepicardial, midmyocardial and subendocardial layers and the apical and basal parts of the midmyocardial layer). Second, action potential voltage-clamp (APVC) technique was used to record ICl(Ca) profiles as 9-AC-sensitive current (I9-AC) under experimental conditions designed to closely mimic physiological conditions (with preserved intracellular Ca2+ homeostasis). The normalized expression of TMEM16A and Bestrophin-3 proteins were calculated from Western blot images performed on isolated myocytes obtained from the previously mentioned regions.
Our results indicate that ICl(Ca) reduces both regional (transmural and apico-basal) and temporal (short-term variability of APD) heterogeneity of repolarization suggesting an antiarrhythmic role for the current. Neither ICl(Ca) density recorded with square pulses nor the normalized expressions of TMEM16A and Bestrophin-3 proteins differed significantly among the examined cells of various origin. ICl(Ca) densities measured with APVC in subepicardial cells were larger than that in subendocardial ones probably due to the larger Ca2+ entry through LTCCs during subepicardial APs.
2. Methods
A detailed description of the applied methods including electrophysiology protocols, composition of solutions, molecular biological reagents, etc. is provided in the Online Supplement.
All animal handling and laboratory procedures conform to the Guide for the Care and Use of Laboratory Animals published by the US National Institutes of Health (NIH publication no. 85-23, revised 1996), and to our Institutional Animal Care and Use Committee approved protocols (license no. 10/2011/DEMÁB). Chemicals and reagents were purchased from Sigma-Aldrich Co. (St. Louis, MO, USA) if not specified otherwise. All experiments except for molecular biological techniques were performed at 37 °C and pH = 7.4.
Experiments were performed in enzymatically isolated myocytes obtained from various regions of the canine left ventricle. Following digestion, thin slices were peeled off from both epicardial and endocardial surfaces of the left ventricle containing subepicardial (EPI) and subendocardial (ENDO) cells, respectively. Midmyocardial (MID) cells were obtained from the middle portion of the left ventricular free wall. In separate experiments, cells were collected from the apical and basal parts of the midmyocardial layer of the left ventricular wall.
APs were measured with sharp microelectrode recording during steady-state stimulation. Ionic currents were recorded using conventional whole-cell voltage clamp and APVC techniques. In the latter case the cell’s own action potential was used as a command signal to record current profiles. ICl(Ca) was dissected using 0.5 mmol/L 9-AC and presented as I9-AC (Supplementary Fig. 1). 9-AC is suitable to study ICl(Ca) as it evoked maximal effect on AP in 0.5 mmol/L concentration and did not alter L-type Ca2+ current (ICa,L), IKr, the slow component of delayed rectifier K+ current (IKs), and the inward rectifier K+ current (IK1) [31]. Moreover, neither the transient outward K+ current (Ito1) nor the intracellular Ca2+ concentration ([Ca2+]i) was influenced by 0.5 mmol/L 9-AC (Supplementary Fig. 2). Furthermore, 9-AC-sensitive current recorded in rabbit myocytes was completely different from apamin-sensitive current (Supplementary Fig. 3) but identical to the CaCCinh-A01-sensitive current (Supplementary Fig. 4) suggesting the lack of 9-AC action on small conductance Ca2+-activated K+ current (ISK) channels and the suitability of 9-AC for the study of ICl(Ca).
Short-term variability of repolarization (SV) was evaluated from a series of 50 consecutive APs evoked by 1 Hz steady-state stimulation and presented in Poincaré diagrams to visualize drug-induced changes in SV as previously [12]. The overall probability of differences between consecutive APD90 values in each cell was averaged and plotted (Fig. 6E, F) to illustrate any changes in SV.
Fig. 6.
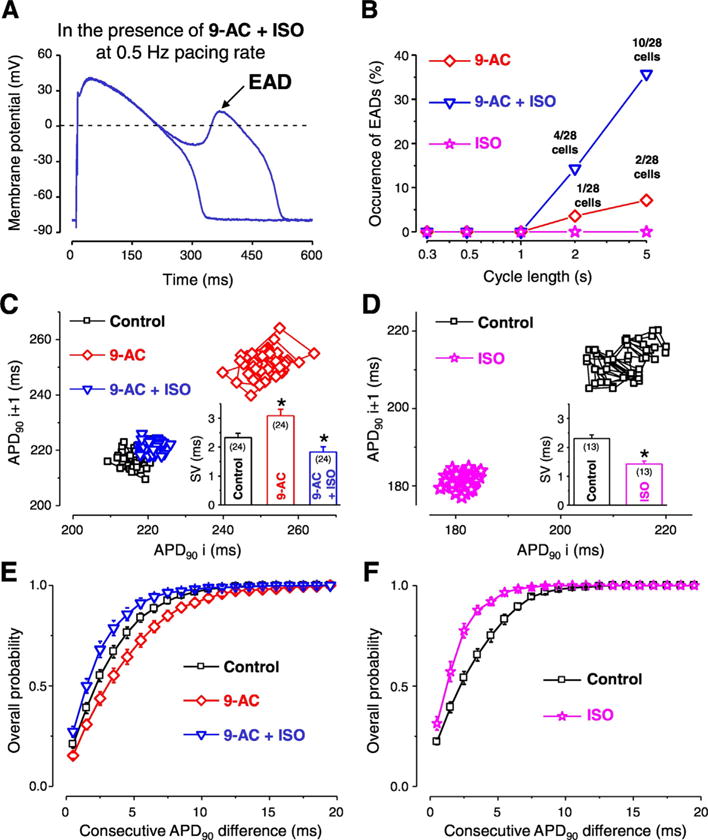
Contribution of ICl(Ca) to the short-term variability of repolarization (SV) and formation of early afterdepolarization (EAD). Representative APs recorded at 0.5 Hz pacing rate in the simultaneous presence of 0.5 mmol/L 9-AC and 10 nmol/L isoproterenol (ISO) (A). Occurrence of EAD in the presence of 9-AC alone (red diamonds), ISO alone (pink stars) and in the simultaneous presence of 9-AC and ISO (blue triangles) as a function of steady-state CL (B). Representative Poincaré plots generated from 50 consecutive APs recorded in control (black squares), 9-AC (red diamonds) and in 9-AC + ISO (blue triangles) (C). On the inset of panel C the average SV values are shown. Representative Poincaré plots generated from 50 consecutive APs recorded from another cell in control (black squares) and in the presence of ISO (pink stars) and average SV values in the inset (D). Overall probability of consecutive APD90 differences generated from 24 measurements in control (black squares), 9-AC (red diamonds), and in 9-AC + ISO (blue triangles) conditions (E). Overall probability of consecutive APD90 differences generated from 13 measurements in control (black squares) and ISO (pink stars) (F). Columns, symbols and bars indicate mean ± SEM values. Asterisks denote significant difference from control, n shows the number of experiments. (For interpretation of the references to colour in this figure legend, the reader is referred to the web version of this article.)
Protein expression of TMEM16A and Bestrophin-3 was detected by Western blot in samples obtained from the previously mentioned five types of isolated ventricular myocytes.
All values are presented as arithmetic means ± Standard Error of the Mean (SEM). The number of cells in each experimental group was reported in the figures, and the cells in each group came from at least three animals. Given the biological variability among cells, each cell was treated as independent in the statistical tests, although more cells could be obtained from the same animal. Statistical significance of differences was evaluated using one-way ANOVA to compare multiple groups and Bonferroni posttest was used for pairwise comparisons. Statistical significance of a treatment was evaluated using Student’s paired t-test. Differences were considered significant when p was less than 0.05 and indicated with either asterisks or + symbols.
3. Results
3.1. The contribution of ICl(Ca) to the AP contour differs in various transmural layers of canine left ventricular myocardium
First the effect of ICl(Ca) inhibition achieved by 0.5 mmol/L 9-AC was evaluated in isolated myocytes obtained from various layers of the left ventricular anterior wall (Fig. 1). After the stabilization of the AP shape, APs were recorded in steady-state conditions starting with 5 s cycle length (CL), and then procedure was repeated using progressively smaller CLs in control solution. After recording steady-state APs at five different CLs the CL was changed back to 5 s and 9-AC was perfused. When the effect of 9-AC developed (typically 7–8 min) the AP recordings at changing CLs were repeated as before. Finally the washout of the inhibitor was performed to test the reversibility of 9-AC-induced AP changes.
Fig. 1.
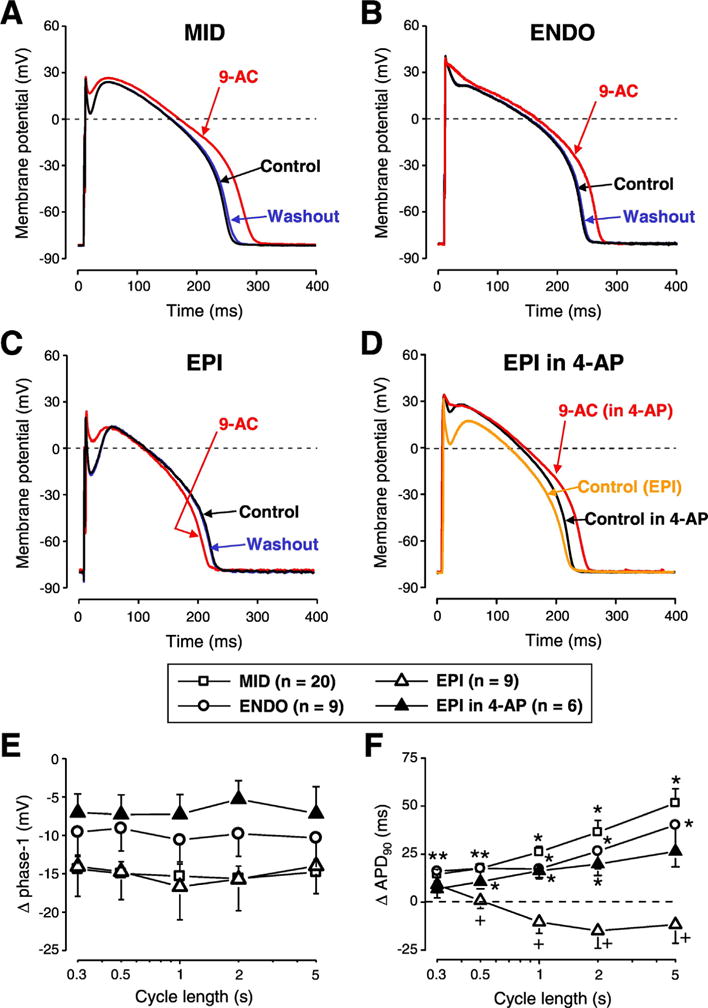
The contribution of ICl(Ca) to the AP contour differs in various transmural layers of canine left ventricular myocardium. Representative APs recorded in control conditions (black), in the presence of 0.5 mmol/L 9-anthracene carboxylic acid (9-AC) (red) and after washout (blue) in cells obtained from midmyocardium (A, MID), subendocardium (B, ENDO) and subepicardium (C, EPI). Panel D shows a representative experiment where 9-AC was used in the presence of 1 mmol/L 4-aminopyridine (4-AP) in an EPI cell. 9-AC-induced changes in phase-1 (E) and APD90 (F) are shown in various cell types and conditions as indicated by the symbols. Symbols and bars represent mean ± SEM values, n shows the number of experiments. On panel E every 9-AC induced change in phase-1 was statistically significant. On panels F asterisks denote 9-AC-induced significant changes while + signs indicate significant difference between EPI and EPI in the presence of 4-AP. (For interpretation of the references to colour in this figure legend, the reader is referred to the web version of this article.)
9-AC reduced phase-1 repolarization of AP in all cell types studied (Fig. 1A-C, 1E). ICl(Ca) inhibition increased APD90 in MID and ENDO cells (Fig. 1A-B, F) but did not significantly change APD90 values of EPI cells (Fig. 1C, F). Action potential duration was altered by 9-AC in a reverse rate-dependent manner in MID and ENDO cells (Fig. 1F). Every 9-AC-induced change of AP parameters was reversible within the 10–15 min of washout (Fig. 1A-C). Resting membrane potential (RMP) and Vmax values were not altered by 9-AC.
To study the possible reasons of the observed transmural differences of 9-AC-induced AP changes, 1 mmol/L 4-aminopyridine (4-AP, inhibitor of Ito1) was applied in EPI cells to reduce phase-1. This intervention altered the AP contour of EPI cells in a way that it became similar to APs of ENDO cells (Fig. 1D). The application of 9-AC in the continuous presence of 4-AP altered AP parameters the same way as it was observed in ENDO cells (Fig. 1E-G) namely 9-AC prolonged APD in 4-AP pretreated EPI cells. AP parameters (mean ± SEM values) measured in the absence and presence of 9-AC are summarized in Table 1.
Table 1.
AP parameters at 1 Hz stimulation rate in cells obtained from various transmural layers.
| EPI (n = 9)
|
ENDO (n = 9)
|
EPI in 4-AP (n = 6)
|
MID (n = 20)
|
|||||
|---|---|---|---|---|---|---|---|---|
| Control | 9-AC | Control | 9-AC | Control | 9-AC | Control | 9-AC | |
| APD90 (ms) | 219 ± 9 | 208 ± 8 | 225 ± 10 | 243 ± 11 | 225 ± 16 | 241 ± 17 | 261 ± 9 | 287 ± 9 |
| phase-1 (mV) | 34.7 ± 2.6 | 18.1 ± 4.2 | 12.0 ± 2.7 | 1.4 ± 0.9 | 10.8 ± 2.7 | 3.5 ± 1.1 | 24.8 ± 1.7 | 9.4 ± 2.2 |
| RMP (mV) | −80.2 ± 0.8 | −80.5 ± 0.8 | −79.5 ± 1.2 | −81.5 ± 1.2 | −79.3 ± 0.8 | −80.1 ± 1.1 | −80.8 ± 0.8 | −81.8 ± 0.8 |
| Vmax (V/s) | 193 ± 16 | 190 ± 16 | 184 ± 23 | 181 ± 21 | 178 ± 15 | 176 ± 15 | 190 ± 13 | 188 ± 12 |
3.2. Apico-basal differences in 9-AC-induced changes of AP parameters
Similar experiments were performed on cells isolated from the apical and basal parts of the left ventricular midmyocardium. APD90 was increased while phase-1 repolarization was reduced by 9-AC similarly in both types of cells (Fig. 2). The reverse rate-dependent lengthening of AP was greater in basal cells and this difference was significant at 0.5 and 1 s CLs (Fig. 2D). In concordance with our results with cells isolated from various transmural layers, 9-AC had no influence on RMP and Vmax values and its effects on AP parameters were reversible (Fig. 2A, B). AP parameters (mean ± SEM values) measured in apical and basal cells are summarized in Table 2.
Fig. 2.
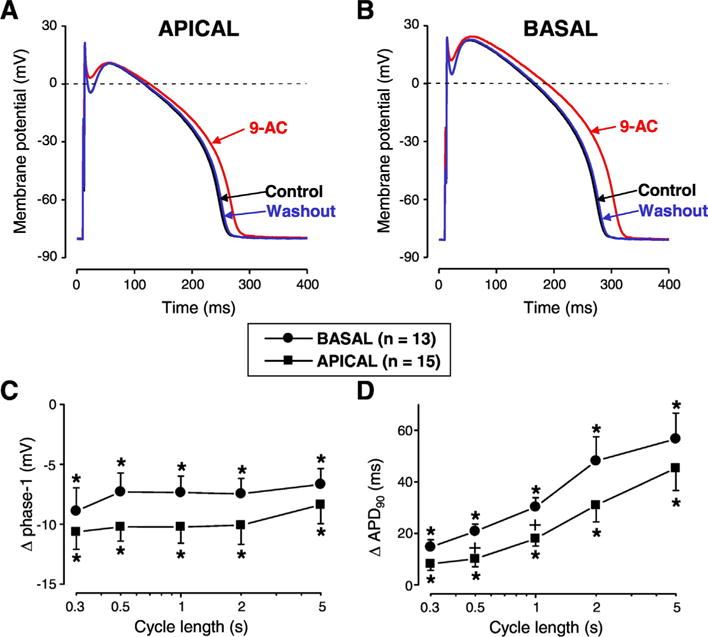
Apico-basal differences of 9-AC-induced AP changes. Reversible AP changes induced by 9-AC in cells obtained from apical (A) and basal cells (B) of canine left ventricular midmyocardium. Frequency-dependent changes in phase-1 (C) and APD90 (D) were measured in apical (squares) and basal cells (circles). Symbols and bars represent mean ± SEM values. Asterisks denote significant 9-AC-induced changes. + signs indicate significant difference between apical and basal cells, n shows the number of experiments.
Table 2.
AP parameters at 1 Hz stimulation rate in cells obtained from apical and basal cells.
| Apical (n = 15)
|
Basal (n = 13)
|
|||
|---|---|---|---|---|
| Control | 9-AC | Control | 9-AC | |
| APD90 (ms) | 234 ± 9 | 252 ± 10 | 252 ± 12 | 282 ± 11 |
| phase-1 (mV) | 26.3 ± 2.4 | 16.1 ± 2.5 | 23.1 ± 2.0 | 14.0 ± 2.4 |
| RMP (mV) | −82.6 ± 0.7 | −81.6 ± 0.7 | −81.3 ± 0.8 | −81.4 ± 0.9 |
| Vmax (V/s) | 205 ± 7 | 202 ± 8 | 176 ± 8 | 174 ± 9 |
3.3. Equal ICl(Ca) densities, TMEM16A and Bestrophin-3 expression levels in cardiomyocytes obtained from various left ventricular regions
To examine the possible reason for the previously described differences in 9-AC-induced AP changes we looked for any potential differences in ICl(Ca) densities and protein expression levels of TMEM16A and Bestrophin-3, the most likely candidates responsible for ICl(Ca). 9-AC-sensitive current densities were measured using conventional square pulses in cells of various origin of the left ventricle (Fig. 3A). ICl(Ca) densities were equal regardless of the origin of the studied cell. This was the case not only for the transmural (Fig. 3B) but also for the apico-basal (Fig. 3C) gradient. ICl(Ca) started to activate at −20 mV and had its highest value at +60 mV in all studied cell types (Fig. 3B, C) similarly to our earlier studies [28,31].
Fig. 3.
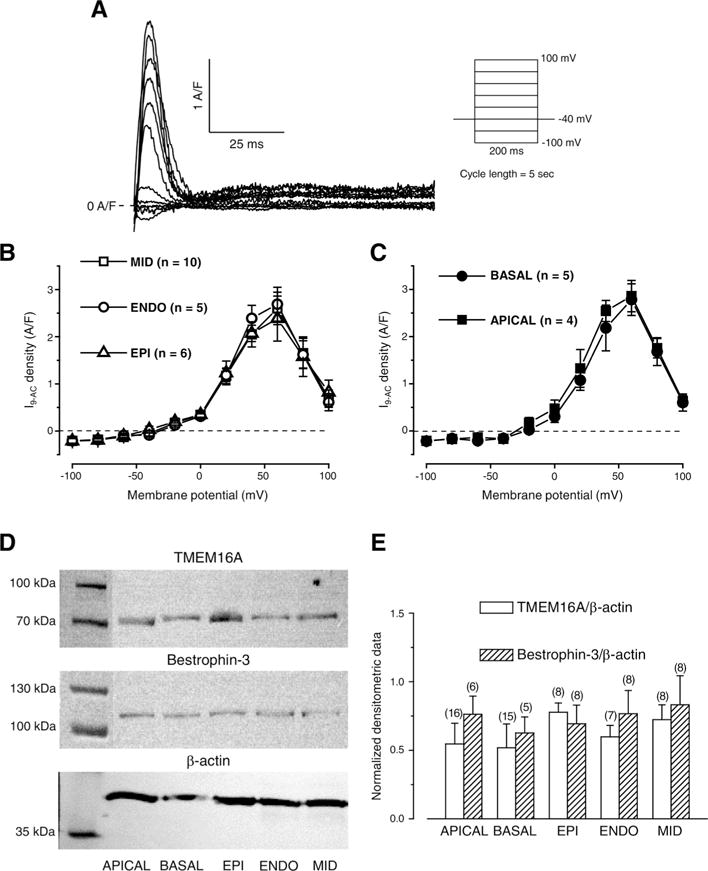
Regional ICl(Ca) densities and normalized expression levels of TMEM16A and Bestrophin-3. Representative 0.5 mmol/L 9-AC-sensitive currents (I9-AC) evoked with the stimulation protocol shown on the right side (A). Voltage dependence of I9-AC measured in cells obtained from various left ventricular layers (B) and from apical and basal regions of the left ventricular midmyocardium (C) using conventional square pulses. Representative Western blot images (D) showing expression of TMEM16A, Bestrophin-3, and β-actin (from top to bottom). Densitometrical values of TMEM16A (empty columns) and Bestrophin-3 (striped columns) both normalized to β-actin (E). Columns and bars indicate mean ± SEM values, n shows the number of experiments.
The expression levels of both TMEM16A and Bestrophin-3 were detected together with that of β-actin (Fig. 3D). Similarly to current densities, equal expression levels were observed for both TMEM16A and Bestrophin-3 when normalized to β-actin expression in all studied cell types (Fig. 3E).
Based on the square pulse voltage clamp data and protein expression results, the previously seen differential 9-AC-induced AP changes could not due to the differences in channel expression.
3.4. Transmural heterogeneity of ICl(Ca) profiles measured with APVC
To explain the cause of differences in 9-AC-induced AP changes among left ventricular cells of various origins we studied ICl(Ca) profiles, recorded as I9-AC, with APVC. Using this technique we could activate ICl(Ca) with the previously recorded own AP of each studied cell as voltage command to test the importance of AP contour in the activation of the current. Moreover, the pipette solution did not contain any calcium buffers or Ca2+ so [Ca2+]i was not altered artificially. I9-AC profiles were similar in dynamics in each cell type derived from various transmural regions of the left ventricular wall regardless of the marked and well-known difference in the shape of the APs (Fig. 4A). I9-AC profiles consisted from an early, large, and fast outward component corresponding to phase-1 of APs followed by a late, small, and inward component (Fig. 4B). However, both the peak current density and the normalized total charge values of the outward component were statistically larger in EPI cells compared to ENDO ones (Fig. 4C, D).
Fig. 4.
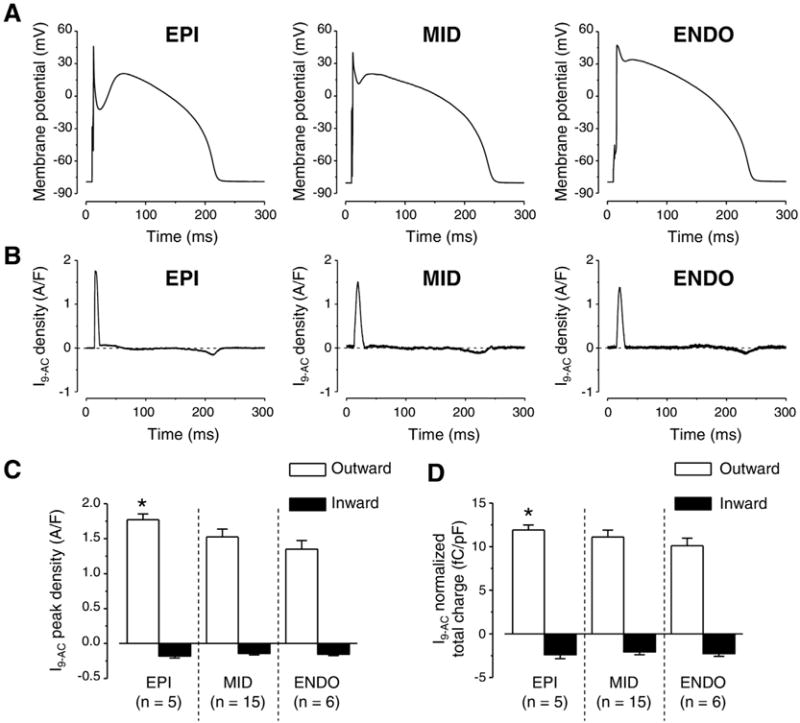
Transmural variation of ICl(Ca) profiles obtained with AP voltage-clamp recordings. Representative APs obtained in EPI, MID, and ENDO cells from left to right (A) and the corresponding ICl(Ca) profiles (B) recorded as 0.5 mmol/L 9-AC-sensitive currents (I9-AC) are illustrated. I9-AC peak densities (C) and total charges (D) measured during outward (white columns) and inward currents (black columns). Columns and bars indicate mean ± SEM values, asterisks denote significant differences between EPI and ENDO, n shows the number of experiments.
3.5. Dependence of ICl(Ca) profiles on the shape of the AP
To further investigate the possible reason for the greater current peak and total charge values measured in EPI cells with APVC and the markedly different actions of 9-AC on APs of EPI cells the following strategy was used. Typical ENDO and EPI APs (Fig. 5A and B, respectively) were selected and used as voltage commands in APVC experiments in both ENDO and EPI cells. The theory behind this experiment was to test the importance of the shape of the AP command waveform in activation of ICl(Ca). I9-AC profiles were very similar in dynamics with both stimulus waveforms in both ENDO cells (Fig. 5C) and EPI cells (Fig. 5D). There was however a difference in the peak current density and total charge values of the early outward component as activating ICl(Ca) with EPI waveforms always resulted in larger values independent from which cell type was used to record ICl(Ca) (Fig. 5E, F).
Fig. 5.
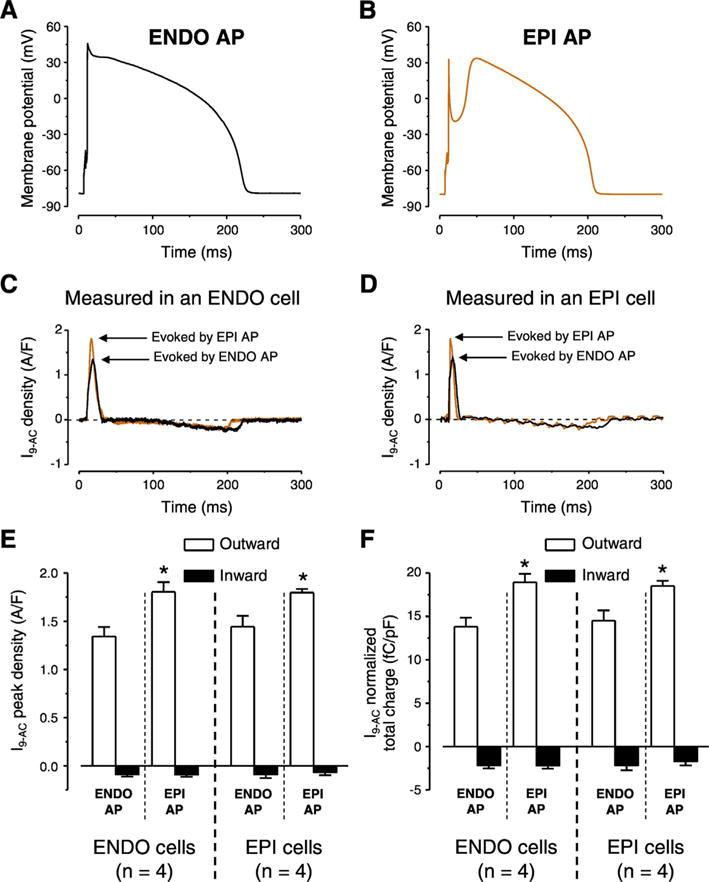
AP configuration dependent ICl(Ca) profiles measured with APVC conditions. Typical ENDO (A) and EPI (B) APs used as voltage commands in cells obtained from both ENDO and EPI layers. ICl(Ca) profiles recorded as 0.5 mmol/L 9-AC-sensitive currents (I9-AC) in ENDO (C) and EPI cell (D) using the two typical AP waveforms. I9-AC peak densities (E) and normalized total charges (F) measured during outward (white columns) and inward currents (black columns) by the indicated waveforms on given cell types. Columns and bars show mean ± SEM values. Asterisks denote significant differences between EPI and ENDO AP evoked I9-AC parameters, n shows the number of experiments.
3.6. Role of ICl(Ca) in EAD generation and short-term variability of repolarization (SV)
EAD is a depolarization occurring before complete repolarization, during the plateau phase of the AP and considered to be responsible for the initiation of malignant cardiac arrhythmias [32]. During our experiments 0.5 mmol/L 9-AC induced EADs in a small percentage of cells only at long CL stimulation (Fig. 6A, B). Increasing [Ca2+]i by the application of the non-specific β-adrenergic agonist isoproterenol (ISO, 10 nmol/L) did not evoke EADs at any studied CLs in the absence of 9-AC but the simultaneous application of the two compounds resulted in much higher EAD occurrence, especially at long CLs (Fig. 6B).
The short-term variability of QT interval has a better predictive value regarding the development of cardiac arrhythmias than the duration of the QT interval itself [9,10]. As QT interval corresponds to the duration of ventricular AP, short-term variability of QT interval can be represented as short-term variability of AP duration (SV) on the cellular level. It must be emphasized that these experiments were done at 1 Hz steady-state pacing, therefore the recorded changes in either APD or SV could not be due to EAD occurrence. To better illustrate SV, Poincaré diagrams are usually plotted where either the duration of APs (APD90) or QT intervals are presented as a function of the previous APD90 or QT interval duration values. 9-AC increased APD90 whereas the addition of ISO abolished this AP prolongation (Fig. 6C). Average of SV values in the 24 studied cells was larger in the presence of 9-AC (3.1 ± 0.2 ms) but the addition of ISO reduced the SV to a smaller value (1.8 ± 0.2 ms) than that calculated in control condition (2.3 ± 0.1 ms) (inset of Fig. 6C). However, without 9-AC pretreatment ISO decreased SV to an even smaller value (1.4 ± 0.1 ms) (inset of Fig. 6D). Even more importantly, upon evaluating the dispersion of differences in consecutive APD90 values in the presence of 9-AC the cumulative distribution curve was shifted toward greater beat-to-beat variability, indicating the increase of differences in consecutive APD90 values (Fig. 6E, F).
4. Discussion
4.1. Influence of ICl(Ca) on AP configuration and spatial heterogeneity of repolarization
Similarly to our previous study [31] 9-AC did not modify Vmax in any studied cell type (Tables 1 and 2) indicating its lack of action on fast Na+ current. This makes the drug suitable for studying the role of ICl(Ca) even during AP measurements. 9-AC prolonged APD in both ENDO and MID cells (Fig. 1A, B and F) in line with previous findings [18,31]. In EPI cells, however, there was no AP prolongation (Fig. 1C, F). This can be due to a possible shortening effect induced by IKr accumulation and also by a smaller Ca2+ influx in the absence of a pronounced spike and dome AP configuration [33]. This AP shortening seems to overcome the AP prolongation likely induced by 9-AC. Phase-1 repolarization was reduced by 9-AC in all studied cell types (Fig. 1A-E). Upon the reduction of phase-1 (by partial blockade of Ito1 achieved by 1 mmol/L 4-AP) the shape of the AP in EPI cells became similar to those of ENDO ones. When 9-AC was applied in this condition, changes of AP parameters became practically identical to those observed in ENDO cells (Fig. 1B, D-F). These results suggest that the lack of 9-AC action on APD of EPI cells were due to the pronounced spike and dome configuration of AP created by the large Ito1 density in these cells [34]. This is in good agreement with the conclusion of Zygmunt et al. who suggested an important role for Ito1 in the activation of subsequent ion currents like ICl(Ca) and ICa,L [35].
Our results are in good agreement with an earlier study [36] despite the differences in the experimental conditions. Verkerk et al. used DIDS to inhibit ICl(Ca) in rabbit left ventricular myocytes measured with patch-clamp configuration while here 9-AC was applied during sharp microelectrode recording in canine left ventricular myocytes. Still, they found no AP prolongation in EPI cells except for the fastest stimulation rate of 3.33 Hz. Moreover, similarly to our observation, blockade of ICl(Ca) prolonged the AP in EPI cells at 1 Hz only when DIDS was applied in the presence of Ito1 inhibition [36]. A canine study reported similar findings to our results as APD was increased when phase-1 repolarization was slow and shallow (like in MID and ENDO cells) [35].
Blockade of ICl(Ca) prolonged APD of MID, ENDO and also 4-AP pretreated EPI cells in a reverse rate-dependent manner (Fig. 1F). This concurs with our previous findings about rate-dependent changes of APD in canine [37] and in other mammalian species [38]. Moreover, two other factors might contribute to the 9-AC-induced, rate-dependent AP prolongation. One is the rate-dependent variation of [Ca2+]i as it was shown that [Ca2+]i is larger upon the increase of stimulation rate both during steady-state [31] as well as without steady-state [34]. Moreover, [Ca2+]i correlates well with ICl(Ca) measured as I9-AC with square pulses [31]. Another factor is the rate-dependent behavior of Ito1 density as the availability of its channels reduces at fast stimulation rates due to the relatively slow recovery from inactivation [34]. This is reflected in the fact that phase-1 showed rate-dependent properties in control conditions as it was larger at long CLs. Moreover, this rate-dependence was also present when ICl(Ca) was blocked by 9-AC in all five studied cell types (not shown). Therefore, the rate-dependence of phase-1 seems to be rather modulated by the recovery from inactivation kinetics of Ito1 than the magnitude of ICl(Ca). This emphasizes that reverse rate dependency is an intrinsic property of the myocardium [38]. Therefore, similarly to the study performed on rabbit cells [36] the role of ICl(Ca) in the reduction of transmural APD heterogeneity is more pronounced at slow heart rates. This makes the contribution of ICl(Ca) even more important as the heterogeneity of repolarization is the greatest at slow stimulation rates [39].
Our study is the first to describe the apico-basal contribution of ICl(Ca) to AP configuration (Fig. 2). Our baseline AP parameters were similar to those published earlier [4] and 9-AC-induced changes of AP parameters in the apico-basal direction were similar to those observed in the transmural direction. Again, the heterogeneity of AP repolarization was reduced by ICl(Ca) and this action was the strongest at slow stimulation rates (Fig. 2D).
4.2. Transmural difference in ICl(Ca) and its underlying ion channel proteins
I9-AC could be used to explore the contribution of ICl(Ca) to the AP in closely physiological conditions (without the application of intracellular Ca2+ buffering during APVC) [28]. Regional differences, however, were not studied previously with APVC despite some earlier studies where either a “typical” AP was applied as the command signal during perforated patch recording using nonspecific blockers to dissect ICl(Ca) [35] or 10 mmol/L EGTA was applied in the pipette solution interfering with physiological Ca2+ homeostasis [18]. The current density of I9-AC early outward component was statistically larger in EPI cells compared to what was recorded in ENDO ones (Fig. 4C, D). This EPI-ENDO difference was unexpected as a previous study did not report any transmural difference in ICl(Ca) density in the canine left ventricle [40]. It must be noted that the result of that study is in full agreement with our results as ICl(Ca) densities of EPI and MID cells were compared. ICl(Ca) was not studied in ENDO cells and conventional square pulses were used with the application of the nonspecific blocker (4-acetamido-4′-isothiocyanostilbene-2,2′-disulfonic acid) of the current [40]. Similarly, although 9-AC was used both during APVC and conventional voltage-clamp measurements, in the latter case no difference was found in ICl(Ca) densities of cells obtained from various transmural layers just as upon comparing midmyocardial cells from apical or basal origin (Fig. 3B, C). In line with this, the densities of TMEM16A and Bestrophin-3 proteins (two likely candidates for mediating ICl(Ca) [21–24]) both normalized to β-actin were equal regardless of the origin of the samples (Fig. 3E). In contrast to present results, the amplitude of ICl(Ca) measured with square wave voltage clamp was significantly greater in feline epicardial cells compared to endocardial ones [41] suggesting a potential interspecies difference.
4.3. Larger ICl(Ca) density of EPI cells is determined by the contour of AP
The current density of I9-AC early outward component was statistically larger in EPI cells than that of ENDO ones in APVC conditions (Fig. 4C) and 9-AC induced AP prolongation in ENDO but not in EPI cells (Fig. 1F). On the contrary, I9-AC density was equal with square pulse voltage-clamp measurements (Fig. 4A). It must be noted that during square pulse measurements the stimulus waveform is quite different from the physiological one. Under APVC, however, the previously recorded, own AP was used for physiological stimulation on each studied cell. To test the hypothesis that the AP waveform could be responsible for the larger ICl(Ca) density of EPI cells we used two previously recorded characteristic ENDO (Fig. 5A) and EPI (Fig. 5B) AP waveforms. ENDO AP possessed only a slow and small phase-1 (Fig. 5A) whereas EPI AP had a rapid and large phase-1 followed by a pronounced dome (Fig. 5B). Observations were consistent with our hypothesis as the characteristic EPI AP waveform induced a larger early outward ICl(Ca) current than the ENDO AP waveform no matter whether the waveforms were applied on EPI or ENDO cells (Fig. 5C-F). These results can be explained based on what our group has previously found in case of the nisoldipine-sensitive current on canine and human left ventricular myocytes [33,42]. It was shown that the charge carried by the nisoldipine-sensitive current was significantly larger during EPI AP compared to ENDO one [33]. This could result in a greater activation of ICl(Ca) during the early phase of the AP. It is hard to predict the exact mechanism as the membrane potential also influences the activation of ICl(Ca) beside the [Ca2+]cleft. Although the existence of a marked phase-1 during the EPI AP favors the entry of Ca2+ due to its increased driving force and the I–V characteristics of the LTCCs but this more negative membrane potential actually acts against Cl− influx. Nevertheless, it seems that the overall action of a more pronounced phase-1 (EPI AP) is the increase of the early outward component of ICl(Ca). This larger current is definitely not due to the increased density of channel proteins in EPI cells as the expression of TMEM16A and Bestrophin-3 was equal in both transmural and apico-basal direction (Fig. 4D). Although the expression level of Cav1.2, the pore-forming subunit of LTCCs was not studied in ENDO cells but it was equal in EPI and MID cells [43], similarly to the equal density of TMEM16A and Bestrophin-3 described in the present study.
4.4. Influence of ICl(Ca) on temporal variability of cardiac repolarization and EAD formation
Prolongation of repolarization is considered as a risk factor of cardiac arrhythmias as it can lead to EADs and TdP [9]. The short-term variability of repolarization is considered to be even more important as a predictor of cardiac arrhythmias highlighted by a position statement and consensus guidance were endorsed by the European Heart Rhythm Association jointly with the ESC Working Group on Cardiac Cellular Electrophysiology recently [44].
According to the previously mentioned studies, any SV reducing intervention could have an antiarrhythmic property. It must be emphasized that all of our experiments where SV was calculated were done at 1 Hz steady-state pacing, therefore the recorded changes in either APD or SV could not be due to EAD occurrence. The application of 9-AC induced an increase in SV (inset of Fig. 6C) suggesting an antiarrhythmic role for ICl(Ca). This antiarrhythmic property of ICl(Ca) is further supported by the fact that EADs were detected upon the blockade of ICl(Ca) (in the presence of 9-AC, Fig. 6B). Another evidence supporting the antiarrhythmic role of ICl(Ca) is the even larger EAD incidence in the simultaneous presence of 9-AC and ISO. ISO is well known to increase [Ca2+]i and therefore most probably [Ca2+]cleft as well. This leads to a larger ICl(Ca) [28] which upon its blockade by 9-AC leads to a greater EAD incidence (Fig. 6B).
The value of SV calculated with the formula used in this study and also in earlier publications [12,45] is not necessarily the most sensitive way to indicate if the APD of only a few beats greatly differ from the average. This is especially the case when the APD of 50 consecutive APs are used. However, a large, sudden change in consecutive APD values occurring in a non-uniform manner in cells of various origins within the myocardium will more effectively trigger an arrhythmic event than a gradual and simultaneous increase in APD during the development of the action of a drug [8]. Therefore the difference between consecutive APD values were grouped in ms ranges and the overall probability of their appearance was calculated (Fig. 6E, F) in order to detect any unusually short or long AP among the 50 analyzed one more easily. Using this analysis, 9-AC shifted the curve to the right, indicating an increase of differences between consecutive APD values, hence an arrhythmogenic effect. Moreover, the protective effect of ISO was smaller in the presence of 9-AC as the leftward shift of the curve by ISO was greater in the absence than in the presence of 9-AC. Similarly, in the presence of ISO the value of SV was smaller when 9-AC was not applied (Fig. 6G). Therefore it seems that ICl(Ca) contributes to the ISO induced reduction of SV. These results all support a protective role of ICl(Ca) against cardiac arrhythmia together with the previously mentioned spatial reduction of APD heterogeneity.
Our previous study is congruent with the current results as a protective role of ICl(Ca) was suggested in cesium and ouabain induced canine ventricular myocyte EAD model as well [18]. In contrast, on sheep ventricular cells DIDS barely had any action on parameters of EADs [20]. Apart from the different species, the ovine study used norepinephrine to provoke EADs and studied the action of DIDS, a non-specific blocker of ICl(Ca) which also inhibits Na+ channels [31] on various parameters of EADs. In the current study, however, EADs were not provoked but their incidence was studied in the absence or presence of 9-AC, a more specific blocker of ICl(Ca). Due to these differences it is rather hard to compare these studies.
It must be mentioned that DAD formation can also provoke cardiac arrhythmias by initiating TdP [13]. DADs can be produced not only by the forward mode INCX but also by ICl(Ca) at least in some species and cell types. Indeed, it was shown that activation of ICl(Ca) can be responsible for DAD generation in Ca2+-overloaded canine ventricular [15], rabbit atrial, ventricular and Purkinje [14] and ovine Purkinje and ventricular [46] cells. The presence of ISO-induced chloride current (and DADs) was not detected in canine ventricular cells [47] but in the same experimental conditions a membrane depolarization was described in isolated guinea pig ventricular myocytes [47]. It might be that the application of 1 μmol/L ISO for 20 s was not enough to induce Ca2+ overload in canine cells, hence activation of ICl(Ca) and DADs in that study [47]. Similarly, we did not detect any DADs during our experiments even in the presence of ISO, indicating that 10 nmol/L ISO does not induce Ca2+ overload in canine ventricular myocytes. It was possible to generate DADs by overloading canine cells with Ca2+ using ISO, but it had to be applied in 100 times higher dose together with ouabain [17].
4.5. Summary and potential relevance
The major findings of the present study suggest a protective role for ICl(Ca) against risk of arrhythmias in the canine left ventricular myocardium. ICl(Ca) achieves this by the reduction of both spatial and temporal heterogeneity of repolarization. As it was suggested earlier inhibition of ICl(Ca) could be useful to reduce the Ca2+ overload induced DADs. At the same time, however, the blockade of ICl(Ca) might increase the risk of cardiac arrhythmias by increasing spatial and temporal heterogeneity of repolarization and EAD formation. As it was shown the incidence of EAD formation was even higher when the blockade of ICl(Ca) was established in the presence of ISO. Therefore, in a clinical setting where β-blockers are applied to reduce the heart rate and Ca2+ overload, antiarrhythmic action of ICl(Ca) could be even more pronounced as ICl(Ca) reduces APD heterogeneity at slow heart rates more effectively.
Supplementary Material
Acknowledgments
The authors thank Miss Éva Sági for her excellent technical assistance. The support of the Momentum program (LP2012-41) of the Hungarian Academy of Sciences is gratefully acknowledged.
Funding
This work was funded by the National Research Development and Innovation Office (NKFIH K115397 to PPN and NS; NKFIH K109736 to JM and PPN, NKFIH PD120794 to B Horváth and NKFIH K115461 to LC), the János Bolyai Research Scholarship of the Hungarian Academy of Sciences to MG, NS and B Horváth and the University of Debrecen (RH/751/2015) to NS. The publication is supported by the GINOP-2.3.2-15-2016-00040 project to PPN, NS, JM, TB, RV, LC and B Horváth which is co-financed by the European Union and the European Regional Development Fund. This work was also funded by National Institutes of Health (R01-HL90880 to LTI and YCI; R01-HL123526 to YCI) and the American Heart Association (14GRNT20510041 to YCI).
Funding sources had no involvement in preparation of the article; in study design; in the collection, analysis and interpretation of data; in writing of the report; and in the decision to submit the article for publication.
Abbreviations
- 4-AP
4-aminopyridine
- 9-AC
9-anthracene carboxylic acid
- AP
action potential
- APD
action potential duration
- APD90
action potential duration at 90% of repolarization
- APVC
action potential voltage-clamp
- Cav1.2
pore forming subunit of L-type Ca2+ channel
- [Ca2+]cleft
Ca2+ concentration in the dyadic cleft
- [Ca2+]i
intracellular Ca2+ concentration in bulk cytoplasm
- CL
cycle length
- DAD
delayed afterdepolarization
- DIDS
4,4′-diisothiocyanostilbene-2,2′-disulfonic acid
- EAD
early afterdepolarization
- ENDO
subendocardial cell
- EPI
subepicardial cell
- I9-AC
9-anthracene carboxylic acid-sensitive current
- ICa
L, L-type Ca2+ current
- ICl(Ca)
Ca2+-activated Cl− current
- IK1
inward rectifier K+ current
- IKr
rapid component of delayed rectifier K+ current
- IKs
slow component of delayed rectifier K+ current
- INCX
Na+/Ca2+ exchange current
- ISK
small conductance Ca2+-activated K+ current
- Ito1
transient outward K+ current
- ISO
isoproterenol
- LQT2
type 2 long QT syndrome
- LTCC
L-type Ca2+ channel
- MID
midmyocardial cell
- RMP
resting membrane potential
- SR
sarcoplasmic reticulum
- SV
short-term variability of repolarization
- TdP
torsades de pointes ventricular tachycardia
- Vmax
maximal rate of depolarization
Appendix A. Supplementary data
Supplementary data to this article can be found online at http://dx. doi.org/10.1016/j.yjmcc.2017.06.014.
Footnotes
Disclosures
None.
References
- 1.Huikuri HV, Castellanos A, Myerburg RJ. Sudden death due to cardiac arrhythmias. N Engl J Med. 2001;345:1473–1482. doi: 10.1056/NEJMra000650. http://dx.doi.org/10.1056/NEJMra000650. [DOI] [PubMed] [Google Scholar]
- 2.Fishman GI, Chugh SS, Dimarco JP, Albert CM, Anderson ME, Bonow RO, et al. Sudden cardiac death prediction and prevention: report from a National Heart, Lung, and Blood Institute and Heart Rhythm Society Workshop. Circulation. 2010;122:2335–2348. doi: 10.1161/CIRCULATIONAHA.110.976092. http://dx.doi.org/10.1161/CIRCULATIONAHA.110.976092. [DOI] [PMC free article] [PubMed] [Google Scholar]
- 3.Liu DW, Gintant GA, Antzelevitch C. Ionic bases for electrophysiological distinctions among epicardial, midmyocardial, and endocardial myocytes from the free wall of the canine left ventricle. Circ Res. 1993;72:671–687. doi: 10.1161/01.res.72.3.671. http://dx.doi.org/10.1161/01.RES.72.3.671. [DOI] [PubMed] [Google Scholar]
- 4.Szentadrassy N, Banyasz T, Biro T, Szabo G, Toth BI, Magyar J, et al. Apico-basal inhomogeneity in distribution of ion channels in canine and human ventricular myocardium. Cardiovasc Res. 2005;65:851–860. doi: 10.1016/j.cardiores.2004.11.022. http://dx.doi.org/10.1016/j.cardiores.2004.11.022. [DOI] [PubMed] [Google Scholar]
- 5.Volders PG, Sipido KR, Carmeliet E, Spätjens RL, Wellens HJ, Vos MA. Repolarizing K+ currents ITO1 and IKs are larger in right than left canine ventricular midmyocardium. Circulation. 1999;99:206–210. doi: 10.1161/01.cir.99.2.206. http://dx.doi.org/10.1161/01.CIR.99.2.206. [DOI] [PubMed] [Google Scholar]
- 6.Antzelevitch C, Shimizu W, Yan GX, Sicouri S, Weissenburger J, Nesterenko VV, et al. The M cell: its contribution to the ECG and to normal and abnormal electrical function of the heart. J Cardiovasc Electrophysiol. 1999;10:1124–1152. doi: 10.1111/j.1540-8167.1999.tb00287.x. http://dx.doi.org/10.1111/j.1540-8167.1999.tb00287.x. [DOI] [PubMed] [Google Scholar]
- 7.Baláti B, Varró A, Papp JG. Pharmacological modification of the dispersion of repolarization in the heart: importance of the M cells. Cardiovasc Drugs Ther. 1999;13:491–505. doi: 10.1023/a:1007819503060. http://dx.doi.org/10.1023/A:1007819503060. [DOI] [PubMed] [Google Scholar]
- 8.Varró A, Baczkó I. Possible mechanisms of sudden cardiac death in top athletes: a basic cardiac electrophysiological point of view. Pflugers Arch. 2010;460:31–40. doi: 10.1007/s00424-010-0798-0. http://dx.doi.org/10.1007/s00424-010-0798-0. [DOI] [PubMed] [Google Scholar]
- 9.Lengyel C, Varró A, Tábori K, Papp JG, Baczkó I. Combined pharmacological block of IKr and IKs increases short-term QT interval variability and provokes torsades de pointes. Br J Pharmacol. 2007;151:941–951. doi: 10.1038/sj.bjp.0707297. http://dx.doi.org/10.1038/sj.bjp.0707297. [DOI] [PMC free article] [PubMed] [Google Scholar]
- 10.Thomsen MB, Verduyn SC, Stengl M, Beekman JD, de Pater G, van Opstal J, et al. Increased short-term variability of repolarization predicts d-sotalol-induced torsades de pointes in dogs. Circulation. 2004;110:2453–2459. doi: 10.1161/01.CIR.0000145162.64183.C8. http://dx.doi.org/10.1161/01.CIR.0000145162.64183.C8. [DOI] [PubMed] [Google Scholar]
- 11.Thomsen MB, Truin M, van Opstal JM, Beekman JD, Volders PG, Stengl M, et al. Sudden cardiac death in dogs with remodeled hearts is associated with larger beat-to-beat variability of repolarization. Basic Res Cardiol. 2005;100:279–287. doi: 10.1007/s00395-005-0519-6. http://dx.doi.org/10.1007/s00395-005-0519-6. [DOI] [PubMed] [Google Scholar]
- 12.Szentandrássy N, Kistamás K, Hegyi B, Horváth B, Ruzsnavszky F, Váczi K, et al. Contribution of ion currents to beat-to-beat variability of action potential duration in canine ventricular myocytes. Pflugers Arch. 2015;467:1431–1443. doi: 10.1007/s00424-014-1581-4. http://dx.doi.org/10.1007/s00424-014-1581-4. [DOI] [PubMed] [Google Scholar]
- 13.ter Bekke RM, Volders PG. Arrhythmogenic mechano-electric heterogeneity in the long-QT syndrome. Prog Biophys Mol Biol. 2012;110:347–358. doi: 10.1016/j.pbiomolbio.2012.07.007. http://dx.doi.org/10.1016/j.pbiomolbio.2012.07.007. [DOI] [PubMed] [Google Scholar]
- 14.Szigeti G, Rusznak Z, Kovacs L, Papp Z. Calcium-activated transient membrane currents are carried mainly by chloride ions in isolated atrial, ventricular and Purkinje cells of rabbit heart. Exp Physiol. 1998;83:137–153. doi: 10.1113/expphysiol.1998.sp004097. http://dx.doi.org/10.1113/expphysiol.1998.sp004097. [DOI] [PubMed] [Google Scholar]
- 15.Zygmunt AC, Goodrow RJ, Weigel CM. INaCa and ICl(Ca) contribute to isoproterenol-induced delayed after depolarizations in midmyocardial cells. Am J Phys. 1998;275:H1979–H1992. doi: 10.1152/ajpheart.1998.275.6.H1979. [DOI] [PubMed] [Google Scholar]
- 16.Zygmunt AC, Gibbons WR. Properties of the calcium-activated chloride current in heart. J Gen Physiol. 1992;99:391–414. doi: 10.1085/jgp.99.3.391. http://dx.doi.org/10.1085/jgp.99.3.391. [DOI] [PMC free article] [PubMed] [Google Scholar]
- 17.Collier ML, Levesque PC, Kenyon JL, Hume JR. Unitary Cl− channels activated by cytoplasmic Ca2+ in canine ventricular myocytes. Circ Res. 1996;78:936–944. doi: 10.1161/01.res.78.5.936. http://dx.doi.org/10.1161/01.RES.78.5.936. [DOI] [PubMed] [Google Scholar]
- 18.Fülöp L, Fiák E, Szentandrássy N, Magyar J, Nánási PP, Bányász T. The role of transmembrane chloride current in afterdepolarisations in canine ventricular cardiomyocytes. Gen Physiol Biophys. 2003;22:341–353. [PubMed] [Google Scholar]
- 19.Hirayama Y, Kuruma A, Hiraoka M, Kawano S. Calcium-activated CL− current is enhanced by acidosis and contributes to the shortening of action potential duration in rabbit ventricular myocytes. Jpn J Physiol. 2002;52:293–300. doi: 10.2170/jjphysiol.52.293. http://dx.doi.org/10.2170/jjphysiol.52.293. [DOI] [PubMed] [Google Scholar]
- 20.Verkerk AO, Tan HL, Kirkels JH, Ravesloot JH. Role of Ca2+-activated Cl− current during proarrhythmic early afterdepolarizations in sheep and human ventricular myocytes. Acta Physiol Scand. 2003;179:143–148. doi: 10.1046/j.1365-201X.2003.01190.x. http://dx.doi.org/10.1046/j.1365-201X.2003.01190.x. [DOI] [PubMed] [Google Scholar]
- 21.Caputo A, Caci E, Ferrera L, Pedemonte N, Barsanti C, Sondo E, et al. TMEM16A, a membrane protein associated with calcium-dependent chloride channel activity. Science. 2008;322:590–594. doi: 10.1126/science.1163518. http://dx.doi.org/10.1126/science.1163518. [DOI] [PubMed] [Google Scholar]
- 22.Yang YD, Cho H, Koo JY, Tak MH, Cho Y, Shim WS, et al. TMEM16A confers receptor-activated calcium-dependent chloride conductance. Nature. 2008;455:1210–1215. doi: 10.1038/nature07313. http://dx.doi.org/10.1038/nature07313. [DOI] [PubMed] [Google Scholar]
- 23.Schroeder BC, Cheng T, Jan YN, Jan LY. Expression cloning of TMEM16A as a calcium-activated chloride channel subunit. Cell. 2008;134:1019–1029. doi: 10.1016/j.cell.2008.09.003. http://dx.doi.org/10.1016/j.cell.2008.09.003. [DOI] [PMC free article] [PubMed] [Google Scholar]
- 24.Sun H, Tsunenari T, Yau KW, Nathans J. The vitelliform macular dystrophy protein defines a new family of chloride channels. Proc Natl Acad Sci U S A. 2002;99:4008–4013. doi: 10.1073/pnas.052692999. http://dx.doi.org/10.1073/pnas.052692999. [DOI] [PMC free article] [PubMed] [Google Scholar]
- 25.Dam VS, Boedtkjer DM, Nyvad J, Aalkjaer C, Matchkov V. TMEM16A knockdown abrogates two different Ca2+-activated Cl− currents and contractility of smooth muscle in rat mesenteric small arteries. Pflugers Arch. 2014;466:1391–1409. doi: 10.1007/s00424-013-1382-1. http://dx.doi.org/10.1007/s00424-013-1382-1. [DOI] [PMC free article] [PubMed] [Google Scholar]
- 26.Pedemonte N, Galietta LJ. Structure and function of TMEM16 proteins (anoctamins) Physiol Rev. 2014;94:419–459. doi: 10.1152/physrev.00039.2011. http://dx.doi.org/10.1152/physrev.00039.2011. [DOI] [PubMed] [Google Scholar]
- 27.Ye Z, MM Wu, Wang CY, Li YC, CJ Yu, Gong YF, et al. Characterization of cardiac anoctamin1 Ca-activated chloride channels and functional role in ischemia-induced arrhythmias. J Cell Physiol. 2015;230:337–346. doi: 10.1002/jcp.24709. http://dx.doi.org/10.1002/jcp.24709. [DOI] [PMC free article] [PubMed] [Google Scholar]
- 28.Horváth B, Váczi K, Hegyi B, Gönczi M, Dienes B, Kistamás K, et al. Sarcolemmal Ca2+-entry through L-type Ca2+ channels controls the profile of Ca2+-activated Cl− current in canine ventricular myocytes. J Mol Cell Cardiol. 2016;97:125–139. doi: 10.1016/j.yjmcc.2016.05.006. http://dx.doi.org/10.1016/j.yjmcc.2016.05.006. [DOI] [PubMed] [Google Scholar]
- 29.Köster OF, Szigeti GP, Beuckelmann DJ. Characterization of a [Ca2+]i-dependent current in human atrial and ventricular cardiomyocytes in the absence of Na+ and K+ Cardiovasc Res. 1999;41:175–187. doi: 10.1016/s0008-6363(98)00202-8. http://dx.doi.org/10.1016/S0008-6363(98)00202-8. [DOI] [PubMed] [Google Scholar]
- 30.Verkerk AO, Veldkamp MW, Baartscheer A, Schumacher CA, Klöpping C, van Ginneken AC, et al. Ionic mechanism of delayed afterdepolarizations in ventricular cells isolated from human end-stage failing hearts. Circulation. 2001;104:2728–2733. doi: 10.1161/hc4701.099577. http://dx.doi.org/10.1161/hc4701.099577. [DOI] [PubMed] [Google Scholar]
- 31.Váczi K, Hegyi B, Ruzsnavszky F, Kistamás K, Horváth B, Bányász T, et al. 9-An-thracene carboxylic acid is more suitable than DIDS for characterization of calcium-activated chloride current during canine ventricular action potential. Naunyn Schmiedeberg’s Arch Pharmacol. 2015;388:87–100. doi: 10.1007/s00210-014-1050-9. http://dx.doi.org/10.1007/s00210-014-1050-9. [DOI] [PubMed] [Google Scholar]
- 32.Qu Z, Xie LH, Olcese R, Karagueuzian HS, Chen PS, Garfinkel A, et al. Early afterdepolarizations in cardiac myocytes: beyond reduced repolarization reserve. Cardiovasc Res. 2013;99:6–15. doi: 10.1093/cvr/cvt104. http://dx.doi.org/10.1093/cvr/cvt104. [DOI] [PMC free article] [PubMed] [Google Scholar]
- 33.Bányász T, Fülöp L, Magyar J, Szentandrássy N, Varró A, Nánási PP. Endocardial versus epicardial differences in L-type calcium current in canine ventricular myocytes studied by action potential voltage clamp. Cardiovasc Res. 2003;58:66–75. doi: 10.1016/s0008-6363(02)00853-2. http://dx.doi.org/10.1016/S0008-6363(02)00853-2. [DOI] [PubMed] [Google Scholar]
- 34.Litovsky SH, Antzelevitch C. Transient outward current prominent in canine ventricular epicardium but not endocardium. Circ Res. 1988;62:116–126. doi: 10.1161/01.res.62.1.116. http://dx.doi.org/10.1161/01.RES.62.1.116. [DOI] [PubMed] [Google Scholar]
- 35.Zygmunt AC, Robitelle DC, Eddlestone GT. Ito1 dictates behavior of ICl(Ca) during early repolarization of canine ventricle. Am J Phys. 1997;273:H1096–H1106. doi: 10.1152/ajpheart.1997.273.3.H1096. [DOI] [PubMed] [Google Scholar]
- 36.Verkerk AO, Tan HL, Ravesloot JH. Ca2+-activated Cl− current reduces transmural electrical heterogeneity within the rabbit left ventricle. Acta Physiol Scand. 2004;180:239–247. doi: 10.1111/j.0001-6772.2003.01252.x. http://dx.doi.org/10.1111/j.0001-6772.2003.01252.x. [DOI] [PubMed] [Google Scholar]
- 37.Bányász T, Horváth B, Virág L, Bárándi L, Szentandrássy N, Harmati G, et al. Reverse rate dependency is an intrinsic property of canine cardiac preparations. Cardiovasc Res. 2009;84:237–244. doi: 10.1093/cvr/cvp213. http://dx.doi.org/10.1093/cvr/cvp213. [DOI] [PubMed] [Google Scholar]
- 38.Bányász T, Bárándi L, Harmati G, Virág L, Szentandrássy N, Márton I, et al. Mechanism of reverse rate-dependent action of cardioactive agents. Curr Med Chem. 2011;18:3597–3606. doi: 10.2174/092986711796642355. http://dx.doi.org/10.2174/092986711796642355. [DOI] [PubMed] [Google Scholar]
- 39.Weissenburger J, Nesterenko VV, Antzelevitch C. Transmural heterogeneity of ventricular repolarization under baseline and long QT conditions in the canine heart in vivo: torsades de pointes develops with halothane but not pentobarbital anesthesia. J Cardiovasc Electrophysiol. 2000;11:290–304. doi: 10.1111/j.1540-8167.2000.tb01798.x. http://dx.doi.org/10.1111/j.1540-8167.2000.tb01798.x. [DOI] [PubMed] [Google Scholar]
- 40.Zygmunt AC. Intracellular calcium activates a chloride current in canine ventricular myocytes. Am J Phys. 1994;267:H1984–H1995. doi: 10.1152/ajpheart.1994.267.5.H1984. [DOI] [PubMed] [Google Scholar]
- 41.Furukawa T, Myerburg RJ, Furukawa N, Bassett AL, Kimura S. Differences in transient outward currents of feline endocardial and epicardial myocytes. Circ Res. 1990;67:1287–1291. doi: 10.1161/01.res.67.5.1287. http://dx.doi.org/10.1161/01.RES.67.5.1287. [DOI] [PubMed] [Google Scholar]
- 42.Fülöp L, Bányász T, Magyar J, Szentandrássy N, Varró A, Nánási PP. Reopening of L-type calcium channels in human ventricular myocytes during applied epicardial action potentials. Acta Physiol Scand. 2004;180:39–47. doi: 10.1046/j.0001-6772.2003.01223.x. http://dx.doi.org/10.1046/j.0001-6772.2003.01223.x. [DOI] [PubMed] [Google Scholar]
- 43.Szabo G, Szentandrassy N, Biro T, Toth BI, Czifra G, Magyar J, et al. Asymmetrical distribution of ion channels in canine and human left-ventricular wall: epicardium versus midmyocardium. Pflugers Arch. 2005;450:307–316. doi: 10.1007/s00424-005-1445-z. http://dx.doi.org/10.1007/s00424-005-1445-z. [DOI] [PubMed] [Google Scholar]
- 44.Baumert M, Porta A, Vos MA, Malik M, Couderc JP, Laguna P, et al. QT interval variability in body surface ECG: measurement, physiological basis, and clinical value: position statement and consensus guidance endorsed by the European Heart Rhythm Association jointly with the ESC Working Group on Cardiac Cellular Electrophysiology. Europace. 2016;18:925–944. doi: 10.1093/europace/euv405. http://dx.doi.org/10.1093/europace/euv405. [DOI] [PMC free article] [PubMed] [Google Scholar]
- 45.Johnson DM, Heijman J, Pollard CE, Valentin JP, Crijns HJ, Abi-Gerges N, et al. IKs restricts excessive beat-to-beat variability of repolarization during beta-adrenergic receptor stimulation. J Mol Cell Cardiol. 2010;48:122–130. doi: 10.1016/j.yjmcc.2009.08.033. http://dx.doi.org/10.1016/j.yjmcc.2009.08.033. [DOI] [PubMed] [Google Scholar]
- 46.Verkerk AO, Veldkamp MW, Bouman LN, van Ginneken AC. Calcium-activated Cl− current contributes to delayed afterdepolarizations in single Purkinje and ventricular myocytes. Circulation. 2000;101:2639–2644. doi: 10.1161/01.cir.101.22.2639. http://dx.doi.org/10.1161/01.CIR.101.22.2639. [DOI] [PubMed] [Google Scholar]
- 47.Sorota S, Siegal MS, Hoffman BF. The isoproterenol-induced chloride current and cardiac resting potential. J Mol Cell Cardiol. 1991;23:1191–1198. doi: 10.1016/0022-2828(91)90207-3. http://dx.doi.org/10.1016/0022-2828(91)90207-3. [DOI] [PubMed] [Google Scholar]
Associated Data
This section collects any data citations, data availability statements, or supplementary materials included in this article.