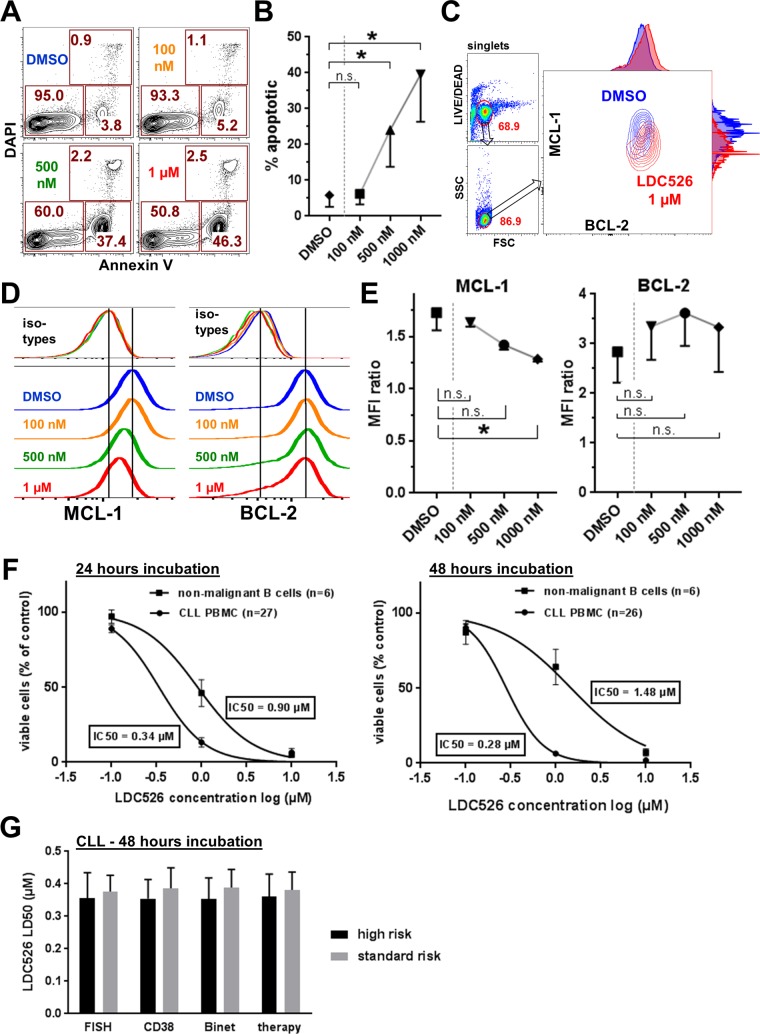
Figure 2. Antileukemic activity of LDC526 on primary CLL cells in vitro.
(A) Induction of apoptosis in primary CLL cells by LDC526. Apoptosis was assessed by Annexin V and DAPI staining after 4 hours of LDC526 incubation. Plots of a representative analysis are shown. (B) Quantification of apoptotic cells (Annexin V+, DAPI-; n=4 CLL patients; 4 hours of incubation). (C) Representative intracellular flow cytometric analysis of MCL-1 and BCL-2 expression within living (LIVE/DEAD dye negative) CLL cells after 4 hours of LDC526 incubation. Overlay plots (DMSO and LDC626 1 μM) with adjunct histograms are displayed. (D) Representative histograms of intracellular MCL-1 and BCL-2 staining (with corresponding isotype controls) of primary CLL cells after 4 hours of LDC526 incubation. (E) Quantification of intracellular MCL-1 and BCL-2 expression (MFI ratio: MFI anti-BCL-2 or anti-MCL-1/MFI corresponding isotype control antibody) after 4 hours of LDC526 incubation (n=3 CLL patients). (F) LDC526 dose-response curves showing the absolute number of viable CLL PBMCs (% of DMSO control) and normal donor B cells determined with absolute cell counts and Annexin V/DAPI flow cytometric analysis. (G) LDC526-induced antileukemic effect within different prognostic CLL subgroups. High-risk: FISH, 11q or 17p deletion (n=10); CD38, proportion of CD38+ cells ≥30% (n=14); Binet, Binet B or C (n=12); therapy, previous therapy (n=10). Low-risk: FISH low-risk, (n=18); proportion of CD38+ cells <30%, (n=14); Binet A (n=16); no therapy (n=18). Characteristics of the CLL patient cohort included in this study are outlined in Table 1. Means±SEM are shown, no statistically significant differences between prognostic CLL subgroups (p>0.05) using Mann-Whitney-U test.

