

Abstract
The budding yeast Saccharomyces cerevisiae can be found in the wild and is also frequently associated with human activities. Despite recent insights into the phylogeny of this species, much is still unknown about how evolutionary processes related to anthropogenic niches have shaped the genomes and phenotypes of S. cerevisiae. To address this question, we performed population-level sequencing of 82 S. cerevisiae strains from wine, flor, rum, dairy products, bakeries, and the natural environment (oak trees). These genomic data enabled us to delineate specific genetic groups corresponding to the different ecological niches and revealed high genome content variation across the groups. Most of these strains, compared with the reference genome, possessed additional genetic elements acquired by introgression or horizontal transfer, several of which were population-specific. In addition, several genomic regions in each population showed evidence of nonneutral evolution, as shown by high differentiation, or of selective sweeps including genes with key functions in these environments (e.g., amino acid transport for wine yeast). Linking genetics to lifestyle differences and metabolite traits has enabled us to elucidate the genetic basis of several niche-specific population traits, such as growth on galactose for cheese strains. These data indicate that yeast has been subjected to various divergent selective pressures depending on its niche, requiring the development of customized genomes for better survival in these environments. These striking genome dynamics associated with local adaptation and domestication reveal the remarkable plasticity of the S. cerevisiae genome, revealing this species to be an amazing complex of specialized populations.
Keywords: Saccharomyces cerevisiae, adaptation, domestication, sweep, horizontal gene transfer
Introduction
Exposure of plants, animals, and microbes to anthropogenic environments has led to variable adaptations that can be categorized as local adaptations (e.g., in the case of fungal crop pests) or as domestication, the ultimate case of adaptive divergence in response to human selection (Ross-Ibarra et al. 2007; Gladieux et al. 2014; Gibbons and Rinker 2015). The yeast Saccharomyces cerevisiae can be found both in natural habitats and frequently in environments affected by human activities. S. cerevisiae can lead a fermentative lifestyle either in high-sugar environments such as grape or sugar cane juice or in environments containing a mixture of glucose and galactose derived from the hydrolysis of lactose in fermented milk. It can also lead a respiratory lifestyle during biological wine ageing. It has developed the capacity to grow in different harsh environments characterized by a combination of stresses, such as osmotic, ethanol, and acidic stress and a wide range of temperatures. Such challenging environments constitute a nonpermissive environment for many other yeasts and bacteria and prompt the question of how adaptation and domestication occurred in S. cerevisiae.
The global phylogeny of S. cerevisiae strains indicates that strains can be grouped not only by their geographical origin but also by their fermentative process (Fay and Benavides 2005; Legras et al. 2007; Liti et al. 2009; Cromie et al. 2013). Parallel phenotypic studies have demonstrated substantial phenotypic variations, some of which correlated with ecological niches or with lineage and population history (Camarasa et al. 2011; Warringer et al. 2011), and the mapping of trait inheritance has revealed that the accumulation of loss-of-function alleles caused by genetic drift is a main driver of trait variation within S. cerevisiae (Zörgö et al. 2012).
However, how the various environmental factors associated with ecological niches might contribute to shaping genotypes and phenotypes remains poorly understood. S. cerevisiae wine yeasts have received increasing attention in recent years, and comparative genomics approaches have provided evidence that these strains have accumulated the hallmarks of domestication (reviewed in Marsit and Dequin 2015). More recently, the importance of introgression and horizontal transfer in the adaptation of yeast to new environments has been shown (Novo et al. 2009; Morales and Dujon 2012; Marsit and Dequin 2015). Remarkably, wine yeast strains have gained large genomic regions (A, B, C) from distant yeast species (Novo et al. 2009; Borneman et al. 2011; Galeote et al. 2011). We found that region C was recently transferred from Torulaspora microellipsoides and contains two duplicated genes encoding oligopeptide transporters, which confer an adaptive advantage during wine fermentation by enabling wine yeasts to better use the nitrogen resources of grape must (Marsit et al. 2015, 2016).
By contrast, little indication of any similar modification of the genome has been found in yeast from other fermentation environments. Until very recently, the limited number of high-quality, complete, and assembled genome sequences has hampered studies on the evolutionary impact of human-associated activities on this species. Moreover, although several studies have addressed the link between genetic and phenotypic variation in S. cerevisiae, most phenomics studies have been conducted using micro cultivation technologies that automatically record growth in various media (Liti et al. 2009; Warringer et al. 2011). Although automated screening in environmental arrays provides highly informative analyses, phenotypes such as fermentation capacity or metabolic profiles can reveal more subtle differences associated with various lifestyles (Nidelet et al. 2016) and may better reflect human-driven selection.
Here, we describe a global analysis of the genomes of 82 S. cerevisiae strains from traditional, human-associated fermentative environments and natural origins. A detailed examination of the population structure and the patterns of genetic variation, as well as the phenotypic differentiation between strains from different ecological niches during fermentation, shows that the ecological specialization associated with human activity is accompanied by the accumulation of a large variety of specific, potentially adaptive genomic changes. We show that copy number variation (CNV), introgression/horizontal gene transfer (HGT), and natural selection are general mechanisms associated with ecological specialization. Finally, high phenotypic diversity was found under fermentative growth conditions, enabling the identification of specific genotype–phenotype links related to the ecological niche.
Results
Origin of Yeast Populations Associated with Human-Related Groups
To examine the evolutionary history of S. cerevisiae populations isolated from various fermented products, including wine, beer and bread, cheese, sake, and West African beverages, as well as populations from natural resources (oaks), we first inferred the maximum-likelihood genome genealogy of 159 strains. Figure 1 presents the main lineages, showing the groups of wine, North American oak (NA oak), sake, and West African (W African) strains (Liti et al. 2009) as well as the recently described flor, beer and bread and Mediterranean oak (Med oak) cluster (Almeida et al. 2015; Gallone et al. 2016; Coi et al. 2017), and also reveals a new cluster that corresponds to cheese isolates. Rum and bioethanol strains are distributed into two clusters in the tree. In addition, a few atypical strains were found from several origins: strain YA3, isolated in Sicily from sourdough, and strain NRRL1791, isolated from a Trappist cheese, both of which are related to sake strains, as well as CLIB219, isolated from Vitis amurensis in eastern Russia, and Lava38_1, isolated at Acores from grapes in an abandoned vineyard, both of which are closely related to UWOPS87_2421. Interestingly, the cheese cluster includes strains isolated in France, Morocco, Russia, and Kazakhstan, attesting to a wide geographic expansion similar to that previously observed for wine strains. The cluster containing beer and bread strains corresponded to the recently described beer clusters 1 and 2 (Gallone et al. 2016).
Fig. 1.

(A) Whole-genome genealogy inferred for 159 Saccharomyces cerevisiae strains. The tree was inferred from 313,973 SNPs using the maximum-likelihood method as implemented in RAxML with the GTRGAMMA model of sequence evolution. The tree was rooted according to the midpoint method. Support values from bootstrap replicates >90% are indicated with red dots. Main lineages or populations are indicated with colored ellipses. (B) Population structure inferred with admixture from the same data set for a different number of ancestral clusters (2–11). The best partition was obtained for K = 11 ancestral clusters. (C) Population structure obtained with Fine Structure after data phasing. Med. Oak: Mediterranean Oak
Population Structure (Admixture) and Evolutionary History
We used a combination of model-based analyses of population structure to investigate more subtle differentiations between various lineages. The analysis of population structure using the model-based clustering algorithm implemented in the Admixture software (Alexander et al. 2009) suggested an optimal clustering at K = 11 groups (fig. 1B), which delineates the five clean lineages proposed by Liti et al. (2009), namely, sake, NA oak, W African, Malaysian Bertram palm, and wine, as well as additional clusters for flor, cheese, rum and bioethanol, beer and bread, and clinical strains. Laboratory, beer and bread, rum and bioethanol, and clinical isolates were proposed to present mosaic ancestries with a lower value of K, but they were poorly resolved. The mixed ancestry of these groups was confirmed by analyses of shared haplotype segments implemented in the FINESTRUCTURE program (Lawson et al. 2012). This analysis produced a similar picture but outlined 13 groups (represented as squares in fig. 1C) and differentiated the Med oak population from the mosaic populations of rum, bread, and laboratory strains. This final analysis enabled us to define typical genotypic populations for wine, flor, cheese, rum and bioethanol, Med oak and NA oak, which we then studied further (supplementary table S1, Supplementary Material online).
For mosaic genomes, the mixing of different segments corresponding to the ancestral genomes during meiosis depends on the recombination rate. Simulating the decay of linkage disequilibrium between shared haplotypes within a group with Globetrotter (Hellenthal et al. 2014) enabled us to infer that the Brazilian rum population originated from an initial crossing event between a wine and an NA oak population in almost equal proportions (44% NA oak/56% wine) approximately 12 meiotic generations ago. Assuming eight or one generations per day (Fay and Benavides 2005; Liti et al. 2006), and a mitosis/meiosis rate as estimated later (see after paragraph 3), this cross event could be dated between 114 and 913 years ago. With the same assumptions, the nucleotide divergence between the wine and Med oak strains dated the split between these two populations to between 909 and 7,273 years ago, which is consistent with the estimation of Almeida (Almeida et al. 2015); meanwhile, the divergence between the cheese and Med oak strains indicates a split sometime between 1,457 and 11,654 years ago. This result suggests that the origin of rum strains is compatible with the recent import of wine strains to America after the voyage of Christopher Columbus to America in 1492.
Life Cycle in Each Population
Because S. cerevisiae is mainly a clonal fungus with infrequent mating (Ruderfer et al. 2006) and because noticeable differences in outcrossing rates have been found for “domesticated” and natural populations (Magwene et al. 2011), we compared the patterns of linkage disequilibrium to gain insight into the contributions of recombination to the wine, flor, cheese, rum, bakery, and oak populations. In all populations, linkage disequilibrium decreased rapidly with distance, indicating that the amount of recombination conferred by sexual reproduction is sufficient to break linkage disequilibrium. However, a slower decay in linkage disequilibrium rates with distance was observed for NA oak and Med oak than for human-related environment populations (supplementary fig. S1, Supplementary Material online). The linkage reached half of its maximum value at 2.1, 2.9, 2.5, 5.5, and 97 kb in wine, flor, rum, Med oak, and NA oak, respectively.
Consistent with this observation, the two populations of natural isolates presented the lowest global outcrossing rates (7.6×10⁻⁶ and 5.5×10⁻⁷ for Med oak and NA oak), whereas the Med oak population displayed the lowest mitosis/meiosis ratio (table 1). By contrast, all populations associated with anthropogenic activities displayed a higher outcrossing rate, with wine strains presenting the highest global outcrossing rate, which was consistent with previous results (Magwene et al. 2011).
Table 1.
Main Population Parameters Obtained for Each Population.
| Origin | LD Decay (kb) | Fis | Outcrossing Rate (per meiosis) | π kb−1 | θω kb−1 | Mitosis/Meiosis Ratio | Global Outcrossing Rate (per cell division) |
|---|---|---|---|---|---|---|---|
| NA oak | 97.0 | 0.995 | 0.003 | 3.1 | 2.5 | 4.7×10³ | 5.5×10⁻⁷ |
| Med oak | 5.5 | 0.987 | 0.007 | 1.0 | 1.0 | 8.6×10² | 7.6×10⁻⁶ |
| Cheese | 2.8 | 0.630 | 0.227 | 3.0 | 2.5 | 6.0×10³ | 3.8×10⁻⁵ |
| Rum | 2.9 | 0.519 | 0.317 | 3.8 | 3.7 | 2.8×10⁴ | 1.1×10⁻⁵ |
| Flor | 1.0 | 0.729 | 0.157 | 0.4 | 0.4 | 3.2×10³ | 4.9×10⁻⁵ |
| Wine | 2.2 | 0.781 | 0.123 | 1.0 | 1.4 | 2.3×10³ | 5.5×10⁻⁵ |
Note.—Nucleotide diversities (Dxy) were obtained from intergenic regions with the PopGenome package for each chromosome. Population scale recombination rates w were inferred with the FastEPRR package (Gao et al. 2016). The mitosis/meiosis ratio is the mean of the ratios obtained for each of the 16 chromosomes. Fis was estimated based on nonsporulating strains only.
Copy Number Variation
Copy number variation (CNV) is a mechanism known to drive adaptation to environmental changes (Dunham et al. 2002; Kondrashov 2012). A genome scan for CNVs in our set of strains (supplementary table S2, Supplementary Material online) revealed aneuploidy in a few isolates: L328 (three copies of chromosome 11), CBS7957 (three copies of chromosome 3), CBS7959 (four copies of chromosome 1), VPDN_fino (three copies of chromosomes 2, 10, 12), M15-3B (three copies of chromosome 11), and L719 (three copies of chromosome 3). An analysis of local variations revealed 542 segments of 1 kb with significant and noticeable differences between populations (wine, flor, cheese, rum, bakery, NA oak, Med oak, sake, and W African). We observed the amplification of CUP1, YKL222C, and MCH2, as previously reported in wine and flor strains (Legras et al. 2014; Strope et al. 2015), and the CUP1 region was also amplified for rum strains but underrepresented in other populations. Other amplified genes included IMA1, IMA2, MAL11, MAL12, MAL13, and SUC2 (involved in diholoside hydrolysis) in bread strains, ADH7 in wine strains, and DLD3 in cheese strains. The different populations also varied in the number of missing segments (ANOVA on log-transformed data P value: 1.5×10⁻¹³). The cheese population exhibited significantly more missing segments than any other population except the flor population (Tukey’s test: adj. P values <0.02), while the flor population also had more missing segments than the NA oak, Med Oak, sake, and wine populations (Tukey tests: adj. P values <0.001). The segments missing from the cheese population genome are enriched in genes involved in galactose catabolism (adj. P value: 0.0006): GAL1, GAL7, and GAL10 appear to be missing, as well as GAL2, HXT1, and HXT4, which encode hexose transporters (supplementary fig. S2, Supplementary Material online). Closer examination of these genes revealed a fusion between HXT3 and HXT7 (HXT3–HXT7) for six of seven cheese strains and between HXT1 and HXT4 (HXT1–HXT4) for four cheese strains. The apparent loss of GAL2 resulted from a high nucleotide divergence with S288C (absolute divergence Dxy= 0.074 per bp, supplementary fig. S3, Supplementary Material online). This gene was also found to be duplicated in two cheese strains (TL229 and NRRLY1545).
Variations in Gene Repertoire
As several horizontal gene transfer (HGT) or introgression events have been previously reported in S. cerevisiae (Liti et al. 2006; Borneman et al. 2008; Muller and McCusker 2009; Novo et al. 2009; Dunn et al. 2012; Strope et al. 2015), enlarging the yeast gene repertoire, we examined the 82 newly available genome sequences for such events. We searched for HGT, which we defined as gene flow between different species through asexual mechanisms, and for introgressions, that is, the transfer of DNA between Saccharomyces species via mating and backcrossing.
In this way, we identified 36 putative transfer events, almost all of them from eukaryotic origins. Some of these regions were previously identified in the genome of S. cerevisiae strains EC1118, AWRI796, YJM789, Kyokai7, and RM11 (supplementary table S3, Supplementary Material online). Among these regions, three (C, J, and SAPA_F) have undergone rearrangements, as shown by the presence of different subregions in various strains. This observation led us to propose a new nomenclature for these different subregions, resulting in a total of 42 regions (supplementary table S3, Supplementary Material online). These 42 regions ranged in length from 1.5 to 42 kb and were predicted to contain 155 hypothetical open reading frames (ORFs) encoding proteins longer than 145 aa and 6 transposons. While the origins of some regions (B, C) have already been found (Novo et al. 2009; Marsit et al. 2015), we evaluated the likelihood of HGT events by performing phylogenetic tests on the ORFs from the 26 remaining regions (A, D to AA). These tests indicated that 12 of these regions do not originate from within the Saccharomyces genus (supplementary table S3, Supplementary Material online), supporting an HGT event from a non-Saccharomyces species. Our results also suggest that 13 regions are potentially introgression events from other Saccharomyces species. It was not possible to classify 1 region (K), and for the last one, the most likely origin was S. cerevisiae. We identified homologues in other species, and their classification according to the MIPS (Munich Information Center for Protein Sequences) functional catalogue showed that they are mainly involved in carbon, nitrogen, and lipid metabolism stress response, and detoxification (supplementary fig. S4 and table S3, Supplementary Material online). Figure 2A, which represents the repartition of the available S. cerevisiae genome sequences (160 strains) among these 42 new regions, reveals that some regions are overrepresented in a particular niche, while other regions are present in a nonspecific way. An independence test indicated that 28 show a significant link with a given origin after correction for multiple testing (Benjamini and Hochberg 1995). These regions are highlighted in figure 2B.
Fig. 2.

(A) Repartition of the different new regions among available genomes. (B) Graphical representation of the origin specificity of selected chromosomal regions. For each chromosomal region statistically linked to a specific set of origins, we created an individual pie graph where the percentage of different origins is represented as a colored slice. The slices representing the most frequent origin are slightly separated from the others. Region’s pies are ordered based on the function of the most abundant origin.
Genes with potential functions that are relevant for ecological specialization (supplementary table S3, Supplementary Material online) were found in several of these 28 regions, among which 6 were specific to one or two pure lineages (regions T, X, A, B, C3, C4). One of the most remarkable features was Region T, which was identified only in the genomes of seven cheese strains, as it carries GAL orthologues from a species apparently basal to the Saccharomyces species complex. These orthologues are most similar to alleles of S. eubayanus, S. uvarum, S. kudriavzevii, and S. arboricola (supplementary table S3 and S4, and figs. S4 and S5, Supplementary Material online), and they replaced the S. cerevisiae GAL gene cluster (GAL7-GAL10-GAL1) by recombination at the level of the adjacent genes KAP104 and FUR4 (supplementary fig. S6, Supplementary Material online).
Regions A, B, C3, and C4 were widespread in the wine and flor strains. Regions A, C3, and C4 are specifically present in flor and wine, whereas region B was also found in mosaic groups such as rum, bread, and laboratory strains and in a few strains from NA oak lineages (2 out of 12 strains). In addition, regions A (P value 0.02) and C4 (P value 0) were more frequently found in flor strains, whereas regions C3 (P value 0.003) and B (P value 0.01) were more prevalent in wine strains. This result is consistent with our recent findings showing that FOT genes, carried by region C3, confer a strong competitive advantage during wine fermentation (Marsit et al. 2015, 2016), and FSY1 (region C4) encodes a high-affinity fructose/H+ symporter that is potentially advantageous in the flor/velum ageing process (Coi et al. 2017).
On the other hand, some of these 28 selected regions were found in several lineages with greater prevalence in one or two lineages. Two regions SAPA_F2 and SABA_A were enriched in the bread and beer strains (P values of 0.02 and 0.001, respectively). The first potentially encodes an isomaltase and a sugar transporter that could be of particular interest during baking and brewing processes. The second region contains RTM1, a gene previously found in ale strains (Ness and Aigle 1995; Borneman et al. 2011) and in the clinical isolate YJM789 (Wei et al. 2007).
In addition to the discovery of potential new functions, the distribution of region C helped to illuminate the mechanisms involved in the transfer of this region. A fragment of at least 158 kb was initially shown to be transferred from T. microellipsoides to S. cerevisiae (Marsit et al. 2015), and several rearrangements followed by gene losses have led to a complex state with strains that have retained the four subregions C1 to C4 described earlier. We discovered a new fragment in the AWRI1631 and M2ONO800 strains, called C5, that shares 99.9% identity with a region located in the same chromosome of T. microellipsoides as C1-4 (975-kb upstream the C1 subregion), suggesting a very broad unidirectional transfer event of the whole T. microellipsoides chromosome. This large transfer raises the question of the mechanism involved in this event. Indeed, HGT suggests a mechanism similar to transformation, but the potential size of this introgression indicates that it may have occurred, as suggested by Morales and Dujon (2012), during a transient heterokaryotic phase in an aborted hybrid between T. microellipsoides and S. cerevisiae.
Genetic Variation and Impacted Genes
Former population genomics studies evaluating yeast diversity have noted the role of genetic drift, which leads to the accumulation of slightly deleterious mutations and shapes the phenotypic properties of yeast populations (Warringer et al. 2011; Zörgö et al. 2012). As a first step, we looked for the presence of stop codons or frameshifts in each strain that might lead to protein inactivation. The differences in the mean number of these alleles in each population were highly significant (ANOVA P value = 1×10⁻¹⁵). Cheese strains showed the highest content of such potentially inactivated alleles, higher than in all other populations except W African strains. In contrast, the wine, rum, Med oak, and flor strains presented the lowest content of such mutations. In addition, because population structure analyses do not account for the synonymy of SNPs, we focused our analysis on SNPs for which we could predict an impact on protein function using the Sorting Intolerant from Tolerant program approach (Ng and Henikoff 2001). We thus identified 18,123 nonsynonymous SNPs with potential functional impacts. The first axis of a principal component analysis performed on this subset of SNPs differentiated flor and wine strains from sake and W African strains, whereas the second and third axes differentiated flor from wine and cheese from other populations, respectively (fig. 3). This analysis provided a list of potentially impacted genes, differentiating the flor and cheese populations from the rest (supplementary table S5, Supplementary Material online). The list of impacted genes differentiating flor and wine populations was enriched in the GO SLIM functional categories of transmembrane transport (adj. P value = 0.0014) and protein phosphorylation (adj. P value = 0.0012), whereas the list of impacted genes differentiating cheese strains from others was enriched in the plasma membrane (adj. P value = 0.00014) and cellular bud (adj. P value = 0.0043) GO SLIM component categories. The GAL4 and GAL80 alleles, which regulate the expression of the GAL regulon, were carrying specific mutations with potential impact in cheese strains. GAL4 is one of the most impacted genes, but none of the nonsynonymous mutations are located in a known functional domain of the protein. In contrast, several mutations such as T146L, S387L, or D395N may impact Gal80p function.
Fig. 3.

PCA performed on the set of variants with potential impact according to SIFT.
Genomic Diversity and Patterns of Adaptation
Adaptation to a specific niche is often accompanied by the exceptional differentiation of specific regions in the genome of the adapted population. We therefore applied hapFLK statistics with the aim of detecting high differentiation when comparing several populations, which has been shown to be one of the most robust tests for detecting selection (Vatsiou et al. 2016). Seven extremely differentiated genomic regions were revealed by hapFLK when comparing wine, rum, and Med oak strains or comparing wine, rum, cheese, and Med oak strains (supplementary table S6, Supplementary Material online). Remarkably, these regions contained genes with well-known relevant functions for alcoholic fermentation, such as AUS1, one of the two sterol uptake transporters in Saccharomyces cerevisiae.
The invasion of advantageous mutations in each population also leaves specific genomic signatures called selective sweeps (Vitti et al. 2013). Methods designed for the detection of selective sweeps were applied to the wine, rum, and bioethanol, cheese and Med oak populations. As a demographic scenario has been inferred for the wine and Med oak strains (Almeida et al. 2015), the different statistical outputs were compared with those from neutral simulations, while for the cheese and rum strains, only the 1/1,000 highest values were kept (fig. 4). Apart from Tajima’s D statistics, which are blurred by population expansion (as seen in the wine strains), these tests revealed that selection has potentially acted on 32–42 genomic regions per population, leading to selective sweeps (supplementary table S7, Supplementary Material online). For wine strains, the regions containing IRA2 and ATG19 and the two amino acid transporters, AVT3 and BAP2 were detected by iHS or omega statistics. For cheese strains, a selective sweep was inferred from the SVDN statistics on FUR4, the gene adjacent to the GAL cluster of region T, and on SIC1, which is near the surprisingly divergent high-affinity galactose transporter GAL2.
Fig. 4.

Manhattan plot presenting the output of different statistics for sweep detection. Points above the threshold (dotted circles) are shown in red. (A) Output of Tajima’s D, Fay and Wu H, SVD, iHS, omega for the wine strain population. (B) Output of Tajima’s D, Fay and Wu H, SVD, iHS statistics for the cheese strain population.
Life-History Trait Variation
We also characterized a subset of 58 wild and anthropogenic S. cerevisiae strains under wine fermentation conditions to assess the relationships between origin and quantitative phenotypic traits. The description of each strain consisted of growth features (dry weight and population size) and metabolic variables (glycerol, acetate, succinate, and volatile organoleptic compounds), as well as attributes associated with fermentation performance. Generally, the strains exhibited large differences, between 2- and 20-fold, in all characteristics, which was consistent with the variability previously reported within S. cerevisiae species (Camarasa et al. 2011). Interestingly, several measured variables allowed the differentiation of strains based on their origin. This phenomenon was further investigated by first applying the Kaplan–Meier estimator approach to variables describing the ability of strains to efficiently achieve wine fermentation, namely, the fermentation time combined with the final amount of released CO2 (fig. 5). This log-rank test-based method for the analysis of censored data, which is currently used to estimate the survival function from lifetime data (Goel et al. 2010), revealed significant differences between the oak, cheese, rum, flor, bread, and wine populations (P < 0.0005). Depending on their origin, strains were able to ferment all the provided sugars at different rates or were unable to ferment the sugars. The highest efficiency was observed for wine strains, whereas none of the strains originating from cheese were able to complete the fermentation. Overall, sPLS-DA allowed us to summarize the phenotypic variability within the entire population and to identify origin-specific traits (supplementary fig. S7, Supplementary Material online). The flor population that develops on wines after alcoholic fermentation exhibited a higher capacity to consume fructose (resulting in a higher glucose/fructose ratio). Low acetate production characterized the wine and bread strains. Finally, yeasts from bread exhibited a higher production of succinate than the rest of the population, whereas cheese isolates were characterized by the substantial formation of butyric acid. Except for this acid, and in contrast to metabolites from the central carbon metabolism, the formation of volatile compounds did not distinguish the strains according to their origin.
Fig. 5.
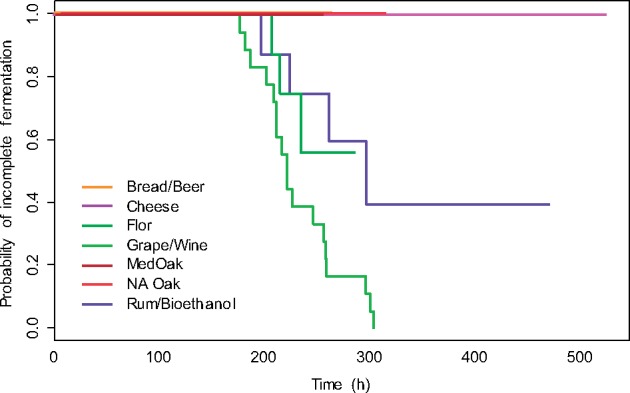
Plots of the Kaplan–Meier product limit estimates of the efficiency of strains from a defined origin to achieve wine fermentation. The curves show the evolution over time of the probability of incomplete fermentation.
In a parallel set of experiments, we tested the 58 strains for their ability to grow on galactose as a carbon source. Under these conditions, cheese strains exhibited both a reduced lag phase and a higher growth rate compared with all the strains from other origins (fig. 6A) but reached a lower final cell population. Consistent with this observation, the mean maximal specific growth rates measured for cheese strains were significantly higher than those obtained for all the other genetic groups (global significance P value <6.7×10⁻⁶ for pairwise differences, Tukey test P value <0.04 for all populations) (fig. 6B). Interestingly, the growth rate and biomass accumulation of S. cerevisiae cheese strains on galactose medium were similar to those of S. uvarum CBS7001 in comparison to S. cerevisiae By4743 (Kuang et al. 2016; Roop et al. 2016).
Fig. 6.

Growth on galactose as a carbon source for strains from different populations (A) Growth kinetics of all strains: cheese strains are indicated in pink and strains of other origins in blue. (B) Mean specific growth rate per population. The global significance of the differences between groups was evaluated by an ANOVA P value <6.7×10⁻⁶, and pairwise differences were assessed by the Tukey test: Cheese—Med oak <0.04 and Cheese—other groups <0.01. Differences between groups other than cheese were not significant.
Linking Genotype to Phenotype
Finally, to obtain a comprehensive overview of the relationships between the phenotypes and the genetic backgrounds of strains (52), we conducted a multivariate factorial analysis (MFA) using CNVs, phenotypes, metabolic fluxes, and transfer region data sets.
This analysis first showed a clear differentiation of cheese strains, separating them from other individuals in the first dimension (supplementary fig. S8, Supplementary Material online). This separation was based on several phenotypic differences (production of glycerol, butyrate, and α-ketoglutarate, fermentation rates, ability to complete wine fermentation, formation of biomass, and fermentation length), combined with the presence of specific regions (T, X, Z) and CNVs in cheese strains. An enrichment analysis of the 135 over- or underrepresented genes contributing to the first axis (table 2) showed significant enrichment in functional categories related to carbohydrate transport, thiamine biosynthesis, and galactose metabolism. Thiamine is an essential cofactor for pyruvate decarboxylase, which in turn plays a major role in the conversion of pyruvate into ethanol. The rearrangements between hexose transporters HXT1–4 and HXT3–7 and the underrepresentation of genes in the thiamine biosynthesis pathway likely result in a reduced ability of these strains to consume sugars and may explain, at least in part, their limited ability to complete wine fermentation.
Table 2.
Overrepresented Functional Categories Associated with the CNVs of Features Significantly Correlated with Axis 1, Which Differentiates Cheese Strains from Other Strains.
| Genes (out of 135) | Adj. P Value | GO | Annotations | Gene Names |
|---|---|---|---|---|
| Biological processes | ||||
| 12 | 1.2×10⁻⁷ | GO: 0008643 | Carbohydrate transport | HXT1, HXT3, HXT4, HXT6, HXT7, HXT9, HXT11, HXT12, HXT13, YIL171W, GAL2, AQY3 |
| 9 | 4.0×10⁻⁷ | GO: 0035428 | Hexose transmembrane transport | HXT3, HXT4, HXT6, HXT7, HXT9, HXT11, HXT12, HXT13, YIL171W |
| 9 | 6.5×10⁻⁷ | GO: 0046323 | Glucose import | HXT1, HXT3, HXT4, HXT6, HXT7, HXT9, HXT11, HXT13, GAL2 |
| 6 | 1.5×10⁻⁵ | GO: 0009228 | Thiamine biosynthetic process | THI5, THI11, THI12, THI13, THI22, SNO2 |
| 4 | 1.7×10⁻⁶ | GO: 0007532 | Regulation of mating-type specific transcription, DNA-templated | HMLALPHA1, HMLALPHA2, MATALPHA1, MATALPHA2 |
| 5 | 3.0×10⁻⁴ | GO: 0006012 | Galactose metabolic process | GAL1, GAL2, GAL7, GAL10, PGM1 |
| 4 | 2.6×10⁻⁴ | GO: 0015757 | Galactose transport | HXT1, HXT9, GAL2, HXT11 |
| 3 | 5.8×10⁻³ | GO: 0033499 | Galactose catabolic processing via UDP-galactose | GAL1, GAL7, GAL10 |
| 4 | 9.2×10⁻⁴ | GO: 0000128 | Flocculation | FLO5, FLO9, FLO11, FLO11 |
| Pathways | ||||
| 4 | 1.1×10⁻⁴ | Galactose degradation | GAL1, GAL7, GAL10, PGM1 | |
| 4 | 2.7×10⁻³ | Thiamine biosynthesis | THI5, THI11, THI12, THI13 | |
Note.—Obtained from the YeastMine website (http://yeastmine.yeastgenome.org/yeastmine). The significance threshold for correlation with axis 1 after correction for multiple testing according to Benjamini and Hochberg (1995) was set to 0.001.
For cheese strains, this analysis also highlights the divergent alleles of GAL2 and the replacement of GAL1, 7, and 10 by the GAL cluster of region T, whose sequence is more similar to the corresponding regions in S. uvarum and S. eubayanus than those in S. cerevisiae strains not derived from cheese. Our observations suggest that this GAL cluster provides cheese strains with the ability to assimilate galactose faster than other S. cerevisiae strains.
Furthermore, the bidimensional mapping of the strains according to axis 2 and axis 3 allowed the differentiation of the bread and beer, flor, and oak classes of strains. Strains from bread and beer were distinguished mainly by their low production of acetate, their better ability to complete wine fermentation and their high production of methionol compared with strains from the two other groups. The genes SAM3 and SAM4, which encode a S-adenosylmethionine (AdoMet) transporter and an AdoMet-homocysteine methyltransferase, along with Mht1p, which is involved in the conversion of (AdoMet) to methionine to control the methionine/AdoMet ratio, were overrepresented in strains from the bread and beer group. This higher SAM3 and SAM4 dosage in bread/beer strains likely increases the level of intracellular methionine and its further conversion into methionol via the Ehrlich pathway. Finally, the distinction between oak and flor strains observed in the ability of flor strains to consume fructose could be related to the presence in flor strains of the region C4, which carries FSY1, but is very likely caused by the presence of a specific fructophilic allele of HXT3 in flor strains (Guillaume et al. 2007; Galeote et al. 2010; Coi et al. 2017).
Discussion
These genomic data represent a useful resource for understanding the adaptation of yeast to man-made environments and for elucidating the foundations of its technological properties. We show here an improved phylogenetic picture of the diversity of strains isolated from various technological origins. Our data show clustering associated with the various ecological niches, as previously reported from microsatellite (Legras et al. 2007) and genomic data (Liti et al. 2009; Cromie et al. 2013; Gallone et al. 2016). We also recently showed that flor strains originate from wine strains (Coi et al. 2017). In addition, we show here that cheese strains were very likely derived from the natural Med oak population at a similar period to that of wine strains, whereas rum strains have a recent admixture history. Cheese strains present interesting features: they are clearly related to Med oak strains, despite also being well differentiated, and they have been widely dispersed across Europe, from Kazakhstan to France and Morocco, indicating a dispersal history comparable to that described for wine.
Domestication, Adaptation, Mating, and Outcrossing
As mating has been shown to accelerate adaptation in experimental populations (Goddard et al. 2005), we estimated the mitosis/meiosis ratio and the outcrossing rate in populations obtained from natural and man-made environments. Populations isolated from man-made environments did not show a lower mitosis/meiosis ratio than the population isolated from Mediterranean oak, but they did show higher outcrossing rates than the natural populations, suggesting high outcrossing as a possible trait for domestication (Magwene et al. 2011). In comparison to selfing, outcrossing favors adaptation in comparison in coevolution experiments (Morran et al. 2011). Two hypotheses can be suggested to explain these higher outcrossing rates: selection for outcrossing or ecological modification that favors outcrossing. Populations from man-made environments attain much higher cell densities than those found in association with oak trees (Kowallik et al. 2015). Such dense populations are expected to initiate the sexual cycle when nutrients become scarce, resulting in mass mating, which is known to favor outcrossing (Murphy and Zeyl 2010).
Domestication and Accumulation of Mutations in Man-Made Environments
Domesticated populations often suffer from the accumulation of deleterious mutations, which may originate from inbreeding, population history and selection relaxation in the new man-made environment (Renaut and Rieseberg 2015; Freedman et al. 2016). This phenomenon has recently been reported for beer strains (Gallone et al. 2016). The highest numbers of genes with stop codons and frameshifts were found in the genomes of the cheese population and the W African population, including strains isolated from local beverages, which is consistent with the high rate of deleterious mutations of the W African population (Warringer et al. 2011) and suggests that both populations might be domesticated or faced a strong initial bottleneck. Meanwhile, unexpectedly, the wine strains contained the lowest mean number of genes with frameshifts. In addition, extreme specialization to a constant environment, as observed in pathogens, is accompanied by a reduction in genome size (Moran 2002). Such a phenomenon can be seen for the cheese and flor populations, which have the highest numbers of apparently missing regions.
Selection of Specific Genomic Make-up for Better Fitness in Man-Made Environments
Our results show that a specific genomic make-up corresponds to the different genotypic populations. We could detect, in each population, deleted and amplified genes or genes specifically introgressed from closely related species or transferred from more distant species, resulting in increased phenotypic diversity in these strains.
The correlation between the genetic make-up of the strains from the various groups and their physiological properties is illustrated in the AFM combining CNV, gene transfer with phenotypes related to must fermentation and gene transfer involved in the unique galactose metabolism of cheese strains. In the wine fermentation environment, we could detect traits specific to each group: flor strains were characterized by a higher capacity to metabolize fructose than the other groups and to produce acetic acid, and wine strains were characterized by a greater capacity to ferment sugar, whereas cheese strains produced more glycerol and butyric acid, which is the most potent odorant in Camembert and cheddar cheese (Yvon and Rijnen 2001).
One remarkable feature is the ability of cheese strains to grow quickly on galactose, which could be associated with the replacement of the GAL7-GAL10-GAL1 cluster. Lactose is the main carbohydrate compound present in milk, and no growth was observed on lactose for any S. cerevisiae strains in this study (data not shown), which is consistent with the absence of β-galactosidase in the S. cerevisiae species. In a recent meta-transcriptome analysis of cheese fermentation microflora, genes encoding the β-galactosidase of Kluyveromyces lactis and the 6P-β-galactosidase of Lactobacillus lactis, which are involved in the hydrolysis of lactose, were shown to be highly expressed in the early phase of cheese ripening (Dugat-Bony et al. 2015). Thus, we hypothesized that galactose produced by L. lactis or K. lactis (or other members of cheese microbiota) might be used by S. cerevisiae cheese strains, indicating a possible cross-feeding interaction between the different community members in a cheese-making environment.
Does Drift or Selection Explain the Phenotypic Properties of Yeast Populations?
In addition to the action of drift, we show here that selection also contributed to shaping the phenotypes of yeast populations. In the cheese population, the replacement of GAL7-GAL10-GAL1, which is also accompanied by a highly divergent high affinity transporter GAL2 and by the presence of specific alleles of GAL4 and GAL80, has very likely permitted a change in the ability to grow on galactose released from the hydrolysis of lactose. The detection of a sweep signal in the FUR4 and SIC1 regions confirms that this phenotypic specialization of cheese strains for galactose consumption has been selected for. The lipid and nitrogen contents of grape must are well known by technologists to create constraints on yeast growth. The region containing the sterol transporter AUS1 is one of five regions specifically differentiated in wine yeast. In addition, we have shown formerly that the transfer of region C has permitted an enhanced utilization of the nitrogen content in grape must (Marsit et al. 2015). In this study, we observed two regions containing amino acid transport (BAP2 and AVT3) that exhibited signatures of selective sweeps, whereas the differences between wine strains and other yeast populations has recently been related to their ability to uptake amino acids from the grape must, with BAP2 as one of the candidates (Brice et al. 2018), and to their more efficient management of vacuolar nitrogen (Crépin et al. 2012). However, signatures of selection are not necessarily characteristic of an anthropic environment, as we detected the introgression of an S. paradoxus allele of FZF1 involved in the regulation of sulphite export (Almeida et al. 2017). These results are consistent with the exploration of other fungal species such as anther smut pathogens and the domesticated fungus Aspergillus orizae, in which numerous sweeps have been detected (Gibbons et al. 2012; Badouin et al. 2017).
In conclusion, the cheese population exemplifies adaptive divergence in comparison to the other groups, with new specific phenotypes gained by different mechanisms including HGT, mutation accumulation, selection, and the accumulation of genes that might be inactivated or lost. The cheese population also represents a clear example of domestication, even if the role of S. cerevisiae under milk fermentation is not known. The situation is very similar for the flor population, which has also gained functions via HGT, mutation accumulation and selection (Coi et al. 2017) and presents a high number of missing genes but far fewer genes that might be inactivated by frameshift and stop codons. In contrast, the specialization of wine strains to their environment, involved HGT (Marsit et al. 2015), mutation accumulation and selection but is not accompanied by the accumulation of deleterious mutations nor the loss of genes such as in cheese strains, which suggests either less relaxation of the selective constraints or a lower genetic isolation from other groups.
Recently, Goddard and Greig (2015) presented S. cerevisiae as a nomad with no natural niche. Our results highlight the remarkable plasticity of the S. cerevisiae genome, which has a unique ability to adapt quickly to many ecological niches, such as those produced by humans. This ability complements the “generalist proposal” view of Goddard and Greig and suggests that, due to its remarkable plasticity, S. cerevisiae represents an amazing complex of specialized populations.
Materials and Methods
Genome Sequencing and Processing
Genome sequences from SGD were obtained for 77 genomes in December 2012 (Wei et al. 2007; Argueso et al. 2009; Liti et al. 2009; Akao et al. 2011; Borneman et al. 2011; Engel and Cherry 2013), and 82 were recently sequenced in our laboratory (Mendes et al. 2013; Marsit et al. 2015). The theoretical sequencing coverage was between 15 and 760× (the median was 136×). Complete data sets were deposited in the European Nucleotide Archive (ENA) under study accession numbers PRJEB6529, PRJEB7675, and PRJEB8455. Other sequencing data were obtained for six Mediterranean oak yeast genomes in ENA study PRJEB7601 (Almeida et al. 2015). For each library, low-quality reads were processed and filtered using the FASTX Toolkit v0.0.13.2 and TRIMMOMATIC v0.30 (Bolger et al. 2014) with a quality threshold of 20.
Assemblies
The processed reads were assembled using VELVET v. 1.2.07 (PRJEB7675 and PRJEB8455) with the help of VelvetOptimizer.pl version 2.2.5 (Gladman and Seeman 2012). Assembly preparation was optimized for the highest value of the N50 scaffold. Gaps were closed using the GapCloser module v 1.10 of the SOAPdenovo package.
Reference-Based Alignment and Variant Calling
We used Genome Analysis Toolkit (GATK) v2.7 for SNP and indel calls (McKenna et al. 2010), following “Best Practice Variant Detection with GATK version 4, for release 2.0,” available online. First, reads were aligned to the S288C reference genome (release R64-1-1) using BWA version 0.6.2 (Li and Durbin 2009). PCR duplicates were then removed using MarkDuplicate from Picard Tools version 1.84 (http://picard.sourceforge.net), and the reads around indels were realigned using IndelRealigner (GATK). The base qualities were recalibrated using BaseRecalibrator/PrintReads (GATK). SNP and indel discovery was performed using UnifiedGenotyper (GATK), and the variant quality score was recalibrated using the VariantRecalibrator tools of GATK, calibrated on a data set of known SNPs and indels obtained from 86 available genomes to train the model. This genotyping pipeline provided a final multisample VCF file containing 502,296 SNPs and 32,173 indels discovered across samples, with which a genotyping quality for each strain was associated.
Phylogeny and Population Structure
For the 77 genomes extracted from databases, repeats (Ty, LTR) were masked using RepeatMasker version open-4.0.0, and the genomes were aligned to the S288C genome using MUMmer version 3.1 (Kurtz et al. 2004). Variants were extracted using custom Perl scripts, exported into a VCF variant file and further merged with those found using GATK, as described earlier. The biallelic SNP variants were extracted and filtered out at missing genotypes >0.20 and at minimum alternate allele frequency <0.01. This process resulted in a set of 313,972 SNP positions. To infer relationships among the strains, the table of SNPs (vcf format) was converted to a fasta file using SNPHYLO version 20140701 (Lee et al. 2014), and a maximum-likelihood genealogy was estimated using RAXML (raxmlHPC v8.1.3; Stamatakis 2014) with the GTRGAMMA model of sequence evolution. This complete SNP set was further phased using Beagle version 4 release 1399 (Browning and Browning 2007) with parameters phase-its = 10 and impute-its = 10. The population structure was inferred from this data set using the ADMIXTURE version 1.22 software (Alexander et al. 2009) and then FINESTRUCTURE v2.0 (Lawson et al. 2012), using the recombination rate given for S288C (http://wiki.yeastgenome.org/index.php/Combined_Physical_and_Genetic_Maps_of_S._cerevisiae) after phasing the data with Beagle 3.3 (Browning and Browning 2007). Admixture jointly infers K clusters at Hardy–Weinberg equilibrium and linkage equilibrium and estimates the membership proportions of all individuals in K clusters. The results of FINESTRUCTURE enabled the final assignment of each strain to a genotypic population.
Copy Number Variation
For each sample, per-base coverage was computed using genomecov (-d parameter) from the BEDTools suite (Quinlan and Hall 2010), version 2.17.0. Coverage was then averaged over nonoverlapping 1,000-bp bins. A Kruskal–Wallis test searching for a global origin effect at a 5% BH-corrected significance threshold revealed 2,761 segments. To reduce the impact of the loss of a gene, coverage log ratio values were set to −3 for regions with lower log2 ratios. Among segments with significant differences, only those with a minimum mean log2 ratio difference between populations >1 were kept for AFM and discussion.
Genetic Variation and Coding Impact
SIFT4G annotator version 1.0 and yeast dbSNP build 74 were used to predict whether an amino acid substitution would affect protein function according to the physical properties and conservation of amino acids (Ng and Henikoff 2001).
Genetic Analyses
For this analysis, SNP positions were filtered out at missing genotypes >0.10 and at a minimum alternate allele frequency of <0.05. This process resulted in a set of 367,863 biallelic SNP positions. The SNP positions were then phased using Beagle version 4 with default parameters.
To estimate the different parameters, the genotypic populations were extracted with vcf-subset, and invariant positions were removed by filtering. Fis was calculated for subpopulations containing nonsporulating individuals using an R-script written by Eva Chan (http://www.evachan.org; last accessed March 1, 2018), and the outcrossing rates were calculated from the multilocus estimate of Fis using the relation t = (1 − Fis)/(1 + Fis) (Enjalbert and David 2000; Magwene et al. 2011). Linkage disequilibrium (r2) was analyzed on phased data for wine and flor populations using plinkv1.9 (Purcell et al. 2007), and r2 was averaged for classes consisting of 10-bp distances surrounding each SNP. Dxy, Theta pi and Theta rho were calculated from the phased data with the PopGenome 2.0.3 package (Pfeifer et al. 2014), recombination rates were estimated using the FastEPRR program (Gao et al. 2016) with 100-kb windows, and mitosis/meiosis ratios were calculated for each chromosome according to Tsai et al. (2008). The mean result of the 16 analyses is presented here. Time divergence was estimated using the mutation rate of Zhu et al. (2014).
Tests for Detecting Positive Selection
We used a combination of approaches to detect positive selection to identify adaptive events that occurred at different time-frames. Positive selection over the short term was investigated in terms of population differentiation as measured by hapflk statistics (Fariello et al. 2013) and by searching for the footprints of selective sweeps using the iHS, SVD, and normalized version of H statistics (Fay and Wu 2000; Voight et al. 2006; Zeng et al. 2006; Hussin et al. 2010; Alachiotis et al. 2012). During its process, a selective sweep of the causal variant and its neighbors in the same haplotype reaches a high prevalence in a population. This high prevalence persists in the population until recombination breaks these associations down. These statistics are based on the ratio between the haplotype homozygosity measured for the ancestor and the derived focal alleles of an SNP. We therefore used S. paradoxus (CBS432) and S. mikate (IFO 1815) (www.saccharomycessensustricto.org; last accessed March 1, 2018) (Scannell et al. 2011) to infer the ancestral allele for each population.
For these analyses, to increase our ability to detect potential selection signals by comparing fermentation populations to those from natural origins, we complemented the SNP data sets obtained as indicated above with genomic data obtained from seven oak yeasts (Almeida et al. 2015). Variant calling was performed as above, but only at known variant positions that had been found previously. These oak yeast SNP variants were then merged with those from Genowine and Evolya. Biallelic SNP variants were then extracted and filtered at missing genotypes >0.10 and at minimum alternate allele frequencies <0.05, resulting in a set of 413,169 biallelic SNPs. If the sequenced strain was obtained from a haploid spore, only one phase over two was kept.
Genome scans for population differentiation were performed using HapFLK v1.3. For each data set, the number of haplotype clusters was inferred from FASTPHASE v1.4. The iHS values were estimated using the R package ReHH v2.02 (Gautier and Vitalis 2012), and H and SVDN were estimated with the SVDtools software (Hussin et al. 2010) using a 41 SNP window. Manhattan plots were drawn using a customized version of the CMPlot v3.2 R package. The P values from all tests were adjusted for use in multiple tests (Benjamini and Hochberg 1995). For omega, H, and SVDN, the thresholds for the wine and Med oak populations were estimated from 1,000 replicates of simulated populations with Ms (Hudson 2002), using the demographic scenario estimated previously (Almeida et al. 2015). For the rum and cheese populations, only the 1/1,000 highest values were considered. The different data sets are available at: http://dx.doi.org/10.15454/2VZ16D.
Introgressions and Horizontal Gene Transfer Detection
Introgressions were detected by the pairwise alignment of the assembled genomes with the genome sequences of six Saccharomyces species (S. arboricola CBS 10644T, S. kudriavzevii IFO 1802T, S. mikatae IFO 1815T, S. paradoxus CBS432T, S. eubayanus FM1318 and S. uvarum CBS 7001) (Scannell et al. 2011; Liti et al. 2013; Baker et al. 2015) using the nucmer module of MUMmer (Kurtz et al. 2004) with a minimum cluster length of 100 and retaining sequences longer than 1 kb with an identity >99%. Regions closer than 100 bp were fused. In the second step, these regions were compared by blast to the six species and to S. cerevisiae S288C and EC1118 in order to validate their origin. Only the regions with the best homology (>96%) were considered to have introgressed from that species.
HGTs were detected using blastn and dedicated Perl scripts. We searched genomic regions with no match to S288C (E-value >10−50) in each of the assembled genomes. From the profile of pairwise shared segments longer than 1,000 bp obtained after blast, we organized these regions into clusters with similar content and defined new regions as the ones with larger sizes, including all others. ORFs with a minimum protein length of 145 aa were then predicted with ORFfinder (NCBI) in each region, and each sequence in the collection was used as a starting protein for a blast search of the nr database (NCBI, version October 2017). The results were then filtered, taking only those hits with an e-value below 1e-05 and an overlap between the query and target proteins of at least 50%. Only the best 100 sequences, if present, were considered. Alignments were reconstructed using the pipeline described in (Huerta-Cepas et al. 2011). Briefly, once the homologous sequences were obtained from the blast search, multiple sequence alignments were reconstructed using three different programs (MUSCLE v3.8, MAFFT v6.861b and Kalign v2.04; Katoh et al. 2005; Lassmann and Sonnhammer 2005), and in both the forward and reverse orientations (Landan and Graur 2007). A consensus alignment was obtained using Mcoffee (Wallace et al. 2006), and trimAl (Capella-Gutiérrez et al. 2009) was then used to trim this alignment using a consistency score (-ct 0.166667) and a gap threshold of 0.1 (-gt 0.1). The trimmed alignment was then used to reconstruct the maximum likelihood tree using RAxML (raxmlHPC v8.2.4) (Stamatakis 2014). The best evolutionary model was chosen using the PROTGAMMAAUTO option implemented in RAxML.
Inference of the Origin of the Genomic Regions
ETE v3.0 (Huerta-Cepas and Bork 2016) was used to explore the resulting phylogenetic trees. For each tree, all the clades containing exclusively Saccharomyces cerevisiae strains were obtained. If multiple clades existed, we performed topology testing using CONSEL (Shimodaira and Hasegawa 2001). First, we reconstructed as many constrained trees as needed, each grouping the clade containing our sequence of interest with another S. cerevisiae clade. Constrained trees were reconstructed using RAxML the constraint of a completely multifurcated tree that simply separated our sequences of interest from the remaining sequences, and the relationships within the two bifurcated groups were determined by the RAxML reconstruction. The same model chosen during the initial phylogenetic reconstruction was used to reconstruct the constrained tree. RAxML was then used to calculate the per-site likelihoods of all the constraint trees and the initial tree, and CONSEL was used to determine which of those trees were supported by the alignment (AU test < 0.01). A region was inferred as originating from HGT when more 50% of proteins had a sister group from the Saccharomyces genus.
The different phylogenies are available at http://dx.doi.org/10.15454/VKYWUT.
Phenotypic Analyses
A subset of 58 strains from different genotypic origins (bread/beer, cheese, flor, wine, Med oak, NA oak, and rum/bioethanol) were characterized in terms of their ability to perform wine fermentation and to grow with galactose as a carbon source. The fermentations, inoculated at a density of 1×10⁶ cells per milliliter, were carried out in duplicate in 1.1-l fermenters in synthetic MS medium (Bely et al. 1990), as previously described (Camarasa et al. 2011). For data analysis, five variables were determined from the entire fermentation rate curve as previously described: the total amount of CO2 released, the times required to ferment 50% (T50) and 75% (T75) of sugars, the maximum CO2 production rate (Vmax) and the CO2 production rate midfermentation (V50). The cells and dry weight of the yeast cell populations were measured as described previously (Camarasa et al. 2011) at T75 (when 75% of the sugar had been consumed). Glucose and fermentation products (acetate, succinate, glycerol, and ethanol) were analyzed by high-pressure liquid chromatography (HPLC 1100, Agilent Technologies; Camarasa et al. 2011), and the concentrations of volatile compounds were assayed by GC-MS after extraction with dichloromethane (Rollero et al. 2015). Growth curves on YNB with galactose as the sole carbon source were performed in 96-well microplates and measured at 600 nm in a Tecan F200 PRO spectrophotometer at 24°C.
Phenotype–Genotype Association
Statistical analysis was performed with R software, version 3.2.3 (R Development Core Team 2011).
The first data set contains the most reliable CNV, defined with the 1-kb window described earlier.
Three other data sets contain phenotypic data. The first contains phenotypes measured at 85 g of released CO2 during the alcoholic fermentation (kinetic, metabolites, and volatiles variables); the second contains the estimated fluxes obtained with a constrained model of the metabolites measured at 11 g of released CO2 during alcoholic fermentation; and the third includes the transferred regions. Phenotypes were measured in biological duplicates, and the data were corrected for block effects using a random linear model (nlme package). In addition, the normality of residual distributions and homogeneity of variance were studied by standard diagnostic graphs, and no violation of the assumptions was detected. All subsequent analyses were performed using the predicted mean for each studied strain of the linear model of the phenotypes data.
To analyze the duration of fermentation, we used survival analysis to compare the capacity to complete fermentation based on genetic origin (Kaplan–Meier model and log-rank test). We defined a strain as having completed fermentation if the final released CO2 was >105 g/l (status = 1) and strain as not having completed fermentation if the final released CO2 was ≤105 g/l (censored strain, status = 0). A P value of the log-rank test < 0.05 indicates that there is a difference between genetic origins in completing fermentation (Therneau 2014).
Multivariate factorial analysis (MFA) was also performed to obtain an overview of the data sets, which consisted of 428 CNVs, 30 phenotypic variables (kinetic, metabolites, and volatiles), 27 transferred regions and 23 fluxes measured for 52 strains (Nidelet et al. 2016). The MFA considered the structure of the four groups of data and balanced the influence of each group of variables. This step enabled the study of links between genotype data and phenotype data by comparing the projections obtained in the first three axes (Lê et al. 2008).
We then used a sparse partial least squares—discriminant analysis (sPLS-DA), an exploratory approach in a supervised context, to select the most important variables for the phenotypic data set (kinetic, metabolites, and volatiles variables) relative to the seven strain origins (Lê Cao et al. 2011). We tuned the number of dimensions of the sPLS-DA to 3 and the number of variables to 15 (5 for each dimension).
Supplementary Material
Supplementary data are available at Molecular Biology and Evolution online.
Supplementary Material
Acknowledgments
This study was supported by grants from GIS IBiSA-AO 2010-2011, France to S.D., V.G., J.L.L., and F.B. and from AIP Bioressources from the National Institute for Agricultural Research, France to S.D., V.G., J.L.L., F.B. The authors are thankful to P. Brial for her technical assistance with strains phenotyping, and S. Malet and T. Marlin for their assistance with molecular construction.
References
- Akao T, Yashiro I, Hosoyama A, Kitagaki H, Horikawa H, Watanabe D, Akada R, Ando Y, Harashima S, Inoue T et al. , . 2011. Whole-genome sequencing of sake yeast Saccharomyces cerevisiae Kyokai no. 7. DNA Res. 186:423–434. [DOI] [PMC free article] [PubMed] [Google Scholar]
- Alachiotis N, Stamatakis A, Pavlidis P.. 2012. OmegaPlus: a scalable tool for rapid detection of selective sweeps in whole-genome datasets. Bioinformatics 2817:2274–2275. [DOI] [PubMed] [Google Scholar]
- Alexander DH, Novembre J, Lange K.. 2009. Fast model-based estimation of ancestry in unrelated individuals Fast model-based estimation of ancestry in unrelated individuals. Genome Res. 199:1655–1664. [DOI] [PMC free article] [PubMed] [Google Scholar]
- Almeida P, Barbosa R, Bensasson D, Gonçalves P, Sampaio JP.. 2017. Adaptive divergence in wine yeasts and their wild relatives suggests a prominent role for introgressions and rapid evolution at noncoding sites. Mol Ecol. 267:2167–2182. [DOI] [PubMed] [Google Scholar]
- Almeida P, Barbosa R, Zalar P, Imanishi Y, Shimizu K, Turchetti B, Legras J-L, Serra M, Dequin S, Couloux A et al. , . 2015. A population genomics insight into the Mediterranean origins of wine yeast domestication. Mol Ecol. 2421:5412–5427. [DOI] [PubMed] [Google Scholar]
- Argueso JL, Carazzolle MF, Mieczkowski PA, Duarte FM, Netto OVC, Missawa SK, Galzerani F, Costa GGL, Vidal RO, Noronha MF et al. , . 2009. Genome structure of a Saccharomyces cerevisiae strain widely used in bioethanol production. Genome Res. 1912:2258–2270. [DOI] [PMC free article] [PubMed] [Google Scholar]
- Badouin H, Gladieux P, Gouzy J, Siguenza S, Aguileta G, Snirc A, Le Prieur S, Jeziorski C, Branca A, Giraud T.. 2017. Widespread selective sweeps throughout the genome of model plant pathogenic fungi and identification of effector candidates. Mol Ecol. 267:2041–2062. [DOI] [PubMed] [Google Scholar]
- Baker E, Wang B, Bellora N, Peris D, Hulfachor AB, Koshalek JA, Adams M, Libkind D, Hittinger CT.. 2015. The genome sequence of Saccharomyces eubayanus and the domestication of Lager-Brewing yeasts. Mol Biol Evol. 3211:2818–2831. [DOI] [PMC free article] [PubMed] [Google Scholar]
- Bely M, Sablayrolles J-M, Barre P.. 1990. Automatic detection of assimilable nitrogen deficiencies during alcoholic fermentation in oenological conditions. J Ferment Bioeng. 704:246–252. [Google Scholar]
- Benjamini Y, Hochberg Y.. 1995. Controlling the false discovery rate: a practical and powerful approach to multiple testing. J R Stat Soc. 57:289–300. [Google Scholar]
- Bolger AM, Lohse M, Usadel B.. 2014. Genome analysis Trimmomatic : a flexible trimmer for Illumina sequence data. Bioinformatics 3015:2114–2120. [DOI] [PMC free article] [PubMed] [Google Scholar]
- Borneman AR, Desany BA, Riches D, Affourtit JP, Forgan AH, Pretorius IS, Egholm M, Chambers PJ.. 2011. Whole-genome comparison reveals novel genetic elements that characterize the genome of industrial strains of Saccharomyces cerevisiae. PLoS Genet. 72:e1001287.. [DOI] [PMC free article] [PubMed] [Google Scholar]
- Borneman AR, Forgan AH, Pretorius IS, Chambers PJ.. 2008. Comparative genome analysis of a Saccharomyces cerevisiae wine strain. FEMS Yeast Res. 87:1185–1195. [DOI] [PubMed] [Google Scholar]
- Brice C, Cubillos FA, Dequin S, Camarasa C, Martínez C.. 2018. Adaptability of the Saccharomyces cerevisiae yeasts to wine fermentation conditions relies on their strong ability to consume nitrogen. PLoS One 132:e0192383.. [DOI] [PMC free article] [PubMed] [Google Scholar]
- Browning SR, Browning BL.. 2007. Rapid and accurate haplotype phasing and missing-data inference for whole-genome association studies by use of localized haplotype clustering. Am J Hum Genet. 815:1084–1097. [DOI] [PMC free article] [PubMed] [Google Scholar]
- Camarasa C, Sanchez I, Brial P, Bigey F, Dequin S.. 2011. Phenotypic landscape of Saccharomyces cerevisiae during wine fermentation: evidence for origin-dependent metabolic traits. PLoS One 69:e25147.. [DOI] [PMC free article] [PubMed] [Google Scholar]
- Capella-Gutiérrez S, Silla-Martínez JM, Gabaldón T.. 2009. trimAl: a tool for automated alignment trimming in large-scale phylogenetic analyses. Bioinformatics 2515:1972–1973. [DOI] [PMC free article] [PubMed] [Google Scholar]
- Coi AL, Bigey F, Mallet S, Marsit S, Zara G, Gladieux P, Galeote V, Budroni M, Dequin S, Legras JL.. 2017. Genomic signatures of adaptation to wine biological ageing conditions in biofilm-forming flor yeasts. Mol Ecol. 38:42–49. [DOI] [PubMed] [Google Scholar]
- Crépin L, Nidelet T, Sanchez I, Dequin S, Camarasa C.. 2012. Sequential use of nitrogen compounds by Saccharomyces cerevisiae during wine fermentation: a model based on kinetic and regulation characteristics of nitrogen permeases. Appl Environ Microbiol. 7822:8102–8111. [DOI] [PMC free article] [PubMed] [Google Scholar]
- Cromie GA, Hyma KE, Ludlow CL, Garmendia-Torres C, Gilbert TL, May P, Huang A. a, Dudley AM, Fay JC.. 2013. Genomic sequence diversity and population structure of Saccharomyces cerevisiae assessed by RAD-seq. G3 (Bethesda) 312:2163–2171. [DOI] [PMC free article] [PubMed] [Google Scholar]
- Dugat-Bony E, Straub C, Teissandier A, Onésime D, Loux V, Monnet C, Irlinger F, Landaud S, Leclercq-Perlat M-N, Bento P et al. , . 2015. Overview of a surface-ripened cheese community functioning by meta-omics analyses. PLoS One 104:e0124360. [DOI] [PMC free article] [PubMed] [Google Scholar]
- Dunham MJ, Badrane H, Ferea TL, Adams J, Brown PO, Rosenzweig F, Botstein D.. 2002. Characteristic genome rearrangements in experimental evolution of Saccharomyces cerevisiae. Proc Natl Acad Sci U S A. 9925:16144–16149. [DOI] [PMC free article] [PubMed] [Google Scholar]
- Dunn B, Richter C, Kvitek DJ, Pugh T, Sherlock G.. 2012. Analysis of the Saccharomyces cerevisiae pan-genome reveals a pool of copy number variants distributed in diverse yeast strains from differing industrial environments. Genome Res. 225:908–924. [DOI] [PMC free article] [PubMed] [Google Scholar]
- Engel SR, Cherry JM.. 2013. The new modern era of yeast genomics: community sequencing and the resulting annotation of multiple Saccharomyces cerevisiae strains at the Saccharomyces Genome Database. Database (Oxford) 2013:bat012.. [DOI] [PMC free article] [PubMed] [Google Scholar]
- Enjalbert J, David JL.. 2000. Inferring recent outcrossing rates using multilocus individual heterozygosity: application to evolving wheat populations. Genetics 1564:1973–1982. [DOI] [PMC free article] [PubMed] [Google Scholar]
- Fariello MI, Boitard S, Naya H, SanCristobal M, Servin B.. 2013. Detecting signatures of selection through haplotype differentiation among hierarchically structured populations. Genetics 1933:929–941. [DOI] [PMC free article] [PubMed] [Google Scholar]
- Fay JC, Benavides JA.. 2005. Evidence for domesticated and wild populations of Saccharomyces cerevisiae. PLoS Genet. 11:66–71. [DOI] [PMC free article] [PubMed] [Google Scholar]
- Fay JC, Wu CI.. 2000. Hitchhiking under positive Darwinian selection. Genetics 1553:1405–1413. [DOI] [PMC free article] [PubMed] [Google Scholar]
- Freedman AH, Lohmueller KE, Wayne RK.. 2016. Evolutionary history, selective sweeps, and deleterious variation in the dog. Annu Rev Ecol Evol Syst. 471:73–96. [Google Scholar]
- Galeote V, Bigey F, Beyne E, Novo M, Legras J-L, Casaregola S, Dequin S.. 2011. Amplification of a Zygosaccharomyces bailii DNA segment in wine yeast genomes by extrachromosomal circular DNA formation. PLoS One 63:e17872.. [DOI] [PMC free article] [PubMed] [Google Scholar]
- Galeote V, Novo M, Salema-Oom M, Brion C, Valério E, Gonçalves P, Dequin S.. 2010. FSY1, a horizontally transferred gene in the Saccharomyces cerevisiae EC1118 wine yeast strain, encodes a high-affinity fructose/H+ symporter. Microbiology 156(Pt 12):3754–3761. [DOI] [PubMed] [Google Scholar]
- Gallone B, Steensels J, Prahl T, Soriaga L, Saels V, Herrera-Malaver B, Merlevede A, Roncoroni M, Voordeckers K, Miraglia L et al. , . 2016. Domestication and divergence of Saccharomyces cerevisiae beer yeasts. Cell 1666:1397–1410.e16. [DOI] [PMC free article] [PubMed] [Google Scholar]
- Gao F, Ming C, Hu W, Li H.. 2016. New software for the fast estimation of population recombination rates (FastEPRR) in the genomic era. G3 (Bethesda) 66:1563–1571. [DOI] [PMC free article] [PubMed] [Google Scholar]
- Gautier M, Vitalis R.. 2012. rehh: an R package to detect footprints of selection in genome-wide SNP data from haplotype structure. Bioinformatics 288:1176–1177. [DOI] [PubMed] [Google Scholar]
- Gibbons JG, Rinker DC.. 2015. The genomics of microbial domestication in the fermented food environment. Curr Opin Genet Dev. 35:1–8. [DOI] [PMC free article] [PubMed] [Google Scholar]
- Gibbons JG, Salichos L, Slot JC, Rinker DC, McGary KL, King JG, Klich MA, Tabb DL, McDonald WH, Rokas A.. 2012. The evolutionary imprint of domestication on genome variation and function of the filamentous fungus Aspergillus oryzae. Curr Biol. 2215:1403–1409. [DOI] [PMC free article] [PubMed] [Google Scholar]
- Gladieux P, Ropars J, Badouin H, Branca A, Aguileta G, de Vienne DM, Rodríguez de la Vega RC, Branco S, Giraud T.. 2014. Fungal evolutionary genomics provides insight into the mechanisms of adaptive divergence in eukaryotes. Mol Ecol. 234:753–773. [DOI] [PubMed] [Google Scholar]
- Gladman S, Seeman T.. 2012. velvet optimiser. Available from: http://www.vicbioinformatics.com/software.velvetoptimiser.shtml, last accessed March 1, 2018.
- Goddard MR, Godfray HCJ, Burt A.. 2005. Sex increases the efficacy of natural selection in experimental yeast populations. Nature 4347033:636–640. [DOI] [PubMed] [Google Scholar]
- Goddard MR, Greig D.. 2015. Saccharomyces cerevisiae: a nomadic yeast with no niche? FEMS Yeast Res. 153:1–6. [DOI] [PMC free article] [PubMed] [Google Scholar]
- Goel M, Khanna P, Kishore J.. 2010. Understanding survival analysis: Kaplan–Meier estimate. Int J Ayurveda Res. 14:274–278. [DOI] [PMC free article] [PubMed] [Google Scholar]
- Guillaume C, Delobel P, Sablayrolles J-M, Blondin B.. 2007. Molecular basis of fructose utilization by the wine yeast Saccharomyces cerevisiae: a mutated HXT3 allele enhances fructose fermentation. Appl Environ Microbiol. 738:2432–2439. [DOI] [PMC free article] [PubMed] [Google Scholar]
- Hellenthal G, Busby GBJ, Band G, Wilson JF, Capelli C, Falush D, Myers S.. 2014. A genetic atlas of human admixture history. Science 3436172:747–751. [DOI] [PMC free article] [PubMed] [Google Scholar]
- Hudson RR. 2002. Generating samples under a Wright-Fisher neutral model of genetic variation. Bioinformatics 182:337–338. [DOI] [PubMed] [Google Scholar]
- Huerta-Cepas J, Capella-Gutierrez S, Pryszcz LP, Denisov I, Kormes D, Marcet-Houben M, Gabaldón T.. 2011. PhylomeDB v3.0: an expanding repository of genome-wide collections of trees, alignments and phylogeny-based orthology and paralogy predictions. Nucleic Acids Res. 39(Database):D556–D560. [DOI] [PMC free article] [PubMed] [Google Scholar]
- Huerta-Cepas J, Serra F, Bork P. 2016. ETE 3: Reconstruction, Analysis, and Visualization of Phylogenomic Data. Mol. Biol. Evol. 33:1635–1638. [DOI] [PMC free article] [PubMed] [Google Scholar]
- Hussin J, Nadeau P, Lefebvre J-F, Labuda D.. 2010. Haplotype allelic classes for detecting ongoing positive selection. BMC Bioinformatics 11:65.. [DOI] [PMC free article] [PubMed] [Google Scholar]
- Katoh K, Kuma KI, Toh H, Miyata T.. 2005. MAFFT version 5: improvement in accuracy of multiple sequence alignment. Nucleic Acids Res. 332:511–518. [DOI] [PMC free article] [PubMed] [Google Scholar]
- Kondrashov FA. 2012. Gene duplication as a mechanism of genomic adaptation to a changing environment. Proc R Soc B Biol Sci. 2791749:5048–5057. [DOI] [PMC free article] [PubMed] [Google Scholar]
- Kowallik V, Miller E, Greig D.. 2015. The interaction of Saccharomyces paradoxus with its natural competitors on oak bark. Mol Ecol. 247:1596–1610. [DOI] [PMC free article] [PubMed] [Google Scholar]
- Kuang MC, Hutchins PD, Russell JD, Coon JJ, Hittinger CT.. 2016. Ongoing resolution of duplicate gene functions shapes the diversification of a metabolic network. Elife 5:1–28. [DOI] [PMC free article] [PubMed] [Google Scholar]
- Kurtz S, Phillippy A, Delcher AL, Smoot M, Shumway M, Antonescu C, Salzberg SL.. 2004. Versatile and open software for comparing large genomes. Genome Biol. 52:R12.. [DOI] [PMC free article] [PubMed] [Google Scholar]
- Landan G, Graur D.. 2007. Heads or tails: a simple reliability check for multiple sequence alignments. Mol Biol Evol. 246:1380–1383. [DOI] [PubMed] [Google Scholar]
- Lassmann T, Sonnhammer ELL.. 2005. Kalign – an accurate and fast multiple sequence alignment algorithm. BMC Bioinformatics 61:298–299. [DOI] [PMC free article] [PubMed] [Google Scholar]
- Lawson DJ, Hellenthal G, Myers S, Falush D.. 2012. Inference of population structure using dense haplotype data. PLoS Genet. 81:e1002453.. [DOI] [PMC free article] [PubMed] [Google Scholar]
- Lê Cao K, Boitard S, Besse P.. 2011. Sparse PLS discriminant analysis: biologically relevant feature selection and graphical displays for multiclass problems. BMC Bioinformatics 12:253.. [DOI] [PMC free article] [PubMed] [Google Scholar]
- Lê S, Josse J, Husson F.. 2008. FactoMineR : an R package for multivariate analysis. J Stat Softw. 251:1–18. [Google Scholar]
- Lee T-H, Guo H, Wang X, Kim C, Paterson AH.. 2014. SNPhylo: a pipeline to construct a phylogenetic tree from huge SNP data. BMC Genomics 15:162.. [DOI] [PMC free article] [PubMed] [Google Scholar]
- Legras J-L, Erny C, Charpentier C.. 2014. Population structure and comparative genome hybridization of European Flor yeast reveal a unique group of Saccharomyces cerevisiae strains with few gene duplications in their genome. PLoS One 910:e108089.. [DOI] [PMC free article] [PubMed] [Google Scholar]
- Legras J-L, Merdinoglu D, Cornuet J-M, Karst F.. 2007. Bread, beer and wine: saccharomyces cerevisiae diversity reflects human history. Mol Ecol. 1610:2091–2102. [DOI] [PubMed] [Google Scholar]
- Li H, Durbin R.. 2009. Fast and accurate short read alignment with Burrows-Wheeler transform. Bioinformatics 2514:1754–1760. [DOI] [PMC free article] [PubMed] [Google Scholar]
- Liti G, Barton DBH, Louis EJ.. 2006. Sequence diversity, reproductive isolation and species concepts in Saccharomyces. Genetics 1742:839–850. [DOI] [PMC free article] [PubMed] [Google Scholar]
- Liti G, Carter DM, Moses AM, Warringer J, Parts L, James SA, Davey RP, Roberts IN, Burt A, Koufopanou V et al. , . 2009. Population genomics of domestic and wild yeasts. Nature 4587236:337–341. [DOI] [PMC free article] [PubMed] [Google Scholar]
- Liti G, Nguyen Ba AN, Blythe M, Müller CA, Bergström A, Cubillos FA, Dafhnis-Calas F, Khoshraftar S, Malla S, Mehta N et al. , . 2013. High quality de novo sequencing and assembly of the Saccharomyces arboricolus genome. BMC Genomics 14:69. [DOI] [PMC free article] [PubMed] [Google Scholar]
- Magwene PM, Kayıkçı Ö, Granek J. a, Reininga JM, Scholl Z, Murray D.. 2011. Outcrossing, mitotic recombination, and life-history trade-offs shape genome evolution in Saccharomyces cerevisiae. Proc Natl Acad Sci U S A. 1085:1987–1992. [DOI] [PMC free article] [PubMed] [Google Scholar]
- Marsit S, Dequin S.. 2015. Diversity and adaptive evolution of Saccharomyces wine yeast: a review. FEMS Yeast Res. 32:1695–1707. [DOI] [PMC free article] [PubMed] [Google Scholar]
- Marsit S, Mena A, Bigey F, Sauvage F-X, Couloux A, Guy J, Legras J-L, Barrio E, Dequin S, Galeote V.. 2015. Evolutionary advantage conferred by an eukaryote-to-eukaryote gene transfer event in wine yeasts. Mol Biol Evol. 327:1695–1707. [DOI] [PMC free article] [PubMed] [Google Scholar]
- Marsit S, Sanchez I, Galeote V, Dequin S.. 2016. Horizontally acquired oligopeptide transporters favour adaptation of Saccharomyces cerevisiae wine yeast to oenological environment. Environ Microbiol. 184:1148–1161. [DOI] [PubMed] [Google Scholar]
- McKenna A, Hanna M, Banks E, Sivachenko A, Cibulskis K, Kernytsky A, Garimella K, Altshuler D, Gabriel S, Daly M et al. , . 2010. The Genome Analysis Toolkit: a MapReduce framework for analyzing next-generation DNA sequencing data. Genome Res. 209:1297–1303. [DOI] [PMC free article] [PubMed] [Google Scholar]
- Mendes I, Franco-duarte R, Umek L, Fonseca E, Drumonde-Neves J, Dequin S, Zupan B, Schuler D.. 2013. Computational models for prediction of yeast strain potential for winemaking from phenotypic profiles. PLoS One 87:e66523.. [DOI] [PMC free article] [PubMed] [Google Scholar]
- Morales L, Dujon B.. 2012. Evolutionary role of interspecies hybridization and genetic exchanges in yeasts. Microbiol Mol Biol Rev. 764:721–739. [DOI] [PMC free article] [PubMed] [Google Scholar]
- Moran NA. 2002. Microbial minimalism: genome reduction in bacterial pathogens. Cell108:583–586. [DOI] [PubMed] [Google Scholar]
- Morran LT, Schmidt OG, Gelarden IA, Parrish RC, Lively CM.. 2011. Running with the Red Queen: host-parasite coevolution selects for biparental sex. Science 3336039:216–218. [DOI] [PMC free article] [PubMed] [Google Scholar]
- Muller LAH, McCusker JH.. 2009. A multispecies-based taxonomic microarray reveals interspecies hybridization and introgression in Saccharomyces cerevisiae. FEMS Yeast Res. 91:143–152. [DOI] [PMC free article] [PubMed] [Google Scholar]
- Murphy H. a, Zeyl CW.. 2010. Yeast sex: surprisingly high rates of outcrossing between Asci. PLoS One 55:e10461.. [DOI] [PMC free article] [PubMed] [Google Scholar]
- Ness F, Aigle M.. 1995. RTM1: a member of a new family of telomeric repeated genes in yeast. Genetics 1403:945–956. [DOI] [PMC free article] [PubMed] [Google Scholar]
- Ng PC, Henikoff S.. 2001. Predicting deleterious amino acid substitutions. Genome Res. 11:863–874. t [DOI] [PMC free article] [PubMed] [Google Scholar]
- Nidelet T, Brial P, Camarasa C, Dequin S.. 2016. Diversity of flux distribution in central carbon metabolism of S. cerevisiae strains from diverse environments. Microb Cell Fact. 15:58.. [DOI] [PMC free article] [PubMed] [Google Scholar]
- Novo M, Bigey F, Beyne E, Galeote V, Gavory F, Mallet S, Cambon B, Legras J-L, Wincker P, Casaregola S et al. , . 2009. Eukaryote-to-eukaryote gene transfer events revealed by the genome sequence of the wine yeast Saccharomyces cerevisiae EC1118. Proc Natl Acad Sci U S A. 10638:16333–16338. [DOI] [PMC free article] [PubMed] [Google Scholar]
- Pfeifer B, Wittelsbürger U, Ramos-Onsins SE, Lercher MJ.. 2014. PopGenome: an efficient Swiss army knife for population genomic analyses in R. Mol Biol Evol. 317:1929–1936. [DOI] [PMC free article] [PubMed] [Google Scholar]
- Purcell S, Neale B, Todd-Brown K, Thomas L, Ferreira MAR, Bender D, Maller J, Sklar P, de Bakker PIW, Daly MJ et al. , . 2007. PLINK: a tool set for whole-genome association and population-based linkage analyses. Am J Hum Genet. 813:559–575. [DOI] [PMC free article] [PubMed] [Google Scholar]
- Quinlan AR, Hall IM.. 2010. BEDTools: a flexible suite of utilities for comparing genomic features. Bioinformatics 266:841–842. [DOI] [PMC free article] [PubMed] [Google Scholar]
- R Development Core Team. 2011. R: a language and environment for statistical computing. Vienna (Austria): R Found. Stat. Comput. ISBN 3-900051-07-0.
- Renaut S, Rieseberg LH.. 2015. The accumulation of deleterious mutations as a consequence of domestication and improvement in sunflowers and other compositae crops. Mol Biol Evol. 329:2273–2283. [DOI] [PubMed] [Google Scholar]
- Rollero S, Bloem A, Camarasa C, Sanchez I, Ortiz-Julien A, Sablayrolles J, Dequin S, Mouret J.. 2015. Combined effects of nutrients and temperature on the production of fermentative aromas by Saccharomyces cerevisiae during wine fermation. Appl Microbiol Biotechnol. 995:2291–2304. [DOI] [PubMed] [Google Scholar]
- Roop JI, Chang KC, Brem RB.. 2016. Polygenic evolution of a sugar specialization trade-off in yeast. Nature 5307590:336–339. [DOI] [PMC free article] [PubMed] [Google Scholar]
- Ross-Ibarra J, Morrell PL, Gaut BS.. 2007. Plant domestication, a unique opportunity to identify the genetic basis of adaptation. Proc Natl Acad Sci U S A. 104(suppl 1):8641–8648. [DOI] [PMC free article] [PubMed] [Google Scholar]
- Ruderfer DM, Pratt SC, Seidel HS, Kruglyak L.. 2006. Population genomic analysis of outcrossing and recombination in yeast. Nat Genet. 389:1077–1081. [DOI] [PubMed] [Google Scholar]
- Scannell DR, Zill O. a, Rokas A, Payen C, Dunham MJ, Eisen MB, Rine J, Johnston M, Hittinger CT.. 2011. The awesome power of yeast evolutionary genetics: new genome sequences and strain resources for the Saccharomyces sensu stricto genus. G3 (Bethesda) 11:11–25. [DOI] [PMC free article] [PubMed] [Google Scholar]
- Shimodaira H, Hasegawa M.. 2001. CONSEL: for assessing the confidence of phylogenetic tree selection. Bioinformatics 1712:1246–1247. [DOI] [PubMed] [Google Scholar]
- Stamatakis A. 2014. RAxML version 8: a tool for phylogenetic analysis and post-analysis of large phylogenies. Bioinformatics 309:1312–1313. [DOI] [PMC free article] [PubMed] [Google Scholar]
- Strope PK, Skelly D. a, Kozmin SG, Mahadevan G, Stone E. a, Magwene PM, Dietrich FS, McCusker JH.. 2015. The 100-genomes strains, an S. cerevisiae resource that illuminates its natural phenotypic and genotypic variation and emergence as an opportunistic pathogen. Genome Res. 255:762–774. [DOI] [PMC free article] [PubMed] [Google Scholar]
- Therneau T. 2014. A package for survival analysis in S. R package version 2.37-7. http://CRAN.R-project.org/package=survival, last accessed March 1, 2018.
- Tsai IJ, Bensasson D, Burt A, Koufopanou V.. 2008. Population genomics of the wild yeast Saccharomyces paradoxus: quantifying the life cycle. Proc Natl Acad Sci U S A. 10512:4957–4962. [DOI] [PMC free article] [PubMed] [Google Scholar]
- Vatsiou AI, Bazin E, Gaggiotti OE.. 2016. Detection of selective sweeps in structured populations: a comparison of recent methods. Mol Ecol. 251:89–103. [DOI] [PubMed] [Google Scholar]
- Vitti JJ, Grossman SR, Sabeti PC.. 2013. Detecting natural selection in genomic data. Annu Rev Genet. 47:97–120. [DOI] [PubMed] [Google Scholar]
- Voight BF, Kudaravalli S, Wen X, Pritchard JK.. 2006. A map of recent positive selection in the human genome. PLoS Biol. 43:e72–0458. [DOI] [PMC free article] [PubMed] [Google Scholar]
- Wallace IM, O’Sullivan O, Higgins DG, Notredame C.. 2006. M-Coffee: combining multiple sequence alignment methods with T-Coffee. Nucleic Acids Res. 346:1692–1699. [DOI] [PMC free article] [PubMed] [Google Scholar]
- Warringer J, Zörgö E, Cubillos FA, Zia A, Gjuvsland A, Simpson JT, Forsmark A, Durbin R, Omholt SW, Louis EJ et al. , . 2011. Trait variation in yeast is defined by population history. PLoS Genet. 76:e1002111. [DOI] [PMC free article] [PubMed] [Google Scholar]
- Wei W, McCusker JH, Hyman RW, Jones T, Ning Y, Cao Z, Gu Z, Bruno D, Miranda M, Nguyen M et al. , . 2007. Genome sequencing and comparative analysis of Saccharomyces cerevisiae strain YJM789. Proc Natl Acad Sci U S A. 10431:12825–12830. [DOI] [PMC free article] [PubMed] [Google Scholar]
- Yvon M, Rijnen L.. 2001. Flavour formation by amino acid catabolism. Int Dairy J. 11(4–7):185–201. [Google Scholar]
- Zeng K, Fu YX, Shi S, Wu CI.. 2006. Statistical tests for detecting positive selection by utilizing high-frequency variants. Genetics 1743:1431–1439. [DOI] [PMC free article] [PubMed] [Google Scholar]
- Zhu YO, Siegal ML, Hall DW, Petrov D. a.. 2014. Precise estimates of mutation rate and spectrum in yeast. Proc Natl Acad Sci U S A. 11122:E2310–E2318. [DOI] [PMC free article] [PubMed] [Google Scholar]
- Zörgö E, Gjuvsland A, Cubillos F. a, Louis EJ, Liti G, Blomberg A, Omholt SW, Warringer J.. 2012. Life history shapes trait heredity by accumulation of loss-of-function alleles in yeast. Mol Biol Evol. 297:1781–1789. [DOI] [PubMed] [Google Scholar]
Associated Data
This section collects any data citations, data availability statements, or supplementary materials included in this article.