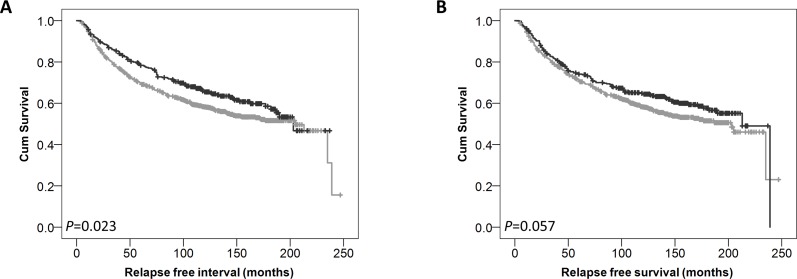
Figure 4. Kaplan-Meier analysis of breast cancer specific survival showing the impact of low (grey line) and high (black line) GPER protein expression.
within the cytoplasm in patients who did not receive endocrine therapy (A) or patients that did receive endocrine therapy (B) with significance determined using the log-rank test. The numbers shown below the Kaplan-Meier survival curves are the number of patients at risk at the specified month.

