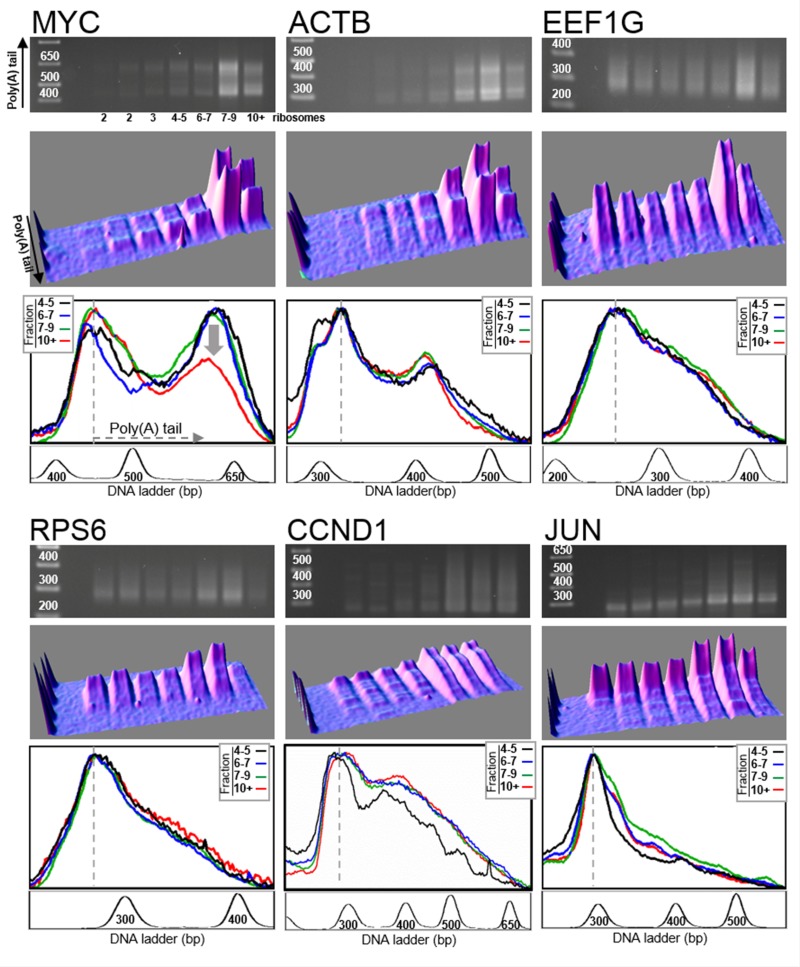
Figure 3. Distribution of poly(A) tail lengths in eRF3a-depleted cells.
Human HCT116 cells were electroporated with a plasmid expressing small interfering RNAs targeting eRF3a mRNA (sh-3a1). Three days after electroporation, the cell extract was fractionated on sucrose gradient and RNAs were extracted from the polysomal fractions. RNAs were subjected to LM-PAT analysis and cDNAs were amplified with gene specific forward primers. For the six genes presented, cDNAs were amplified from the same polysome fractionation experiment and LM-PAT reaction; only gene specific forward primers differ according to the analyzed gene. For each gene, MYC, ACTB, EEF1G, RPS6, CCND1 and JUN, the agarose gel with DNA ladder on the left (top panel), the 3D surface plot analysis of the agarose gel (middle panel), and the stacked image of the density profiles of the last four lanes corresponding to heavy polysomes (bottom panel) are shown. In the density profile panel, the fraction containing 4–5 ribosomes is in black, the fraction 6–7 ribosomes in blue, the fraction 7–9 ribosomes in green and the fraction with more than 10 ribosomes (10+) in red. The density profiles of the gel lanes were performed without O. D. calibration allowing to normalize the profiles on the most intense band corresponding to mRNAs with minimal poly(A) tail (indicated by a dotted line). For each gene, a profile of the DNA ladder is presented below the density profile panel.

