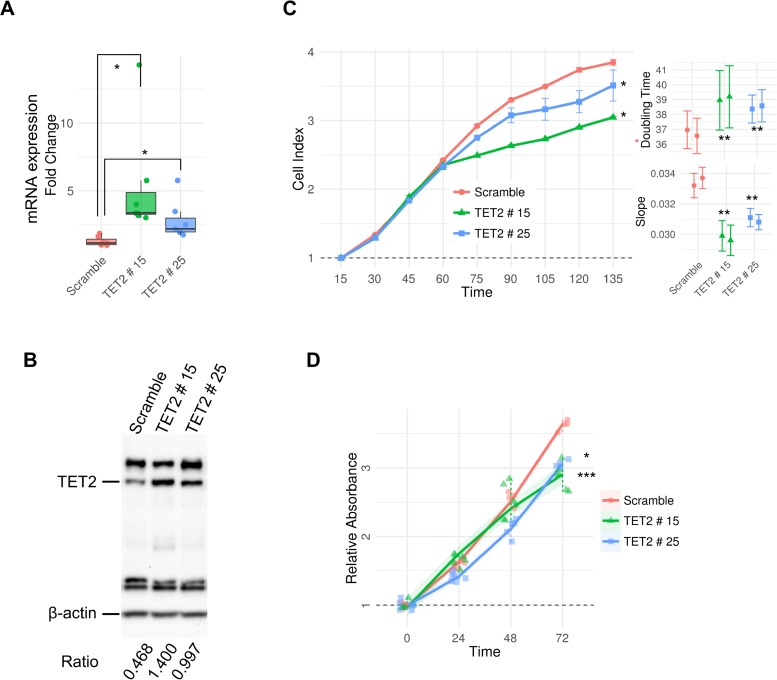
Figure 3. In vitro effects of TET2 restoration in LN229 glioblastoma cell line.
(A) qRT-PCR of TET2 transfected variant 1 in two clones of LN229. Expression levels were determined by real time-PCR and data, are expressed as a ratio with respect to GAPDH. Fold change was calculated relative to scramble. (B) WB analysis against TET2 in the same LN229 clones. Ratios between TET2 and β-actin intensity values calculated with ChemiDoc™ XRS+ software are shown. (C) Proliferation rate was represented as cell index units. The graphic shows average and standard deviation of two technical replicates of each clone over 135 hours. Slope (1/hours) and doubling time (hours), analyzed during the exponential growth phase (15–72 h), is also shown (right panels). (D) Cell viability was determined by MTT assay on scramble and TET2-stably transfected cells. The average absorbance in six replicates at various time points, normalized with respect to the average absorbance at time 0 h for each sample, are represented. Wilcoxon signed rank test and general linear models were applied and p-values were adjusted applying the Bonferroni correction. *p-value < 0.05; ***p-value < 0.001.

