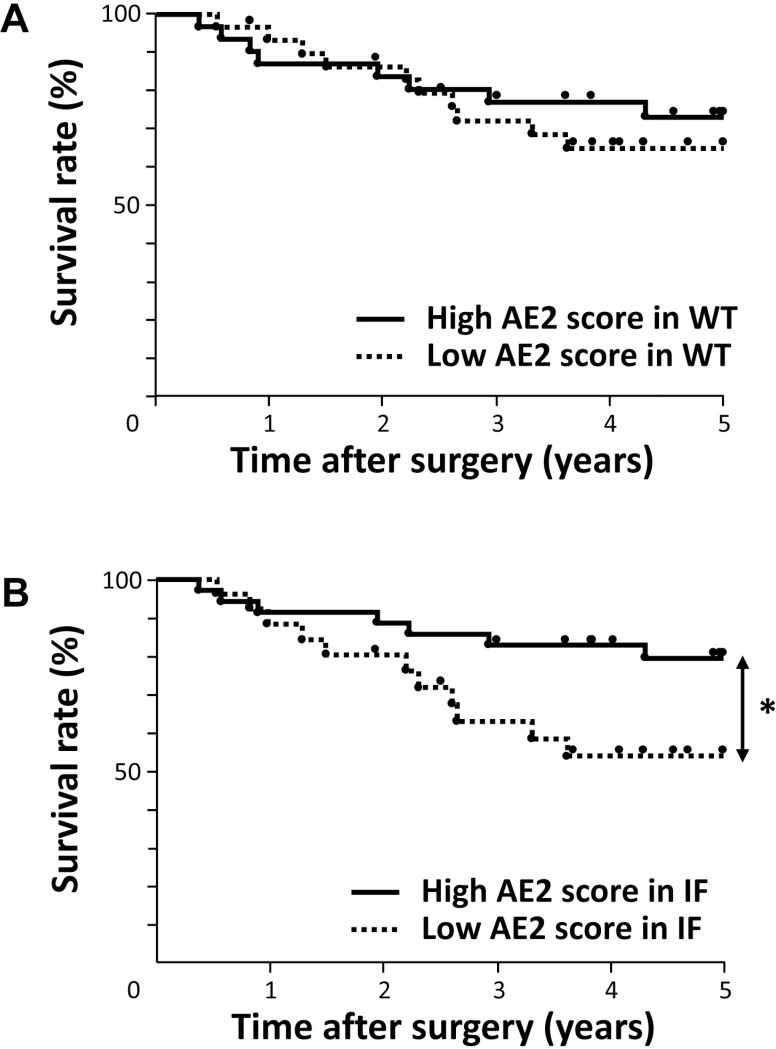
Figure 5. Survival curve of patients after curative resection for ESCC according to the expression of AE2.
(A) Patients were classified into two groups: low-grade expression of AE2 (n = 30) and high-grade expression of AE2 (n = 31) in the whole tumor (WT). (B) Patients were classified into two groups: low-grade expression of AE2 (n = 26) and high-grade expression of AE2 (n = 35) at the invasive front of the tumor (IF). *p < 0.05: Log-rank test.

