

Abstract
OBJECTIVES
The purpose of this study was to explore the diagnostic usefulness of hybrid cardiac magnetic resonance (CMR) and positron emission tomography (PET) using 18F-fluorodeoxyglucose (FDG) for active cardiac sarcoidosis.
BACKGROUND
Active cardiac sarcoidosis (aCS) is underdiagnosed and has a high mortality.
METHODS
Patients with clinical suspicion of aCS underwent hybrid CMR/PET with late gadolinium enhancement (LGE) and FDG to assess the pattern of injury and disease activity, respectively. Patients were categorized visually as magnetic resonance (MR)+PET+ (characteristic LGE aligning exactly with increased FDG uptake), MR+PET− (characteristic LGE but no increased FDG), MR−PET− (neither characteristic LGE nor increased FDG), and MR−PET+ (increased FDG uptake in absence of characteristic LGE) and further characterized as aCS+ (MR+PET+) or aCS− (MR+PET−, MR−PET−, MR−PET+). FDG uptake was quantified using maximum target-to-normal-myocardium ratio and the net uptake rate (Ki) from dynamic Patlak analysis. Receiver-operating characteristic methods were used to identify imaging biomarkers for aCS. FDG PET was assessed using computed tomography/PET in 19 control subjects with healthy myocardium.
RESULTS
A total of 25 patients (12 males; 54.9 ± 9.8 years of age) were recruited prospectively; 8 were MR+PET+, suggestive of aCS; 1 was MR+PET−, consistent with inactive cardiac sarcoidosis; and 8 were MR−PET−, with no imaging evidence of cardiac sarcoidosis. Eight patients were MR−PET+ (6 with global myocardial FDG uptake, 2 with focal-on-diffuse uptake); they demonstrated distinct Ki values and hyperintense maximum standardized uptake value compared with MR+PET+ patients. Similar hyperintense patterns of global (n = 9) and focal-on-diffuse (n = 2) FDG uptake were also observed in control patients, suggesting physiological myocardial uptake. Maximum target-to-normal-myocardium ratio values were higher in the aCS+ group (p < 0.001), demonstrating an area under the curve of 0.98 on receiver-operating characteristic analysis for the detection of aCS, with an optimal maximum target-to-normal myocardium ratio threshold of 1.2 (Youden index: 0.94).
CONCLUSIONS
CMR/PET imaging holds major promise for the diagnosis of aCS, providing incremental information about both the pattern of injury and disease activity in a single scan. (In Vivo Molecular Imaging [MRI] of Atherothrombotic Lesions; NCT01418313)
Keywords: cardiac sarcoidosis, 18F-fluorodeoxyglucose, MR/PET
Sarcoidosis is a multisystem condition primarily involving the lungs and lymph nodes that is characterized by granuloma formation, inflammation, and sometimes fibrosis. Cardiac involvement is clinically manifest in just 5% to 10% of sarcoidosis patients, but can be identified at autopsy in approximately 25% and is the most frequent cause of death (1,2). The accurate diagnosis of subclinical but active cardiac sarcoidosis (aCS) is, therefore, important (1); however, a gold standard assessment remains lacking. The yield of endomyocardial biopsy is low due to the patchy distribution of myocardial disease (3), the Japanese Ministry of Health and Welfare criteria (4) lack sensitivity, and echocardiographic findings of regional wall thickening/thinning or motion abnormalities are neither specific nor sensitive (1). A recent expert consensus statement suggested a combined approach using multiple different investigations to diagnose aCS (5). These included advanced myocardial imaging with cardiac magnetic resonance (CMR) and positron emission tomography (PET).
CMR offers accurate assessments of left ventricular wall thickness and function, but also detailed tissue characterization (6). In particular, the late gadolinium enhancement (LGE) technique allows visualization of regions of myocardial injury due to cardiac sarcoidosis (7). These are most commonly observed in a noncoronary distribution and associated with an adverse prognosis (8,9). However, LGE cannot differentiate between active disease and chronic scarring.
18F-Fluorodeoxyglucose (FDG) is a PET tracer and glucose analogue that is widely used to assess cardiovascular inflammation. Focal increases in myocardial FDG uptake suggest aCS (10,11) and provide important patient risk stratification (12). However, glucose is also the predominant energy source of the myocardium, so that physiological FDG tracer uptake is observed frequently. Although myocardial uptake can be suppressed using dietary restrictions, this strategy is ineffective in approximately one-quarter of patients leading to the potential for false-positive results (13).
In this study, we aimed to assess whether hybrid CMR/PET might incorporate the advantages of both imaging techniques within a single scan and allow precise co-registration of LGE CMR and FDG PET images (14). Moreover, we investigated whether CMR/PET might differentiate active from inactive myocardial disease, better identify false-positive FDG uptake, and aid the clinical diagnosis of aCS.
METHODS
PATIENT POPULATION
Patients with clinical suspicion of aCS due to established extracardiac involvement and/or clinical presentation suggestive of the disease (5) were recruited at Mount Sinai Hospital, New York. This study was approved by our Institutional Review Board (GCO#01-1032) and all patients gave written informed consent. Exclusion criteria included insulin-dependent diabetes mellitus, blood sugar >200 mmol/dl before scanning, claustrophobia, pregnancy/nursing, presence of pacemaker or automatic implantable cardioverter-defibrillator, and impaired renal function (estimated glomerular filtration rate <45 ml/min/1.73 m2).
Control group
Patients with normal healthy myocardium were analyzed to assess physiological cardiac FDG uptake. This population comprised 19 patients (age 70 ± 8 years; 65% male) recruited into a recent FDG computed tomography (CT)/PET study (15) with normal cardiac appearance and function on echocardiography, normal electrocardiograph, and no history or clinical suspicion of inflammatory myocardial disease or recent myocardial infarction. They underwent CT/PET imaging (Biograph-mCT, Siemens, Erlangen, Germany) after administration of 200 MBq FDG and avoided carbohydrate for 24 h and fasted for 12 h before scanning. Myocardial uptake was categorized as absent (successful suppression), diffuse (affecting the whole left ventricular myocardium suggesting unsuccessful suppression), focal, or focal on diffuse (11). CT/PET imaging was chosen for this control group so that we could be confident that any myocardial uptake did not reflect attenuation correction artifact from the CMR/PET scanner.
SCANNING PROTOCOL
Each patient with suspected cardiac sarcoidosis underwent simultaneous CMR with LGE and FDG PET cardiac imaging on a hybrid CMR/PET system (Biograph-mMR, Siemens) (Online Appendix).
PET imaging
PET imaging was performed according to recent recommendations (10) using the same dietary preparation as described. Patients were injected intravenously with approximately 5 MBq/kg of FDG (a slightly higher dose than in the control group because the CMR/PET scanner lacks time-of-flight technology). Ten minutes later, dynamic thoracic field PET acquisition (Listmode, one bed position centered on heart) was started with data acquired for a further 90 min. Initially, Listmode data from between 40 and 100 min after injection were binned into a single, static time frame for both visual and quantitative PET analyses. Later, all acquired List-mode data were histogrammed into multiple dynamic frames for quantitative dynamic Patlak analysis.
CMR sequences
CMR was performed simultaneously and included balanced steady-state free-precession (trueFISP) cine images (2-chamber, 4-chamber, and complete short axis stack) and short axis T2 mapping (Siemens-WIP448B). Electrocardiograph-triggered, inversion-recovery fast gradient-echo LGE sequences were acquired 0 to 15 min after 0.2 mmol/kg gadolinium injection (Multihance, Bracco Imaging, Milan, Italy). Inversion times were optimized to null normal myocardium with images repeated in 2 phase-encoding directions to exclude artifacts.
CMR ANALYSIS
Quantification of left ventricular and right ventricular function, volumes and mass was performed using dedicated software (CMR-tools, Cardiovascular Imaging Solutions, London, United Kingdom). Mass and volumes were indexed to body surface area, age, and sex, and considered abnormal if >95th percentile. In each myocardial segment, wall thickness was measured and motion graded as normal, hypokinetic or akinetic. The presence and pattern of myocardial LGE (subendocardial, midwall, subepicardial, transmural) and whether this was characteristic of cardiac sarcoidosis were determined by 2 experienced operators (M.R.D., M.T.).
VISUAL PET ANALYSIS
Each scan was assessed systematically for extracardiac disease in the thoracic field (Online Appendix). Analysis of myocardial FDG uptake on fused CMR/PET datasets was performed using OsiriX-Lite software (OsiriX-imaging, Geneva, Switzerland). First, small adjustments were made to achieve accurate co-registration in 3 dimensions between the CMR and PET scans using fiducial markers. Co-registered short axis hybrid FDG PET and CMR LGE images were then assessed and patients categorized into the following 4 groups: 1) magnetic resonance (MR)+PET+ when a characteristic pattern of LGE aligned exactly with increased focal FDG uptake (Figure 1) (this was felt highly likely to represent aCS, given corroborative evidence on 2 different imaging modalities); 2) MR+PET−, defined by characteristic LGE but no increased FDG (this was felt likely to represent inactive cardiac sarcoidosis with residual scar) (Figure 2A) (16); 3) MR−PET− if there was neither characteristic LGE nor increased FDG to support an imaging diagnosis of cardiac sarcoidosis; and 4) MR−PET+ if there was increased FDG uptake in the absence of underlying LGE. The MR−PET+ group was investigated in greater detail to define if increased PET uptake represented failed myocardial suppression (false-positive FDG), or was truly related to myocardial inflammation (true-positive FDG).
FIGURE 1. MR+PET+ Patients With Imaging Evidence of aCS on Hybrid CMR/PET.
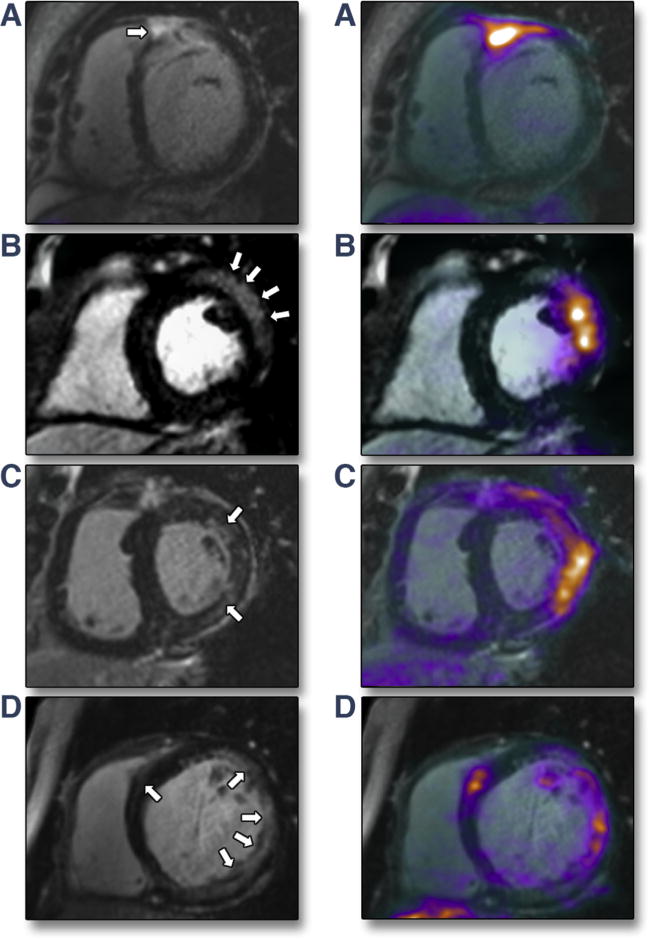
Late gadolinium enhancement (LGE) cardiac magnetic resonance (CMR) images on the left with hybrid 18F-fluorodeoxyglucose (FDG) CMR/positron emission tomography (PET) images on the right. (A) Subepicardial (near transmural) LGE in the basal anteroseptum extending in to the right ventricular free wall with increased FDG uptake localizing to exactly the same region on fused CMR/PET (maximum standardized uptake value = 3.4; maximum tissue-to-background ratio = 2.3; maximum target-to-normal myocardium ratio = 2.0). (B) Subepicardial LGE in the basal anterolateral wall with increased FDG uptake co-localizing to exactly that region on CMR/PET. (C) Patchy midwall LGE in the anterolateral wall with matched increased FDG uptake on CMR/PET. (D) Multifocal LGE in the lateral wall with matched increased FDG uptake on CMR/PET.
FIGURE 2. Patients Without Imaging Evidence of aCS on Hybrid CMR/PET.
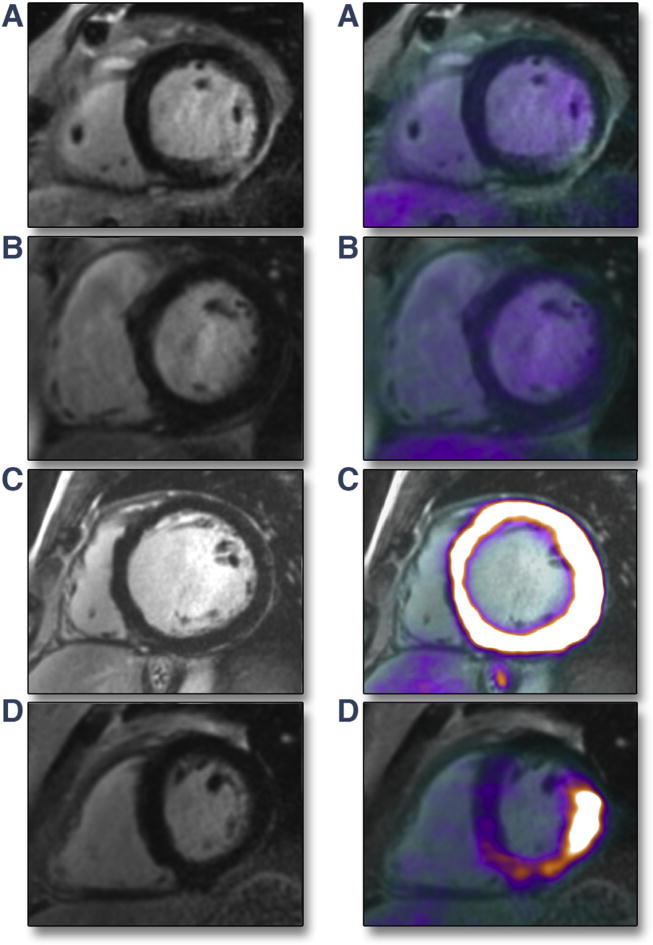
(A) MR+PET−. Transmural LGE inferolaterally in a patient with biopsy-proven sarcoidosis but with no evidence of increased FDG PET uptake in this region. This pattern suggests inactive cardiac sarcoidosis with residual myocardial scar. (B) MR−PET−. Normal appearances on LGE scan and no increased FDG uptake on hybrid CMR/PET. (C) MR−PET+ (generalized). No myocardial injury on LGE, but generalized hyperintense FDG uptake throughout entire myocardium (maximum standardized uptake value [SUVmax] = 20.6), indicating failed myocardial suppression. (D) MR−PET+ (focal-on-diffuse uptake). No myocardial injury on LGE, but intense focal-on-diffuse FDG uptake in inferolateral wall (SUVmax = 7.7). This was the only example in this study where target-to-normal myocardium ratio (TNMR) values did not agree with the visual categorization (TNMRmax = 1.4). aCS = active cardiac sarcoidosis; other abbreviations as in Figure 1.
Detailed assessment of MR−PET+ patients
MR−PET+ patients were further subdivided according to their pattern of increased FDG uptake: those with focal or focal-on-diffuse FDG uptake versus patients with diffuse uptake affecting the entire left ventricle (10). We considered the diffuse pattern more likely to represent false-positive activity (given the focal nature of cardiac sarcoidosis), although false-positive focal and focal-on-diffuse patterns have also been reported, particularly when these localize to the lateral wall (10). PET imaging in the MR−PET+ group was then compared with true-positive uptake in MR+PET+ patients and false-positive uptake in control subjects. Patients were further categorized and analyzed as aCS+ (MR+PET+) or aCS (MR+PET−, MR−PET−, MR−PET+).
QUANTIFICATION OF MYOCARDIAL FDG ACTIVITY
PET quantification was performed on fused short axis LGE CMR and FDG PET datasets by an experienced nuclear medicine physician (R.A.) (Figure 3). Different approaches were explored.
FIGURE 3. Quantification of Myocardial FDG Uptake on Static CMR/PET Images.
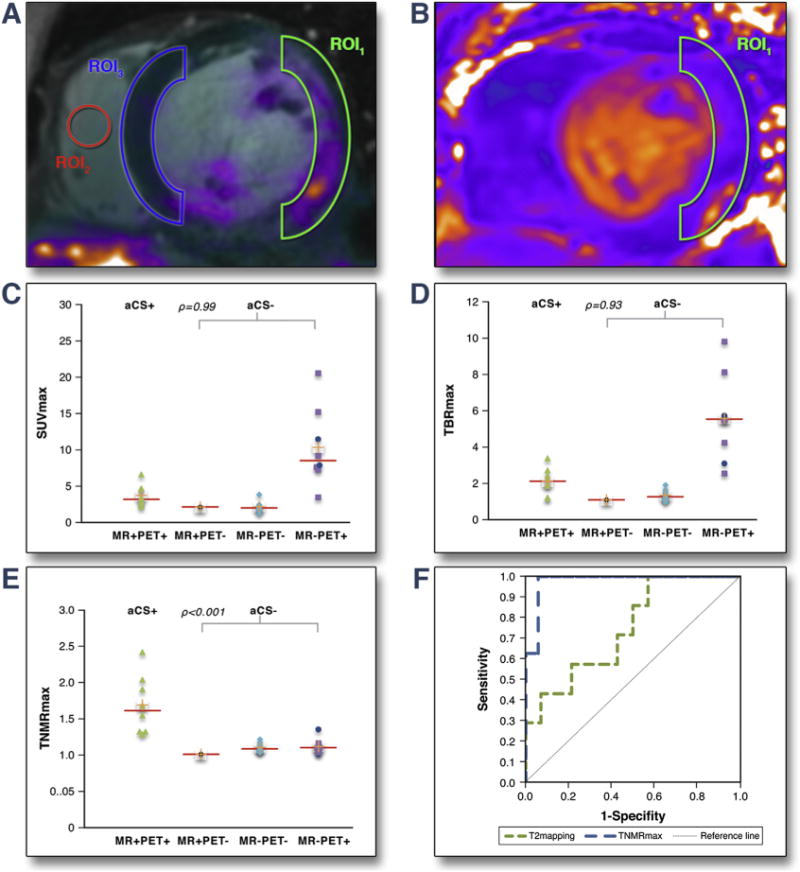
(A, B) Different methods for quantifying myocardial FDG uptake. (A) Maximum standardized uptake value (SUVmax) (maximal SUV in region of interest 1 [ROI1], drawn around characteristic LGE if present), maximum tissue-to-background ratio (TBRmax) (SUVmax in ROI1 corrected for blood pool uptake measured in ROI2) and TNMRmax (SUVmax in ROI1 corrected for background myocardial uptake in contralateral LGE-segment, ROI3). (B) Mean relaxation–time value (T2 mapping) in ROI1 on T2 parametric images. (C to F) Scattergrams of imaging parameters in MR+PET+ (aCS+); MR+PET−, MR−PET−, MR−PET+ (all aCS−) groups. (C) SUVmax, (D) TBRmax, (E) TNMRmax (focal-on-diffuse uptake represented by blue points). (F) Receiver-operating characteristic curves analysis to predict aCS+ patients using: TNMRmax (area under the curve = 0.98) and T2 mapping (area under the curve = 0.75). Abbreviations as in Figures 1 and 2.
Standard uptake values
Regions of interest 1 were drawn around areas of maximal myocardial FDG uptake and mean standard uptake values (SUV) and maximum SUV (SUVmax) were calculated. These same regions of interest were copied on to corresponding short axis T2 maps to calculate mean relaxation times.
Tissue-to-background ratio
SUV values were corrected for blood pool activity measured in the right ventricle. The mean target-to-normal myocardium ratio (TNMR) and maximum TNMR (TNMRmax) SUV values were corrected for background myocardial FDG uptake measured in a contralateral myocardial segment without LGE. In the control patients myocardial SUV, mean tissue-to-background ratio (TBR), maximum TBR (TBRmax), and TNMR values were also calculated using fused CT/PET datasets. Maximum values were used in preference to mean values due to the difficulties in drawing consistent regions of interest.
The methodology for dynamic PET analysis is described in detail in the Online Appendix. In brief, time–activity curves were assessed in the myocardium and blood pool. The collected dynamic PET measurements were subsequently fitted to the standard Patlak model for graphical linear analysis to quantitatively estimate the net metabolic FDG uptake rate (Ki) in the myocardium. This parameter is related to the slope of the time–activity curves, but also takes into account FDG activity in the blood (17).
STATISTICS
Descriptive statistics were used to characterize the study cohort. Continuous variables were summarized as mean ± SD when normally distributed or otherwise as median with interquartile range (IQR). Categorical variables were presented as n (%).
The Fisher exact and Mann-Whitney U tests were used to make comparisons between groups as appropriate. Receiver-operating characteristic curve analysis was performed and area under the curve reported. The sensitivity, specificity, positive predictive value, and negative predictive value for various thresholds in myocardial PET uptake were calculated. The Youden index was used to determine the optimal PET threshold that differentiates aCS+ and aCS− patients. Correlation analysis for imaging parameters was also performed in the aCS+ group only. Dynamic Ki values for MR−PET+ patients were compared against those of MR+PET+ subjects. All analyses were conducted at the 0.05 significance level using XLStat software (Addinsoft, Paris, France).
RESULTS
PATIENT DEMOGRAPHICS
Twenty-five consecutive patients with suspected aCS (age 55 ± 10 years; 48% male) were included from August 2015 to April 2016. Eighteen patients had a proven diagnosis of sarcoidosis on biopsy of extracardiac tissue. Seven patients had no previous history of histologically proven sarcoid, but were felt to have a high likelihood of cardiac sarcoidosis based on clinical presentation, imaging findings, and electrocardiographic abnormalities. We observed a reduction in left ventricular ejection fraction in 6 patients, and a reduction in right ventricular ejection fraction in 5 patients (Tables 1 and 2).
Table 1.
Demographics of Patients With Suspected Active Cardiac Sarcoidosis and Control Patients
| Suspected Active Cardiac Sarcoidosis (n = 25) |
Control Subjects (n = 19) |
|
|---|---|---|
| Age, yrs | 55.0 ± 10.0 | 70.0 ± 8.0 |
|
| ||
| Male/female | 12/13 | 12/7 |
|
| ||
| Ethnicity | ||
| White | 14 (56) | 19 (100) |
| Black/African-American | 7 (28) | – |
| Asian | 1 (4) | – |
| Hispanic/Latino | 3 (12) | – |
|
| ||
| Body mass index, kg/m2 | 30.2 ± 5.6 | 26.0 ± 2.9 |
|
| ||
| Systolic BP, mm Hg | 124.8 ± 16.1 | 132.0 ± 15.0 |
|
| ||
| Diastolic BP, mm Hg | 80.0 ± 11.5 | 79.0 ± 11.0 |
|
| ||
| Established coronary artery disease | 4 (16) | 7 (35) |
|
| ||
| Smoking habit | 8 (32) | 2 (11) |
|
| ||
| Hypertension | 15 (60) | 8 (42) |
|
| ||
| Diabetes mellitus | 5 (20) | 2 (11) |
|
| ||
| Dyslipidemia | 5 (20) | 5 (26) |
|
| ||
| Medication use | ||
| Corticosteroid | 10 (40) | 0 (0) |
| Immunosuppressive | 7 (28) | 0 (0) |
| Beta-blocker | 11 (44) | 8 (42) |
| ACE inhibitor | 7 (28) | 7 (37) |
| Angiotensin II receptor blockers | 3 (12) | 0 (0) |
Values are mean ± SD, n, or n (%).
ACE = angiotensin-converting enzyme; BP = blood pressure.
Table 2.
Findings in Patients With Suspected Active Cardiac Sarcoidosis
| Patient # | Age, yrs | Sex | Medication | Biopsy Proven | Symptoms | ECG | BNP, pg/ml | Obstructive CAD on Angiography or Stress Testing | BMI, kg/m2 | EDV Index | ESV Index |
|---|---|---|---|---|---|---|---|---|---|---|---|
| MR+ PET+ | |||||||||||
| 2 | 52 | M | CST | + (EC) | CHF, dyspnea | LBBB | 88 | × | 121 | 146 | 95 |
| 4 | 25 | F | – | Palpitations, syncope, dyspnea† | 86 | N/A | 47 | 82 | 31 | ||
| 6 | 62 | M | CST, IS | + (EC) | Dyspnea† | 860 | × | 71 | 44 | 24 | |
| 10 | 60 | M | – | – | LBBB | 19 | × | 93 | 82 | 39 | |
| 15 | 47 | F | – | + | – | 36 | N/A | 53 | 69 | 17 | |
| 18 | 56 | F | CST, IS | + (EC) | Dyspnea† | N/A | × | 24 | 57 | 19 | |
| 23 | 63 | F | – | CHF, dyspnea† | LBBB | 910 | × | 82 | 132 | 103 | |
| 24 | 64 | F | – | Syncope† | N/A | N/A | 24 | 59 | 20 | ||
|
| |||||||||||
| MR+PET− | |||||||||||
| 12 | 65 | M | – | + (EC) | Dyspnea | RBBB | 29 | × | 115 | 97 | 49 |
|
| |||||||||||
| MR−PET− | |||||||||||
| 3 | 60 | M | CST | + (EC) | Dyspnea | 80 | ✓ | 81 | 82 | 38 | |
| 5 | 50 | F | IS | + (EC) | Dyspnea | 37 | N/A | 35 | 46 | 19 | |
| 7 | 62 | F | – | + (EC) | Palpitations, dyspnea | 24 | × | 59 | 70 | 20 | |
| 8 | 50 | F | – | Palpitations, dyspnea | N/A | ✓ | 67 | 79 | 36 | ||
| 9 | 43 | F | – | + (EC) | – | N/A | N/A | 71 | 85 | 38 | |
| 16 | 54 | M | – | + (EC) | Dyspnea | N/A | N/A | N/A | N/A | N/A | |
| 22 | 59 | F | CST | + (EC) | Dyspnea | 21 | × | 42 | 51 | 17 | |
| 25 | 53 | F | CST, IS | + (EC) | Palpitations, dyspnea | 49 | ✓ | 20 | 49 | 16 | |
|
| |||||||||||
| MR−PET+ | |||||||||||
| 1 | 61 | M | – | – | Palpitations, dyspnea† | RBBB | N/A | × | 62 | 70 | 37 |
| 11 | 75 | M | CST, IS | + (EC) | Dyspnea | RBBB | 146 | × | 56 | 70 | 29 |
| 13 | 46 | M | – | + (EC) | Dyspnea | 7 | ✓ | 61 | 63 | 23 | |
| 14 | 42 | M | – | Dyspnea | N/A | × | 109 | 188 | 136 | ||
| 19 | 53 | F | CST, IS | + (EC) | Dyspnea | LBBB | 10 | × | 71 | 84 | 12 |
| 20 | 55 | F | CST, IS | + (EC) | Dyspnea | RBBB | 38 | × | 62 | 98 | 47 |
| 17* | 57 | M | CST | + (EC) | Dyspnea | 41 | N/A | 96 | 96 | 31 | |
| 21* | 59 | M | – | + (EC) | Dyspnea | 21 | N/A | 55 | 49 | 12 | |
| 35 | 0.9 | 52 | +(HK) | MW | 24.7 | 3.0 | 2.0 | 1.5 | 70 | LN, lung‡ | |
| 62 | 0.8 | 50 | MW | 13.2 | 2.7 | 1.9 | 1.3 | 64 | LN | ||
| 46 | 0.9 | 41 | +(HK) | MW | 25.8 | 6.6 | 3.4 | 2.4 | N/A | Lung | |
| 53 | 0.8 | 64 | SEP | 5.0 | 4.6 | 2.4 | 1.9 | 63 | |||
| 75 | 0.8 | 60 | MW | 2.4 | 2.2 | 1.2 | 1.3 | 66 | LN, Lung, liver‡ | ||
| 66 | 0.7 | 60 | MW | 2.0 | 2.7 | 1.3 | 1.3 | 72 | LN, lung | ||
| 22 | 0.9 | 26 | +(HK) | TM | 15.8 | 3.4 | 2.3 | 2.0 | 61 | ||
| 66 | 0.7 | 59 | SEN | 4.3 | 4.7 | 2.7 | 1.7 | 67 | |||
|
| |||||||||||
| 50 | 1.1 | 25 | +(HK) | TM | 17.8 | 2.2 | 1.1 | 1.0 | 67 | LN, lung | Old scar of CS |
|
| |||||||||||
| 54 | 0.9 | 51 | 0 | 2.5 | 1.1 | 1.1 | 60 | Lung‡ | |||
| 59 | 0.9 | 52 | 0 | 1.7 | 1.9 | 1.1 | 58 | Lung, bone‡ | |||
| 71 | 0.7 | 65 | 0 | 2.4 | 1.5 | 1.1 | N/A | LN,‡ lung | |||
| 55 | 0.8 | 65 | +(AK) | TM | 17.5 | 1.2 | 1.0 | 1.0 | 59 | Chronic MI (ASA) | |
| 56 | 0.8 | 62 | 0 | 3.8 | 1.4 | 1.2 | 59 | Lung | AV fibroelastoma | ||
| N/A | 1.1 | 52 | 1.8 | 1.2 | 1.2 | 68 | LN | ||||
| 67 | 0.9 | 57 | 0 | 2.0 | 1.7 | 1.1 | N/A | LN, lung‡ | |||
| 66 | 0.9 | 56 | 0 | 2.0 | 1.2 | 1.0 | 59 | Brain | Anomalous coronary origin | ||
|
| |||||||||||
| 47 | 0.7 | 24 | +(HK) | 0 | 3.5 | 2.6 | 1.0 | N/A | – | ARVC | |
| 58 | 0.9 | 50 | N/A | 0 | 7.9 | 4.3 | 1.0 | 60 | LN, liver, lung | ||
| 64 | 0.8 | 60 | 0 | 20.6 | 9.8 | 1.1 | 61 | Lung, neuro‡ | |||
| 28 | 0.8 | 55 | +(HK) | 0 | 7.3 | 5.5 | 1.1 | 67 | – | ||
| 86 | 0.8 | 70 | 0 | 9.2 | 5.6 | 1.2 | 64 | Lung, skin | |||
| 52 | 0.7 | 54 | 0 | 15.2 | 8.1 | 1.1 | 65 | Lung | Anomalous coronary origin | ||
| 67 | 1.1 | 61 | 0 | 11.5 | 5.8 | 1.0 | 63 | LN, lung | |||
| 75 | 1.1 | 64 | 0 | 7.6 | 3.1 | 1.3 | 64 | Lung | |||
Partial myocardial suppression with regional increases in myocardial 18F-fluorodeoxyglucose uptake.
Acute presentation.
Active extracardiac sarcoidosis involvement on CMR/PET. X indicates absent, check mark indicates present.
AK = akinetic; ARVC = arrhythmogenic right ventricular cardiomyopathy; ASA = anteroseptoapical; AV = atrioventricular; BMI = body mass index; BNP = brain natriuretic peptide; CAD = coronary artery disease; CHF = clinical heart failure; CS = cardiac sarcoidosis; CST = corticosteroid; EC = extracardiac; ECG = electrocardiograph; EDV = end-diastolicvolume; ESV = end-systolicvolume; HK = hypokinetic; IS = immunosuppressive; LBBB = leftbundlebranch block; LGE = lategadoliniumenhancement; LN = lymph nodes; LV = leftventricular; LVEF = leftventricularejection fraction; MI = myocardialinfarction; MR = magnetic resonance; MW = midwall; N/A = not applicable; PET = positron emission tomography; RBBB = right bundle branch block; RV = right ventricular; RVEF = right ventricular ejection fraction; SEP = subepicardial; SUVmax = maximum standardized uptake value; T2map = mean relaxation-time value; TBRmax = maximum tissue-to-background ratio; TM = transmural; TNMRmax = maximum target-to-normal-myocardium ratio; SEN = subendocardial.
Average radiation exposure for each CMR/PET scan was 8.2 ± 1.5 mSv (conversion factor: 0.019 mSv/MBq). This compares with the 12.3 ± 1.6 mSv associated with recent clinical FDG CT/PET studies performed in these same patients who often also underwent clinical Tc99m-sestamibi single-photon emission PET for myocardial scar assessment.
CATEGORIZATION INTO 4 CMR/PET GROUPS
Regions of LGE+ characteristic of myocardial sarcoid involvement were observed in 9 patients (n = 1 subendocardial, n = 5 midwall, n = 1 subepicardial, n = 2 transmural) and also extending to the right ventricle in 1 subject. Another patient had subendocardial LGE that conformed with the distribution of the left anterior descending artery and was felt to represent an anterior myocardial infarction rather than cardiac sarcoidosis (there was no FDG activity in this region consistent with an old infarct) (Online Figure 1).
Among the 9 patients with characteristic sarcoid LGE, assessment of hybrid FDG CMR/PET demonstrated increased PET uptake co-localizing exactly with the pattern of LGE in 8 subjects (Figure 1) (SUVmax 3.2 [IQR: 2.7 to 4.6]; TBRmax 2.1 [IQR: 1.7 to 2.5]) (Table 3). These patients were categorized as being MR+PET+ (aCS+).
Table 3.
Quantitative CMR/PET Parameters
| aCS−
|
||||||
|---|---|---|---|---|---|---|
| aCS+MR+PET+ (n = 8) |
MR+PET− (n = 1) |
MR−PET− (n = 8) |
MR-PET+ (n = 8)
|
|||
| All Patterns | Diffuse | Focal-on-Diffuse | ||||
| PET
| ||||||
| SUVmax | 3.2 (2.7-4.6) | 2.2 | 2.0 (1.8-2.4) | 8.5 (7.6-12.4) | 8.5 (7.4-13.7) | 9.6 (8.6-10.5) |
| SUVmean | 2.3 (2.2-3.2) | 1.7 | 1.6 (1.3-1.9) | 5.7 (5.0-8.7) | 5.7 (4.7-10.4) | 6.5 (5.9-7.1) |
| TBRmax | 2.1 (1.7-2.5) | 1.1 | 1.3 (1.2-1.5) | 5.6 (4.0-6.4) | 5.6 (4.6-7.5) | 4.4 (3.8-5.1) |
| TBRmean | 1.5 (1.4-1.8) | 0.9 | 1.0 (0.9-1.1) | 3.3 (2.9-4.3) | 4.0 (3.2-5.1) | 3.0 (2.6-3.4) |
| TNMRmax | 1.6 (1.3-1.9) | 1.0 | 1.1 (1.1-1.1) | 1.1 (1.0-1.1) | 1.1 (1.1-1.1) | 1.2 (1.1-1.3) |
| TNMRmean | 1.4 (1.4-1.8) | 0.9 | 1.1 (1.0-1.2) | 1.0 (1.0-1.0) | 1.0 (1.0-1.0) | 1.0 (1.0-1.1) |
|
MRI | ||||||
| T2map (ms) | 67.0 (63.5-69.2) | 67.0 | 59.8 (58.1-60.7) | 64.4 (62.3-65.0) | 64.4 (61.6-65.2) | 63.9 (63.5-64.3) |
Values are median (interquartile range).
aCS = active cardiac sarcoidosis; aCS+ = MR+PET+; aCS− = MR+PET−, MR−PET−, MR−PET+; SUVmean = mean standardized uptake value; TBRmean = mean tissue-to- background ratio; TNMRmean = mean target-to-normal-myocardium ratio; other abbreviations as in Table 2.
Of the remaining 17 patients, 1 had characteristic LGE but no increase in FDG uptake (MR+PET−). A diagnosis of sarcoidosis had been made on extracardiac biopsy 10 years previously and the patient was clinically stable, which is consistent with inactive cardiac sarcoidosis with residual myocardial scar in a noncoronary distribution (Figure 2A). Eight patients had neither characteristic LGE nor increased FDG activity (MR−PET−) and were therefore not felt to have imaging evidence of cardiac sarcoidosis (Figure 2B). Myocardial FDG uptake was lower in the MR+PET− and MR−PET− groups than in the MR+PET+ patients, with TNMRmax values providing the clearest discrimination (Figure 3). Finally, 8 patients had increased myocardial FDG PET activity in the absence of any changes on CMR LGE (MR−PET+). They were assessed in further detail and comparisons made with a control population in whom a normal myocardium was assumed.
FURTHER ASSESSMENT OF MR−PET+ AND CONTROL PATIENTS
Eleven of 19 control subjects (58%) had hyperintense myocardial FDG uptake, representative of false-positive uptake. The pattern was diffuse across the entire myocardium in 9 and focal-on-diffuse in 2 (Online Figure 2).
Similarly, in the MR−PET+ subjects, 6 of 8 had diffuse, high-intensity uptake throughout the entire myocardium consistent with failed myocardial suppression (Figure 2C). In 2 patients, this uptake extended globally in to the right ventriculum. Intensity was double in this group than in MR+PET+ subjects (SUVmax 8.5 [IQR: 7.4 to 13.7] vs. 3.2 [IQR: 2.7 to 4.6], p = 0.008; TBRmax 5.6 [IQR: 4.6 to 7.5] vs. 2.1 [IQR: 1.7 to 2.5], p = 0.006). Dynamic time-activity curves were also different with the MR+PET+ patients, demonstrating a plateau in myocardial FDG activity by 60 min after injection, whereas the diffuse MR−PET+ patients demonstrated a persistent increase in activity that continued out to 70 min and beyond (Figure 4A). Finally, Patlak analysis demonstrated higher Ki net uptake rates in the diffuse MR−PET+ subjects versus the MR+PET+ group (Ki: 0.025 [0.019 to 0.031] vs. 0.009 [0.008 to 0.012]; p = 0.006) (Figure 4B).
FIGURE 4. Dynamic FDG PET Analysis for MR+PET+ and MR−PET+Subjects.
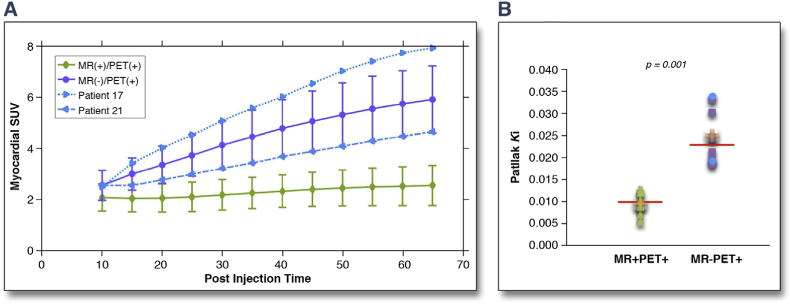
(A) Myocardial FDG PET time–SUV curves, averaged over the MR+PET+ and MR PET+ subjects, including the 2 MR−PET+ cases with focal-on-diffuse FDG uptake (blue dots). (B) FDG net uptake rate (Ki), for MR+PET+ and MR−PET+ subject groups using quantitative Patlak analysis (focal-on-diffuse patients blue dots; p = 0.006 when removing them from statistical analysis). Abbreviations as in Figures 1 and 2.
Two MR−PET+ patients demonstrated a focal-on-diffuse FDG uptake pattern (Figure 2D). Uptake in these regions was again hyperintense (SUVmax values of 11.5 and 7.6), with maximal uptake localizing to the inferolateral wall in both cases. Patlak analysis Ki values and time activity curves were more consistent with the diffuse MR−PET+ patients (false-positive) rather than the MR+PET+ (true-positive) subjects (Figure 4). Given that this hyperintense focal-on-diffuse PET uptake localizing to the infero-lateral wall was also observed in control patients (Online Figure 2), we felt in these particular patients that it most likely represented another form of false-positive uptake due to failed suppression. We recognize that in other patients it might represent true myocardial inflammatory activity that is either beyond the resolution of CMR or that, for other reasons, remains MR−. On this basis each of our MR−PET+ patients were categorized as aCS− along-side the MR−PET− and MR+PET− patients in subsequent analyses.
COMPARISON OF aCS+ AND aCS− PATIENTS ON CMR/PET
The characteristics of patients in the aCS+ and aCS groups are summarized in Table 4. There was no difference in symptoms, ejection fraction, the presence or absence of active extracardiac sarcoidosis or white blood cell count. However cardiac-specific markers of disease activity were higher in the aCS+ compared with the aCS− group, although these differences were not significant (BNP: 87 pg/ml [IQR: 49 to 667 pg/ml] vs. 33 pg/ml [IQR: 21 to 43 pg/ml]; p = 0.10; T2 mapping: 67.0 ms [IQR: 63.5 to 69.2 ms] vs. 62.3 ms [IQR: 60.0 to 65.1 ms]; p = 0.11) (Table 4). In MR+PET+ patients, a positive correlation between T2 mapping and the TNMR values was observed, although this again was not significant (r = 0.62; p = 0.14).
Table 4.
Comparison of Clinical, Biological, and Imaging Results in aCS+ and aCS− Patients
| aCS+ (n = 8) | aCS− (n = 17) | p Value | |
|---|---|---|---|
| Symptoms | |||
| Syncope | 2 (25) | 0 (0) | 0.09 |
| Palpitations | 1 (13) | 4 (24) | 0.48 |
| Dyspnea | 5 (63) | 16 (94) | 0.08 |
| Clinical heart failure | 2 (25) | 1 (6) | 0.23 |
|
| |||
| Blood markers | |||
| BNP, pg/ml | 87 (48.5-667.0) | 33 (21-43) | 0.10 |
| WBC | 7.4 (5.8-8.2) | 6.8 (6.2-8.3) | 0.93 |
|
| |||
| ECG abnormalities | |||
| Heart block | 3 (38) | 5 (29) | 0.99 |
| Extracardiac PET findings | |||
| Positive | 4 (50) | 10 (59) | 0.99 |
|
| |||
| CMR/PET quantification | |||
| SUVmax | 3.2 (2.7-4.6) | 3.5 (2.0-7.9) | 0.99* |
| SUVmean | 2.3 (2.2-3.2) | 2.7 (1.7-5.5) | 0.43* |
| TBRmax | 2.1 (1.7-2.5) | 1.9 (1.2-5.5) | 0.93* |
| TBRmean | 1.5 (1.4-1.8) | 1.2 (1.0-3.3) | 0.99* |
| TNMRmax | 1.6 (1.3-1.9) | 1.1 (1.0-1.1) | <0.001* |
| TNMRmean | 1.4 (1.4-1.8) | 1.0 (1.0-1.1) | <0.001* |
| T2map, ms | 67.0 (63.5-69.2) | 62.3 (60.0-65.1) | 0.11 |
|
| |||
| Cine CMR analysis | |||
| LV mass/BSA, g/m2 | 62 (41-85) | 62 (54-74) | 0.92 |
| EDV/BSA, ml/m2 | 76 (59-95) | 75 (60-88) | 0.93 |
| ESV/BSA, ml/m2 | 28 (20-53) | 30 (19-38) | 0.65 |
| LVEF, % | 58 (43-66) | 57 (54-67) | 0.43 |
| Wall thickness, mm | 0.8 (0.8-0.9) | 0.9 (0.8-0.9) | 0.32 |
| Wall motion abnormalities | 3 (38) | 2 (12) | 0.28 |
| %LGE | 9 (4-18) | 0 (0-0) | <0.001 |
| RVEF, % | 56 (48-60) | 56 (52-62) | 0.50 |
|
| |||
| Follow-up | |||
| AICD for cardiac sarcoidosis | 2 (25) | 0 (0) | 0.09 |
We next assessed the ability of each PET quantification method to differentiate between patients with and without aCS as categorized on initial visual assessment (Table 3). FDG SUVmax and TBRmax values were not increased in aCS+ versus aCS− patients (SUVmax: 3.2 [IQR: 2.7 to 4.6] vs. 3.5 [IQR: 2.0 to 7.9], respectively [p = 1.00]; TBRmax: 2.1 [IQR: 1.7 to 2.5] vs. 1.9 [IQR: 1.2 to 5.5], respectively [p = 0.93]), primarily because of high uptake in the MR−PET+ group (Figure 3). However, after correction for background myocardial FDG uptake, TNMR values were 50% higher in aCS+ versus aCS− patients (TNMRmax: 1.6 [IQR: 1.3 to 1.9] vs. 1.1 [IQR: 1.0 to 1.1], respectively [p < 0.001]) (Figure 3). TNMRmax demonstrated an area under the curve of 0.98 on receiver-operating characteristic analysis for the identification of aCS+ patients. The optimal TNMRmax threshold, using the Youden index, was 1.2 with a sensitivity of 100%, specificity of 94%, Youden index of 0.94, positive predictive value of 89%, and negative predictive value of 100%. This discrimination outperformed T2 mapping, which demonstrated an area under the curve of 0.75 to predict aCS+. The optimal T2 mapping threshold using the Youden method was 61 ms with a sensitivity of 100%, specificity of 43%, Youden index of 0.43, positive predictive value 45%, and negative predictive value of 100% (Figure 3).
DISCUSSION
We provide the first prospective study to investigate hybrid CMR/PET in cardiac sarcoidosis. We demonstrate that this imaging modality can provide comprehensive assessments of myocardial function, the pattern of injury, and disease activity in a single co-registered scan, as well as information about extracardiac disease, with important potential implications for patient diagnosis and management (18). Using this information, patients with suspected cardiac sarcoidosis can be categorized into 4 groups. MR+PET+ patients (n = 8) had increased FDG activity co-localizing precisely with the pattern of injury on LGE, providing strong evidence of aCS. By contrast, at least in the patients studied here, MR+PET−, MR−PET−, and MR−PET+ subjects were not considered to have evidence of active myocardial sarcoidosis. Static and dynamic PET quantification supported our visual categorization, indicating that CMR/PET can aid in the diagnosis of aCS, removing the need for 2 separate scans, helping with image interpretation, and improving patient assessment.
Frequently, aCS is subclinical, but it is important to detect because of its adverse prognosis and because, when identified, anti-inflammatory therapy is generally recommended (1,5). Both CMR and FDG PET are used in clinical practice (6,7) to assess at-risk patients (8,12), but the images are frequently interpreted in isolation due to the considerable difficulties in co-registering 2 independent scans. This makes for poor use of the complementary information that they provide and wastes health care resources. In this study, we performed simultaneous CMR/PET imaging in an attempt to not only improve diagnostic accuracy, but also to improve the efficiency of patient assessment, reduce radiation exposure, and provide a unified approach to the diagnosis of aCS.
Simultaneous acquisition allows accurate coregistration of PET and CMR images so that patterns of injury identified on LGE CMR can be compared precisely with regions of increased disease activity identified on FDG PET. In approximately one-third of our patients, increased FDG uptake co-localized perfectly with the pattern of myocardial LGE (MR+PET+). In our opinion, this spatial co-localization provides compelling dual modality evidence to support a diagnosis of aCS (aCS+). This categorization was closely supported by PET quantification using the novel TNMR approach. TNMRmax values were higher in MR+PET+ patients compared with the other groups, with values of $1.2 proving highly accurate (Youden index: 0.94) in identifying these patients. The TNMR approach is particularly useful because it corrects for background FDG uptake and, therefore, adjusts for hyperintense, generalized uptake observed in most cases of failed myocardial suppression. In clinical practice, visual assessments can therefore be supported by quantitative measures, providing greater certainty in the diagnosis of aCS.
In another one-third of these patients, there was no imaging evidence of cardiac sarcoid involvement on either the CMR or PET scans (MR−PET−), making aCS unlikely, or at the very least, below the limits of detection. Only 1 patient had evidence of characteristic LGE in the absence of increased FDG uptake (MR+PET−). This pattern suggested inactive cardiac sarcoid with residual myocardial scarring, consistent with the patient’s clinical history and biopsy data.
Eight patients had evidence of increased FDG PET activity but a normal LGE CMR scan (MR−PET+). In 6 of 8 patients, there was high-intensity FDG uptake throughout the entire left ventricular myocardium. This pattern is not consistent with the focal nature of cardiac sarcoidosis, was observed in 47% of our control patients, and is widely considered to represent failed myocardial suppression and physiological uptake of FDG by healthy myocytes (10). Moreover, in this study we observed that SUV values were much higher in these patients than the MR+PET+ subjects and that the dynamic profile was also different, supporting an alternate mechanism of uptake.
Perhaps the most challenging patients to interpret were the remaining 2 MR−PET+ patients who had a focal-on-diffuse pattern of FDG activity. Controversy exists as to whether this represents an alternative PET pattern of failed myocardial suppression, or rather a region of early myocardial inflammation detectable with PET but not CMR (10). This focal-on-diffuse pattern was also observed in 11% of control subjects and demonstrated an intensity and dynamic profile more closely aligned with other false-positive and diffuse MR−PET+ cases versus the true-positive MR+PET+ subjects. All our MR−PET+ patients were, therefore, categorized as not having evidence of aCS. Nevertheless, it remains possible that in other patients a focal or focal-on-diffuse MR−PET+ pattern may represent early aCS that is not yet visible on LGE (16). Dynamic profiling of FDG uptake and its intensity seems to be a useful potential tool for differentiation of these entities.
STUDY LIMITATIONS
Our sample size is relatively small and we lack outcome data. Confirmation of our imaging findings in a larger cohort with clinical follow-up is, therefore, required. Another limitation is the lack of a gold standard for the diagnosis of cardiac sarcoidosis, reflecting the problems inherent with current diagnostic approaches and the patchy nature of the disease. An additional limitation with FDG PET remains the failure of myocardial FDG suppression that seems to occur consistently in approximately one-third of cases (13). Although our use of a control group that underwent CT/PET rather than CMR/PET was a potential limitation, the fact that we consistently observed this apparent failure of myocardial suppression across both modalities serves to reinforce this as a limiting factor with FDG. Although hybrid CMR/PET imaging can improve the differentiation of this false-positive uptake from true myocardial inflammation, ultimately, more specific tracers for inflammation or improved methods for myocardial suppression are required (19). Finally, not all patients fulfilled conventional diagnostic criteria for cardiac sarcoidosis, such as those proposed in 2014 by the Heart Rhythm Society (6) (Table 5). However, because CMR/PET imaging has not been evaluated previously for the diagnosis of cardiac sarcoidosis, our intent was never to establish a stringent clinical study at this time. Rather, we wanted to evaluate initially CMR/PET imaging in a real-world group of patients with clinically suspected cardiac sarcoidosis, as we have described. In particular, we wished to include a number of patients that had biopsy proven noncardiac sarcoidosis, or in whom there was a strong clinical suspicion of cardiac sarcoidosis but a biopsy had not yet been performed. Although approximately 70% (17 of 25) of subjects in this study fulfilled guideline criteria for cardiac sarcoidosis (5), we nevertheless believe the inclusion of subjects who ultimately failed to meet these guideline criteria was essential for this initial study to demonstrate that CMR/PET can also rule out cardiac sarcoid if it is not present.
Table 5.
Baseline Patient Characteristics According to the 2014 HRS Criteria for Cardiac Sarcoidosis
| Patient# | Findings on CMR/PET |
Histologic Biopsy Positive: Cardiac |
Histologic Biopsy Positive: Extracardiac |
Cardiomyopathy or Heart Block Responsive to Steroid With or Without Immunosuppression |
Unexplained LVEF <40% |
Unexplained Sustained or Induced VT (Spontaneous or Induced) |
Mobitz II 2nd-Degree or 3rd-Degree Heart Block |
Patchy Uptake by LGE* |
Patchy Uptake on Cardiac PET* |
Positive Gallium Uptake |
Notes | Fulfills HRS Criteria |
|---|---|---|---|---|---|---|---|---|---|---|---|---|
| 1 | MR−PET+ | N/A | Found to have ARVD | No | ||||||||
| 2 | MR+PET+ | Yes | Yes | Yes | Yes | Yes | N/A | Yes | ||||
| 3 | MR−PET− | Yes | Yes | Yes | N/A | Yes | ||||||
| 4 | MR+PET+ | Yes | Yes | Yes | N/A | No | ||||||
| 5 | MR−PET− | Yes | Yes | N/A | Yes | |||||||
| 6 | MR+PET+ | Yes | Yes | Yes | Yes | Yes | N/A | Yes | ||||
| 7 | MR−PET− | Yes | Yes | N/A | Yes | |||||||
| 8 | MR−PET− | Yes | N/A | No | ||||||||
| 9 | MR−PET− | Yes | N/A | Aortic valve nodule | No | |||||||
| 10 | MR+PET+ | Yes | Yes | N/A | No | |||||||
| 11 | MR−PET+ | Yes | Yes | N/A | Yes | |||||||
| 12 | MR+PET− | Yes | No | Yes | N/A | Yes | ||||||
| 13 | MR−PET+ | Yes | Yes | N/A | Yes | |||||||
| 14 | MR−PET+ | Yes | Yes | (diffuse) | N/A | No | ||||||
| 15 | MR+PET+ | Yes | Yes | Yes | N/A | Yes | ||||||
| 16 | MR−PET− | Yes | Yes | N/A | Yes | |||||||
| 17 | MR−PET+ | Yes | Yes | (diffuse) | N/A | Yes | ||||||
| 18 | MR+PET+ | Yes | Yes | Yes | N/A | Yes | ||||||
| 19 | MR−PET+ | Yes | Yes | N/A | Yes | |||||||
| 20 | MR−PET+ | Yes | Yes | N/A | Yes | |||||||
| 21 | MR−PET+ | Yes | Yes | Yes | N/A | Yes | ||||||
| 22 | MR−PET− | Yes (Kveim test) | Yes | N/A | Yes | |||||||
| 23 | MR+PET+ | Yes | Yes | Yes | N/A | No | ||||||
| 24 | MR+PET+ | Yes | Yes | N/A | No | |||||||
| 25 | MR−PET− | Yes | Yes | N/A | Yes |
CONCLUSIONS
Hybrid CMR/PET imaging can assess simultaneously the pattern of myocardial injury on LGE images and disease activity on PET. Accurate co-localization of these 2 signals can identify patients with aCS and differentiate these subjects from those without active disease, and patients with false-positive FDG uptake related to incomplete myocardial suppression. This approach offers major potential for improving the diagnostic accuracy of cardiac involvement in sarcoidosis, with important therapeutic implications. We suggest that hybrid CMR/PET imaging will rapidly surpass stand-alone CMR or PET imaging as the imaging modality of choice for cardiac sarcoidosis.
Supplementary Material
PERSPECTIVES.
COMPETENCY IN MEDICAL KNOWLEDGE
In the assessment of cardiac sarcoidosis, hybrid FDG CMR/PET imaging can determine myocardial function and the pattern of myocardial injury, and measure disease activity in a single scan. This approach can help to identify patients with aCS likely to benefit from anti-inflammatory therapy and differentiate them from patients with false-positive FDG uptake, who would not.
TRANSLATIONAL OUTLOOK
Large-scale confirmatory studies are now required; however, based on our findings CMR/PET imaging seems to be likely to surpass stand-alone CMR or PET imaging and to improve the efficiency of and accuracy in the diagnosis of patients with aCS.
Acknowledgments
This work was supported by a National Institutes of Health grant (NIH/NHLBI R01HL071021) (to Dr. Fayad) and by the British Heart Foundation FS/14/78/31020 (to Dr. Dweck). Dr. Dweck is the recipient of the Sir Jules Thorn Award for Biomedical Research 2015. The authors have reported that they have no relationships relevant to the contents of this paper to disclose. Drs. Dweck and Abgral contributed equally to this work and are co-first authors. Nathaniel Reichek, MD, served as the Guest Editor for this article.
ABBREVIATIONS AND ACRONYMS
- aCS
active cardiac sarcoidosis
- CMR
cardiac magnetic resonance
- CT
computed tomography
- FDG
18F-Fluorodeoxyglucose
- Ki
FDG uptake rate
- LGE
late gadolinium enhancement
- MR
magnetic resonance
- PET
positron emission tomography
- SUV
standard uptake value
- SUVmax
maximum standard uptake value
- TBR
tissue-to-background ratio
- TBRmax
maximum tissue-to-background ratio
- TNMR
target-to-normal myocardium ratio
- TNMRmax
maximum target-to-normal myocardium ratio
APPENDIX
For supplemental methods and figures, please see the online version of this paper.
References
- 1.Birnie DH, Nery PB, Ha AC, Beanlands RSB. Cardiac sarcoidosis. J Am Coll Cardiol. 2016;68:411–21. doi: 10.1016/j.jacc.2016.03.605. [DOI] [PubMed] [Google Scholar]
- 2.Iannuzzi MC, Rybicki BA, Teirstein AS. Sarcoidosis. N Engl J Med. 2007;357:2153–65. doi: 10.1056/NEJMra071714. [DOI] [PubMed] [Google Scholar]
- 3.Uemura A, Morimoto S, Hiramitsu S, Kato Y, Ito T, Hishida H. Histologic diagnostic rate of cardiac sarcoidosis: evaluation of endomyocardial biopsies. Am Heart J. 1999;138:299–302. doi: 10.1016/s0002-8703(99)70115-8. [DOI] [PubMed] [Google Scholar]
- 4.Diagnostic standard and guidelines for sarcoidosis. Jpn J Sarcoidosis Granulomatous Disord. 2007;27:89–102. [Google Scholar]
- 5.Birnie DH, Sauer WH, Bogun F, et al. HRS expert consensus statement on the diagnosis and management of arrhythmias associated with cardiac sarcoidosis. Heart Rhythm. 2014;11:1305–23. doi: 10.1016/j.hrthm.2014.03.043. [DOI] [PubMed] [Google Scholar]
- 6.Ohira H, Tsujino I, Ishimaru S, et al. Myocardial imaging with 18F-fluoro-2-deoxyglucose positron emission tomography and magnetic resonance imaging in sarcoidosis. Eur J Nucl Med Mol Imaging. 2008;35:933–41. doi: 10.1007/s00259-007-0650-8. [DOI] [PubMed] [Google Scholar]
- 7.Patel MR, Cawley PJ, Heitner JF, et al. Detection of myocardial damage in patients with sarcoidosis. Circulation. 2009;120:1969–77. doi: 10.1161/CIRCULATIONAHA.109.851352. [DOI] [PMC free article] [PubMed] [Google Scholar]
- 8.Greulich S, Deluigi CC, Gloekler S, et al. CMR imaging predicts death and other adverse events in suspected cardiac sarcoidosis. J Am Coll Cardiol Img. 2013;6:501–11. doi: 10.1016/j.jcmg.2012.10.021. [DOI] [PubMed] [Google Scholar]
- 9.Coleman GC, Shaw PW, Balfour PC, et al. Prognostic value of myocardial scarring on CMR in patients with cardiac sarcoidosis: a systematic review and meta-analysis. J Am Coll Cardiol Img. 2017;10:411–20. doi: 10.1016/j.jcmg.2016.05.009. [DOI] [PMC free article] [PubMed] [Google Scholar]
- 10.Ishida Y, Yoshinaga K, Miyagawa M, et al. Recommendations for (18)F-fluorodeoxyglucose positron emission tomography imaging for cardiac sarcoidosis: Japanese Society of Nuclear Cardiology recommendations. Ann Nucl Med. 2014;28:393–403. doi: 10.1007/s12149-014-0806-0. [DOI] [PubMed] [Google Scholar]
- 11.Ishimaru S, Tsujino I, Takei T, et al. Focal uptake on 18F-fluoro-2-deoxyglucose positron emission tomography images indicates cardiac involvement of sarcoidosis. Eur Heart J. 2005;26:1538–43. doi: 10.1093/eurheartj/ehi180. [DOI] [PubMed] [Google Scholar]
- 12.Blankstein R, Osborne M, Naya M, et al. Cardiac positron emission tomography enhances prognostic assessments of patients with suspected cardiac sarcoidosis. J Am Coll Cardiol. 2014;63:329–36. doi: 10.1016/j.jacc.2013.09.022. [DOI] [PMC free article] [PubMed] [Google Scholar]
- 13.Joshi NV, Vesey AT, Williams MC, et al. 18F-fluoride positron emission tomography for identification of ruptured and high-risk coronary atherosclerotic plaques: a prospective clinical trial. Lancet. 2014;383:705–13. doi: 10.1016/S0140-6736(13)61754-7. [DOI] [PubMed] [Google Scholar]
- 14.Abgral R, Dweck MR, Trivieri MG, et al. Clinical Utility of Combined FDG-PET/MR to Assess Myocardial Disease. J Am Coll Cardiol Img. 2017;10:594–7. doi: 10.1016/j.jcmg.2016.02.029. [DOI] [PMC free article] [PubMed] [Google Scholar]
- 15.Dweck MR, Jones C, Joshi NV, et al. Assessment of valvular calcification and inflammation by positron emission tomography in patients with aortic stenosis. Circulation. 2012;125:76–86. doi: 10.1161/CIRCULATIONAHA.111.051052. [DOI] [PubMed] [Google Scholar]
- 16.Ohira H, Birnie DH, Pena E, et al. Comparison of (18)F-fluorodeoxyglucose positron emission tomography (FDG PET) and cardiac magnetic resonance (CMR) in corticosteroid-naive patients with conduction system disease due to cardiac sarcoidosis. Eur J Nucl Med Mol Imaging. 2016;43:259–69. doi: 10.1007/s00259-015-3181-8. [DOI] [PubMed] [Google Scholar]
- 17.Patlak CS, Blasberg RG, Fenstermacher JD. Graphical evaluation of blood-to-brain transfer constants from multiple-time uptake data. J Cereb Blood Flow Metab. 1983;3:1–7. doi: 10.1038/jcbfm.1983.1. [DOI] [PubMed] [Google Scholar]
- 18.Soussan M, Augier A, Brillet P-Y, Weinmann P, Valeyre D. Functional imaging in extrapulmonary sarcoidosis: FDG-PET/CT and MR features. Clin Nucl Med. 2014;39:e146–59. doi: 10.1097/RLU.0b013e318279f264. [DOI] [PubMed] [Google Scholar]
- 19.Gormsen LC, Haraldsen A, Kramer S, Dias AH, Kim WY, Borghammer P. A dual tracer (68)Ga-DOTANOC PET/CT and (18)F-FDG PET/CT pilot study for detection of cardiac sarcoidosis. EJNMMI Res. 2016;6:52. doi: 10.1186/s13550-016-0207-6. [DOI] [PMC free article] [PubMed] [Google Scholar]
Associated Data
This section collects any data citations, data availability statements, or supplementary materials included in this article.