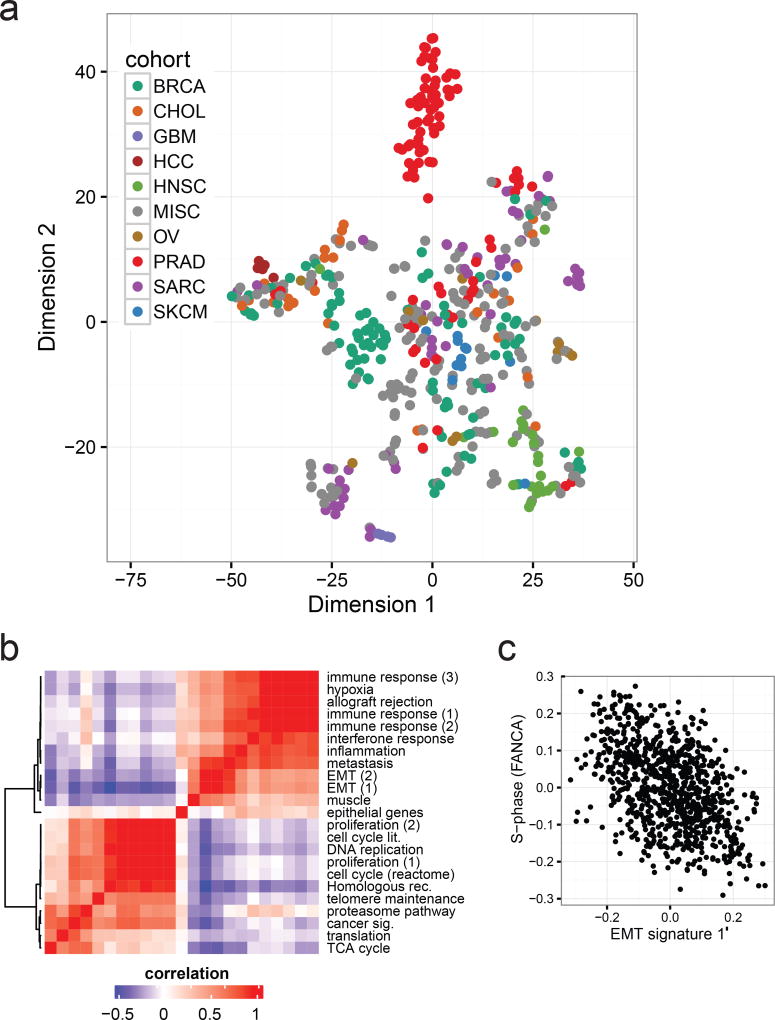
Figure 4. Diverse transcriptional profiles of metastatic cancers.
a. Global gene expression patterns of the MET500 identify poorly differentiated cancers as illustrated by a t-SNE projection of the MET500 samples. Position of samples within the plot reflects the relative similarity in the expression of cancer-specific markers. Samples are color-coded based on their assigned analysis cohort. b. Correlation heatmap and hierarchical clustering showing similarities (red) and dissimilarities (blue) in the transcriptional activity of computationally derived aggregate sets of signatures across the MET500 “meta-signatures”. c. Negative correlation between signatures of EMT and proliferation (S-phase of the cell cycle, FANCA pathway). All MET500 samples are shown.

