Abstract
The GTPase RhoA is a major player in many different regulatory pathways. RhoA catalyzes GTP hydrolysis, and its catalysis is accelerated when RhoA forms heterodimers with proteins of the guanine nucleotide exchange factor (GEF) family. Neuroepithelial cell transforming gene 1 (Net1) is a RhoA-interacting GEF implicated in cancer, but the structural features supporting the RhoA/Net1 interaction are unknown. Taking advantage of a simple production and purification process, here we solved the structure of a RhoA/Net1 heterodimer with X-ray crystallography at 2-Å resolution. Using a panel of several techniques, including molecular dynamics simulations, we characterized the RhoA/Net1 interface. Moreover, deploying an extremely simple peptide-based scanning approach, we found that short peptides (penta- to nonapeptides) derived from the protein/protein interaction region of RhoA could disrupt the RhoA/Net1 interaction and thereby diminish the rate of nucleotide exchange. The most inhibitory peptide, EVKHF, spanning residues 102–106 in the RhoA sequence, displayed an IC50 of ∼100 μm without further modifications. The peptides identified here could be useful in further investigations of the RhoA/Net1 interaction region. We propose that our structural and functional insights might inform chemical approaches for transforming the pentapeptide into an optimized pseudopeptide that antagonizes Net1-mediated RhoA activation with therapeutic anticancer potential.
Keywords: small GTPase; protein-protein interaction; Ras homolog gene family, member A (RhoA); peptides; protein crystallization; heterodimer structure; Net1
Introduction
Rho GTPases control many aspects of cell behavior, such as cytoskeleton organization, cell-cycle progression, and gene transcription (1, 2). The dysregulation of Rho proteins contributes to tumorigenesis, metastasis (3), hypertension (4, 5), diabetes (6, 7), inflammation (8), neuroplasticity (9), and cancer (3). Thus, targeting Rho GTPase signaling pathways has emerged as a promising therapeutic strategy (10, 11).
In humans, 22 genes encode Rho GTPase family members. Three members, RhoA, Cdc42, and Rac1, are the best characterized, and they illustrate the key functions of the family (12–15). GTPases are molecular switches that cycle between the active GTP-bound state and, after GTP hydrolysis, the inactive GDP-bound state. In the active state, they recognize target proteins and induce cellular responses. Two classes of proteins are mainly involved in Rho regulation. One class comprises GTPase-activating proteins, which suppress Rho signaling by enhancing Rho GTPase activity. The other class comprises guanine nucleotide exchange factors (GEFs),3 which promote Rho activity by catalyzing the exchange of GDP for GTP (16).
Neuroepithelial cell transforming gene 1 (Net1) is a GEF specific for RhoA (17) and RhoB (18). Net1 is a protein of 596 amino acids with two tandem domains, one with Dbl homology (DH) and the other with pleckstrin homology (PH), which are flanked by N-terminal and C-terminal extensions. The DH-PH domain, present in most GEFs, provides the minimal structural unit required to catalyze the nucleotide exchange reaction in vivo. Net1 shuttles between the nucleus and the plasma membrane in response to cell-motility stimuli. Furthermore, Net1 is overexpressed in a number of human cancers, particularly gastric adenocarcinoma (19, 20). Through RhoA activation, Net1 stimulates cell motility, invasion, and cell spreading in response to a variety of ligands. The cytoskeletal rearrangements driven by Net1 comprise a key pathological mechanism in gastric tumor cell migration and extracellular matrix invasion (19, 21). Elevated Net1 expression levels were shown to correlate with the progression of tumors, such as hepatocellular carcinoma (22) and lung cancers (23).
The unique role of Net1 in tumor cell migration through its interaction with RhoA has focused interest on the RhoA/Net1 interface as a potential target for anticancer drugs. Previously, drug discovery campaigns attempted to target the structurally conserved interface between GEFs and RhoA. However, due to the limited binding specificity of Rhos and GEFs, those approaches have led to molecules with severe selectivity issues (24). From the purely molecular point of view, a few key studies have described the relationship between RhoA and GEF11 or GEF12 (25–28), but little is known regarding the interface between RhoA and Net1.
Therefore, we aimed to gain more structural information both on the RhoA/Net1 interface and on the complex. In the present work, we solved the crystal structure of the Net1/RhoA complex with X-ray crystallography. Then with molecular modeling and enzymatic assays, we identified the residues that contributed most of the energy required to form the Net1-PH/RhoA interaction. Based on these calculations, we determined the molecular recognition process. Finally, we designed small peptides that could inhibit the guanine exchange activity by disrupting the Net1-PH/RhoA interface.
Results and discussion
Purification of the Net1/RhoA complex
Initially, we purified the Net1 DHPH domain, which comprised residues 157–494 and a hexahistidine (His6) plus a TEV tag at the N terminus. This protein was expressed well, and it could be purified in two chromatography steps (nickel-nitrilotriacetic acid affinity and gel filtration). However, it did not show any nucleotide exchange–enhancing activity. Hence, we extended the C terminus to residue 501 (157–501) and added a C-terminal His6 tag, which restored some GEF activity. Then we altered the N terminus to start at either residue 149 or 170. These final constructs exhibited higher GEF activity. We used 149–501 with a His6 C-terminal tag for crystallography. RhoA was prepared as described previously (25). These recombinant proteins were mixed, dialyzed, and further purified to yield a fair amount of protein amenable to crystallography-grade material (Fig. 1). The quality of the preparation was a key factor in the next steps of this study. Indeed, although not unique (25, 26, 29), purifications of this type are not common.
Figure 1.
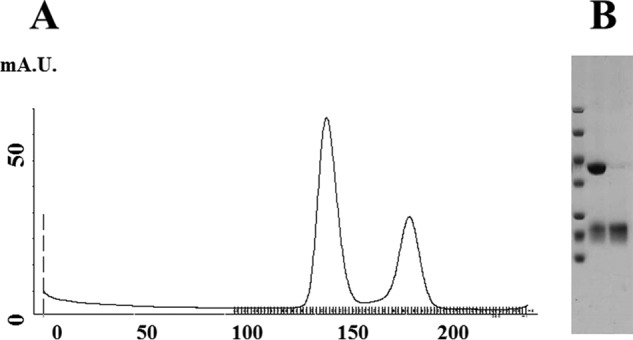
Purification of the Net1-DHPH/RhoA complex. A, Superdex 200 26/60 gel-filtration profile of the Net1-DHPH/RhoA complex. B, Coomassie-stained SDS-polyacrylamide gel shows the Net1-DHPH/RhoA complex isolated with Superdex 200 chromatography. Molecular mass markers,10, 15, 25, 35, 45, 67, and 90 kDa; lane 1, higher band is the Net1/RhoA complex; lane 2, lower band shows excess unbound RhoA. mA.U., milliabsorbance units.
Overall structure of the Net1-DHPH/RhoA complex
The asymmetric unit had two heterodimers of Net1-DHPH/RhoA. The heterodimers were identical as indicated by the low r.m.s.d. value (0.4 or 0.45 Å with RhoA or Net1 as reference, respectively). Net1 contained the DH and PH domains. The DH domain was an oblong helical bundle; it facilitates nucleotide exchange by forming a stable complex with the nucleotide-free conformation of the RhoA GTPase. The PH domain was a flattened, seven-stranded β-barrel, capped with a characteristic C-terminal α-helix (αC). The broad picture is like what has been described for other RhoGEF complexes with a RhoA (30), devoid of nucleotide and with a large interface (Fig. 2).
Figure 2.
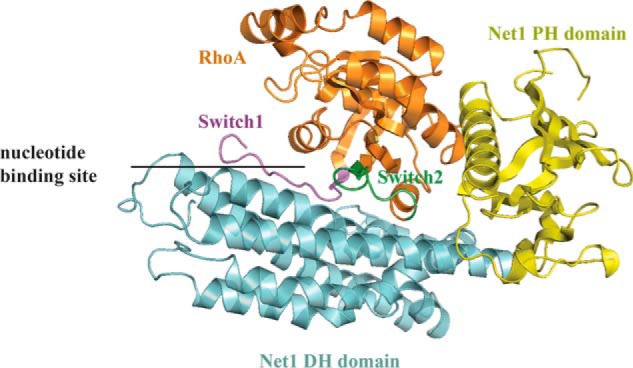
Overall crystal structure of RhoA/Net1-DHPH complex. RhoA is shown in orange; switch 1 is in purple, and switch 2 is in green (30). The Net1 DH domain is in cyan, and the Net1 PH domain is in yellow.
In our structure, RhoA was clamped between the DH and PH domains of Net1. This conformation was cation- and nucleotide-free with switch I removed from the nucleotide-binding site and switch II pulled toward the nucleotide-binding site. This conformation was similar to those previously reported for RhoA/GEF complexes where the interaction with the DH/PH domains stabilized the nucleotide-free form of RhoA by altering the structures of the two switches.
A superposition of this RhoA with the structure of RhoA in complex with a nucleotide indicated a likely binding site for the nucleotide in the RhoA/Net1 complex. Indeed, we reasoned that the nucleotide was likely to bind to the active site through an extensive network of hydrogen bonds, including residues Gly17, Lys18, and Thr19, which could interact with the pyrophosphate group. Additionally, residues Lys118, Asp120, Ala161, and Lys162 could interact with the guanosine moiety (Fig. 3). The cation–π interaction between the guanine and Lys118 is conserved among RhoA structures solved in the presence of nucleotide. In our structure, the conformation of the RhoA active site was nearly identical to that described previously for RhoGEF12 (r.m.s.d., 1.1 Å with RhoA; Protein Data Bank code 1X86) (26). In particular, the orientation of the loop near the Gly14 residue, critical for GTP binding, was similar in these two structures; the lateral chain pointed toward the nucleotide-binding site, thus, preventing nucleotide binding. The 160–165 loop was significantly reorganized, which allowed the formation of hydrogen bonds between the guanine and residues Ala161 and Lys162. This conformation was observed previously in the structure of Rho/GEF11 (Protein Data Bank code 1XCG) (25).
Figure 3.
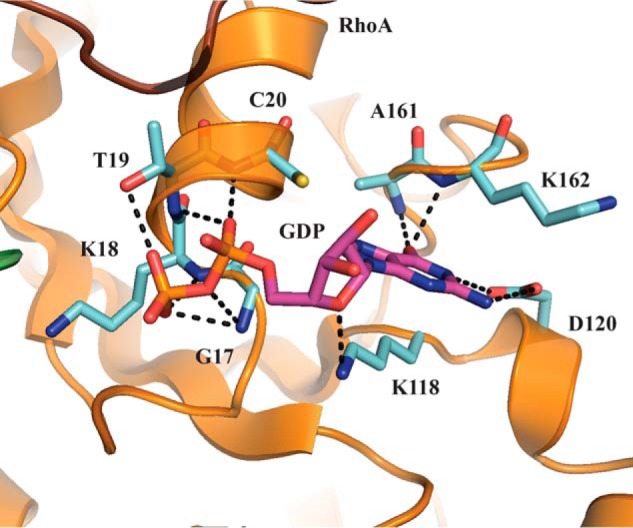
Superposition of the RhoA structure from the Net1-DHPH/RhoA complex with a bound GDP structure suggests the likely binding site for GDP. The RhoA (orange with cyan side chains) from the Net1-DHPH/RhoA structure (Protein Data Bank code 4XH9) is superposed onto the GDP (purple with a red pyrophosphate) from the RhoA/GDP structure (Protein Data Bank code 4D0N).
Comparison of the Net1-DHPH (4XH9) and Net1-DH (3EO2) structures
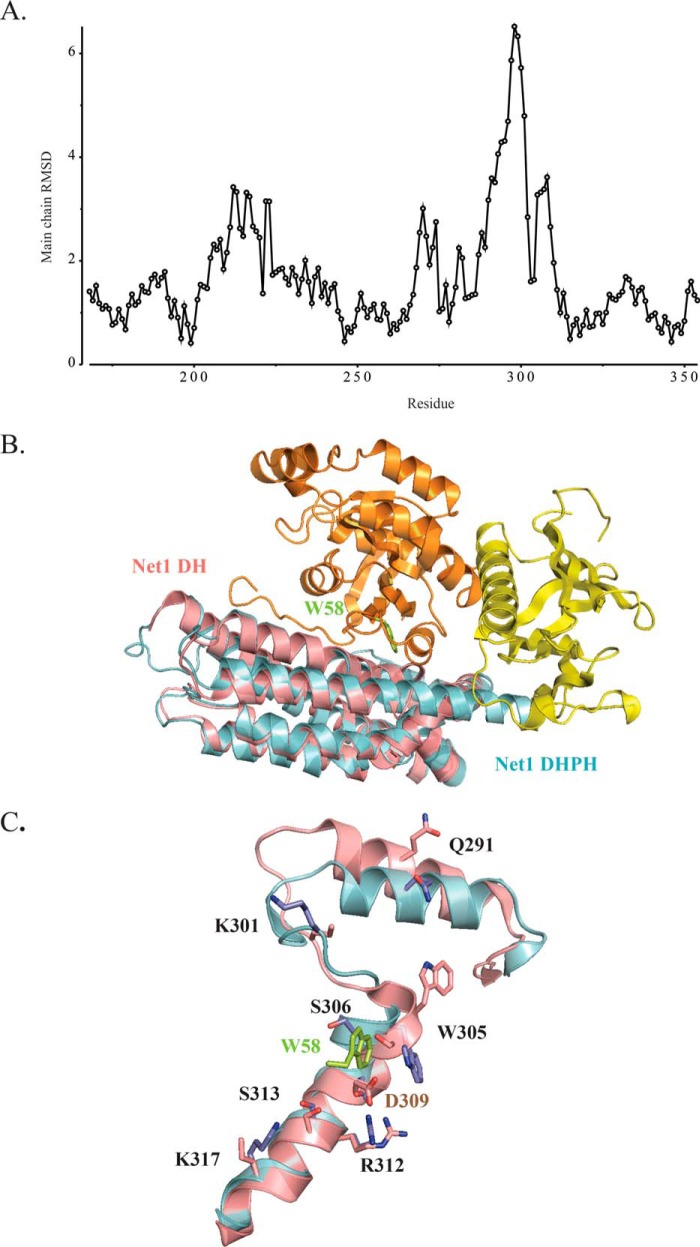
The crystal structure of the DH domain was previously solved with a resolution of 2.6 Å (Protein Data Bank code 3EO2). The r.m.s.d. analysis calculated for the main chains of Net1-DHPH (Protein Data Bank code 4XH9) and Net1-DH (Protein Data Bank code 3EO2) pointed out that residues 280–310 were severely deviated in Net1-DH (Fig. 4A). Upon RhoA binding, the N-terminal domain of NET1-DHPH was shifted by ∼40° compared with Net1-DH (Fig. 4B); this shift prevented steric clashes between residues Ser306 and Asp309 on Net1 and Trp58 on RhoA (Fig. 4C). A consequence of this reorganization was the displacement of the 284–295 α-helix, induced by the H-bond formed between Trp305 of Net1-DHPH and Leu72 of RhoA.
Figure 4.
Comparison of Net1-DHPH (Protein Data Bank code 4XH9) and Net1-DH (Protein Data Bank code 3EO2) structures. A, calculated r.m.s.d. values for Net1-DHPH and Net1-DH. The main chain deviations calculated with the superpose program from the CCP4 suite are indicated for each residue (circles). B, alignment of Net1-DHPH (blue/yellow) and Net1-DH (magenta) structures. RhoA is shown in orange. C, close-up view of the alignment of Net1-DHPH (cyan with blue side chains) and Net1-DH (magenta with magenta side chains) structures shows that Asp309 could not be involved in RhoA binding to Net1 due to the clash between Ser306/Asp309 from Net1 and Trp58 from RhoA (green).
The DH/RhoA interface
All the interactions between Net1-DHPH and RhoA were conserved in the two complexes of the asymmetric unit. Twelve amino acids in RhoA, distributed between Arg5 and Ser73, were involved in polar interactions with DH. Moreover, Glu40, Asp45, and Glu76 in RhoA established salt bridges with Lys317, Lys301, and Lys274 in DH (Fig. 5, A and B). Residues Val38, Val43, Trp58, and Tyr66 in RhoA and Leu321, Leu302, Trp305, and Leu350 in DH were involved in hydrophobic interactions (within 4 Å). With the PISA server, we found the closest homologues available in the Protein Data Bank based on interface homology. The most significant homologues for which a similar interface was previously described were RhoA/GEF12 (Protein Data Bank code 1X86) (26) and RhoA/GEF11 (Protein Data Bank code 1XCG) (25). Despite a rather low sequence homology between these two RhoGEF proteins, many of the residues involved in the interactions with RhoA were conserved. There are nevertheless original contacts in the case of Net1 as shown in Table 1.
Figure 5.
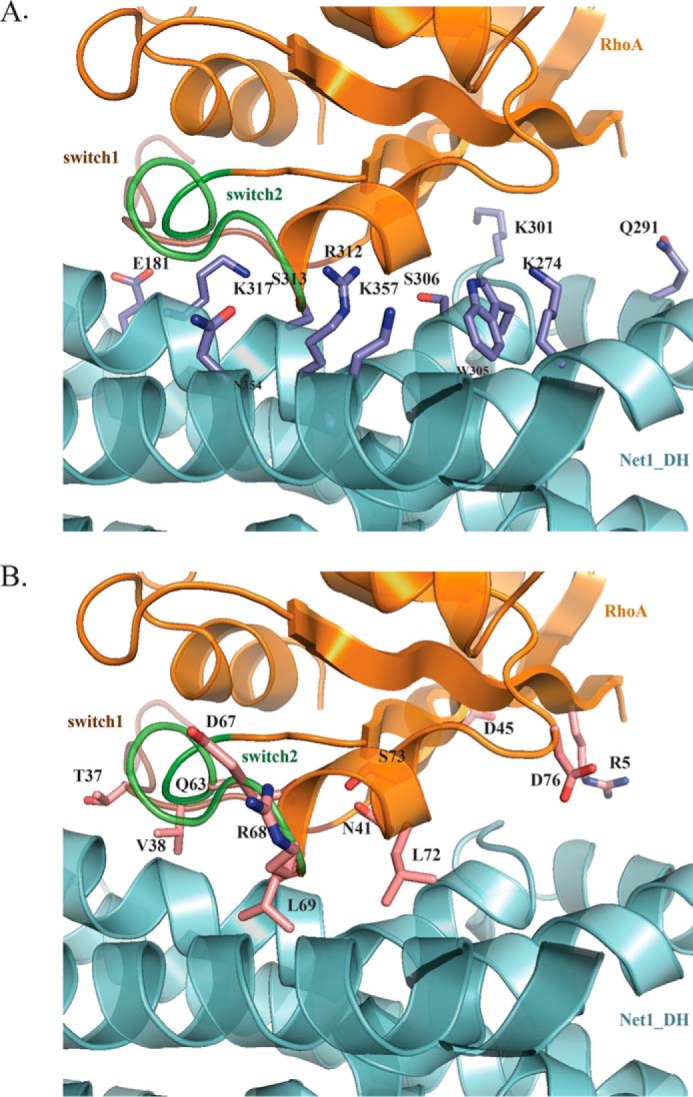
The DH/RhoA interface. A, DH residues (blue) involved in the interface. B, RhoA residues (magenta) involved in the interface. RhoA is shown in orange; DH is shown in cyan.
Table 1.
Analysis of the interactions between RhoA and the DH domains of Net1, RhoGEF11, and RhoGEF12
The distance corresponds to the distance measured during the 100-ns run in the molecular dynamics (MD) simulations of the interaction between Net1 and RhoA. Residues in italic are not homologous in the superposed structures of Net1, RhoGEF11, and RhoGEF12. —, no H-bond between these amino acids from RhoA and GEF.
| RhoA | Net1 (4XH9) | RhoGEF11 (1XCG) | RhoGEF12 (1X86) | Distance | Distance measured in MD |
|---|---|---|---|---|---|
| Å | Å | ||||
| Hydrogen bonds | |||||
| Arg5 | Gln291 | Arg868/Asp873 | Arg923 | 2.7 | 4.5 ± 1.0 |
| Thr37 | Glu181 | Glu741 | Glu794 | 2.8 | 2.8 ± 0.2 |
| Val38 | Glu181 | Glu741 | Glu794 | 3.1 | 3.3 ± 0.4 |
| Asn41 | Ser306 | Gln880 | Gln935 | 2.9 | 4.5 ± 1.3 |
| Asp67 | Asn354 | Asn921 | Asn975 | 3.6 | 3.6 ± 0.4 |
| Arg68 | Asn354 | Asn921 | Asn975 | 2.9 | 3.0 ± 0.2 |
| Leu69 | Asn354 | Asn921 | Asn975 | 3.1 | 3.2 ± 0.3 |
| Glu40 | Ser313 | Ser748 | — | 2.7 | 5.9 ± 0.9 |
| Gln63 | Arg312 | — | — | 3.1 | 3.0 ± 0.3 |
| Arg68 | Lys357 | — | Glu982/Asn983 | 2.8 | 3.0 ± 0.5 |
| Leu69 | Arg312 | — | — | 2.9 | 3.0 ± 0.3 |
| Leu72 | Trp305 | — | — | 3.6 | 4.2 ± 0.5 |
| Ser73 | Arg312 | — | — | 2.6 | 3.0 ± 0.3 |
| Salt bridges | |||||
| Glu40 | Lys317 | Arg751/Arg867 | Arg922 | 3.6 | 2.9 ± 0.3 |
| Asp45 | Lys301 | Arg868 | Arg923 | 3.9 | 5.2 ± 1.9 |
| Asp76 | Lys274 | Arg872 | Lys899 | 2.9 | 3.4 ± 1.0 |
The PH/RhoA interface
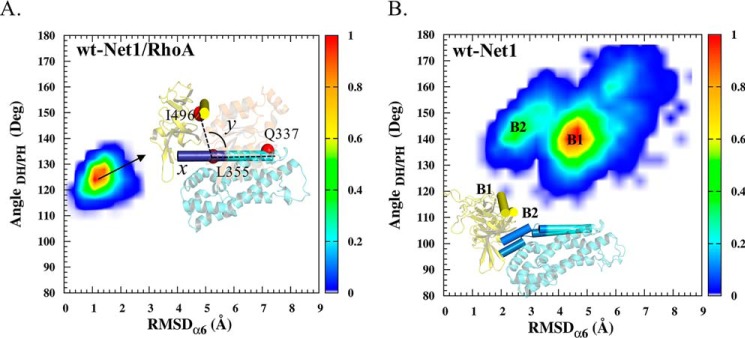
X-ray crystallography models were supplemented with molecular dynamics simulations to provide insight into the dynamic properties and conformational changes of the RhoA/Net1 complex. We found that the presence of RhoA strongly influenced the conformational dynamics of the Net1 PH domain (Fig. 6, A and B). In complex with RhoA, the N-terminal domain of the α6 helix of Net1 PH remained stable, in a position similar to that observed in the crystal structure (r.m.s.d., 1 Å), and the PH/DH domain angle remained constant at ∼125° (Fig. 6A). Conversely, in the RhoA-free system, Net1 samples displayed multiple conformal states (Fig. 6B). The absence of the Net1/RhoA interaction increased the flexibility of α6 helix, which altered the position of the PH domain.
Figure 6.
Conformational distributions of the DH/PH domains of Net1. Molecular dynamics results show the r.m.s.d. of the α6 helix (residues 357–368) on the x axis (Å), and the DH/PH angle (i.e. the angle between the α-carbons of residues Gln337, Leu355, and Ile496) on the y axis (deg, degrees). Each plot shows representative structures of Net1; the α6 and αC helices are shown in cyan and yellow cylinders, respectively. The color scale indicates the number of occurrences per bin normalized to the maximum number in a bin. A, Net1 in complex with RhoA. B, Net1 in the absence of RhoA.
No RhoA guanine nucleotide exchange could be detected with the isolated DH domain in the in vitro exchange assay (Fig. 7). Thus, we concluded that the presence of the PH domain was critical to the activity of Net1 and that it must be stabilized in the interaction with RhoA.
Figure 7.
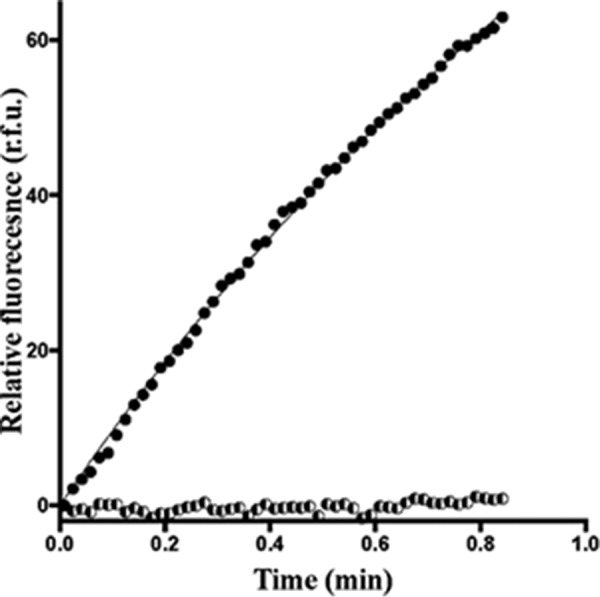
Biochemical characterization of GTP/GDP exchange activities for the Net1/RhoA complex. RhoA exchange activity was measured in the presence of the DHPH segment of Net1 (1 μm; dark circles). The GTP/GDP exchange activity of Net1 DH (10 μm) is shown as a control experiment (halftone symbols). The experiments were run at least three times independently. A representative curve is presented here. r.f.u., relative fluorescence units.
In the Rho/GEF11 and Rho/GEF12 crystal structures, the binding of PH to RhoA is mediated by two forces. One is a hydrogen bond between Glu97 in RhoA and Ser1118/Ser1065 in PH; the other is a salt bridge formed by Arg68 in RhoA with either Glu1023 or Glu969 in PH (Fig. 8A). This binding mode was not observed in the Net1-DHPH/RhoA structure, which suggested that the Net1 PH domain must be stabilized in a unique way. We found that, in the Net1-DHPH/RhoA crystal structure, the His105 residue in RhoA bridged the water molecule, Wat1, which was further stabilized by Glu392, Trp492, and His488 in the Net1 PH domain. RhoA His105 also interacted with the His390 amide group, either directly or with the mediation of water (Wat2). The imidazole ring formed both a salt bridge with Glu361 in the DH domain (known as the DHPH intrachain interaction) and a π–π interaction with the Tyr365 phenyl ring (Fig. 8B). The existence of this unique mode of interaction was supported by low values of the B factors, calculated after isotropic refinement, and the r.m.s.d. of the residues/waters measured in the molecular dynamics simulations (Table 2).
Figure 8.
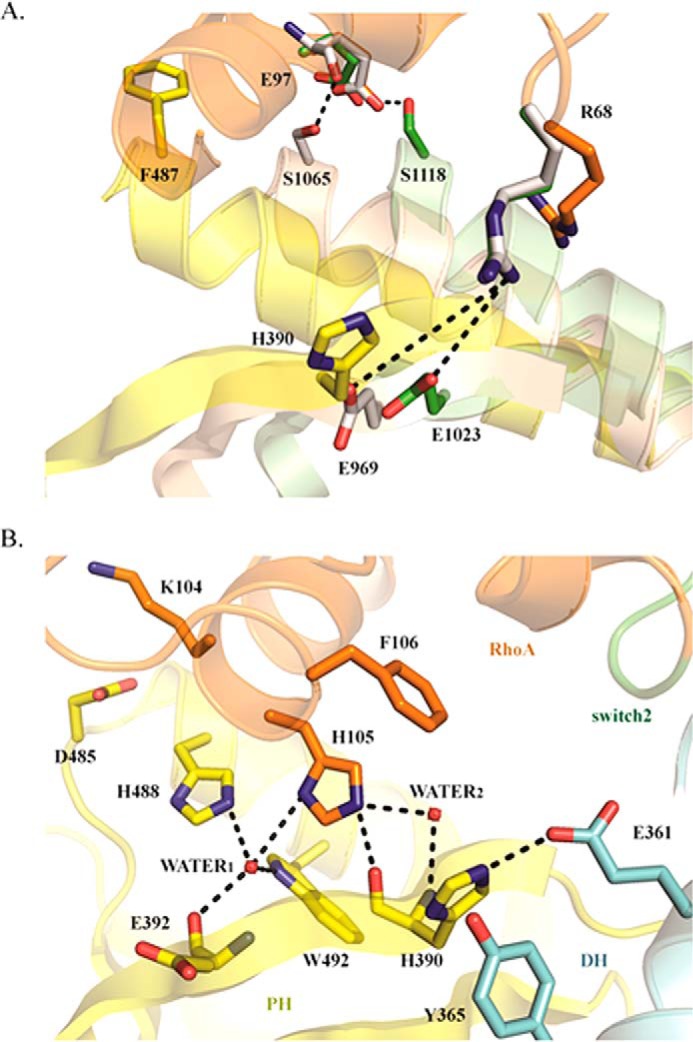
The PH/RhoA interface. A, structural alignment of the PH domains in Net1-DHPH (yellow/blue), RhoGEF11 (brown), and RhoGEF12 (green). Net1-corresponding residues based on the sequences alignment are shown in sticks. B, the Net1 PH/RhoA interface; interactions between side chains are shown for the Net1 DH (cyan) and PH domains (yellow) and RhoA (orange).
Table 2.
Analysis of the interactions between RhoA and the PH domains of Net1
MD, molecular dynamics; Min, minimum; Max, maximum.
| Putative H-bond involved in the PH/RhoA interface | Distance measured in 4XH9 | Distance measured in MD | Isotropic refinement B factorsa |
|
|---|---|---|---|---|
| Residue/water molecule | Chain | |||
| Å | Å | Å2 | ||
| Wat1–His488 (Nϵ2) | 3.0 | 3.0 ± 0.2 | His488, 18 | Net1-PH |
| Wat1–Glu392(O) | 2.8 | 2.8 ± 0.2 | Glu392, 21 | Average, 30 |
| Wat1–Glu392(N) | 3.3 | 3.4 ± 0.3 | Min, 16 | |
| Wat1–Trp492 (Nϵ1) | 2.8 | 3.0 ± 0.2 | Trp492, 17 | |
| Wat2–His390(N) | 3.0 | 3.1 ± 0.3 | His390, 18 | Max, 64 |
| His105(Nϵ2)–His390(O) | 2.9 | 3.2 ± 0.4 | His105, 15 | RhoA |
| Average, 28 | ||||
| Min, 13 | ||||
| Max, 64 | ||||
| Wat1–His105 (Nδ1) | 3.4 | 3.7 ± 0.3 | Wat1, 16 | Waters |
| Average, 37 | ||||
| Wat2–His105 (Nϵ2) | 2.9 | 3.3 ± 0.4 | Wat2, 22 | Min, 14 |
| Max, 57 | ||||
a Values represent the AB heterodimer of the asymmetric unit.
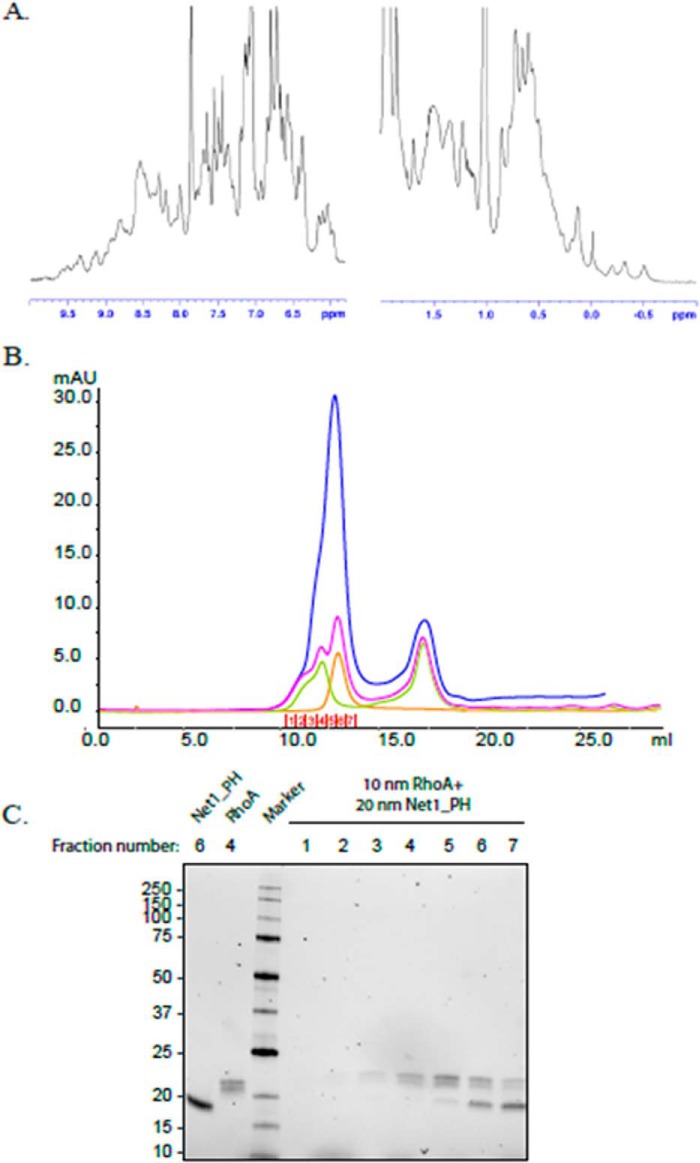
Net1-PH was later purified to investigate the in vitro formation of the Net1-PH/RhoA heterodimer. First, the folding of Net1-PH was confirmed with 1H NMR. The NH signals in the range of ∼8.00–9.6 ppm and signals down to −0.5 ppm matched the aromatic and the aliphatic regions of the spectrum (Fig. 9A). This result indicated the presence of folding in the structure. The abundance of signals in the region of 8.5 ppm may indicate the presence of unfolded regions in the PH domain. The interaction between Net1-PH and RhoA was analyzed by gel-filtration chromatography (Fig. 9B) and SDS-PAGE (Fig. 9C). Despite different ratios of Net1-PH to RhoA (1:1 and 2:1), we observed no dimer formation, as indicated by the lack of Net1-PH in the eluted fractions of high molecular weights. Consequently, we concluded that the binding of Net1-PH to RhoA was most likely induced by the binding of Net1-DH to RhoA. Alternatively, one might consider that the interaction of Net1-PH (i.e. without its DH domain) with RhoA is too weak to have been detected by the methods used.
Figure 9.
Net1-PH/RhoA heterodimer formation analysis. A, NMR data show the protein complex (200 μl at a concentration of 1. 8 mg/ml, 104.8 μm) in 20 mm Tris, 200 mm NaCl, 10% glycerol, 1 mm TCEP, pH 7.5, mixed with 20 μl of D2O and placed in a 3-mm NMR tube. B, Superdex 75 10/300 gel-filtration profile of Net1-PH (orange), RhoA (green), and Net1-PH preincubated with RhoA at a ratio of 1:1 (pink) or 2:1 (blue). The eluted fractions (1–7) are indicated with red numbers. The peak observed at 17 ml corresponds to the GDP present in the RhoA buffer. C, TGX Stain-free SDS-polyacrylamide gel of the elution fractions from the Net1-PH/RhoA gel-filtration run (ratio, 2:1). Lane 1, Net1-PH, fraction 6; lane 2, RhoA, fraction 4; lane 3, molecular mass markers, 10, 15, 20, 25, 37, 50, 75, 100, 150, and 250 kDa; lanes 4–10, elution fractions 1–7 from Net1-PH/RhoA (ratio, 2:1; blue trace in A). mAU, milli-absorbance units.
Targeting the PH/RhoA interface with small peptides
The previous finding that Net1 played a role in metastatic processes served as an incentive to target it. Early attempts to target a specific GEF DH/RhoA interface led to nonspecific inhibition because the DH/RhoA interface is highly conserved among GEFs. Therefore, we reasoned that the unique Net1-PH/RhoA interface may provide a selective target for altering the cellular effects of Net1. However, targeting protein/protein interactions has long been considered highly challenging due to their large, dynamic interfaces. To address these challenges, we utilized computational approaches to design small peptides that mimicked the key Net1/RhoA interface interactions.
We used a decomposition approach that combined molecular mechanics energies with the generalized Born and surface area continuum solvation method (MM-GBSA) to identify the residues that made the most important energetic contributions to the formation of the PH domain/RhoA complex (Fig. 10, A and B). Residues Asp485–Gln491 in Net1 contributed significantly to the binding free energy of the complex. This segment established multiple interactions with residues 100–106 in RhoA. In particular, Asp485 and His488 (Net1) formed several hydrogen bonds and salt bridges with Lys104 and His105 (RhoA). As a result of this analysis, we identified potential hot spots involved in the binding between Net1 and RhoA. This information allowed us to initiate competition assays with peptides derived from the loops of contact in RhoA. Peptides that mimicked potential hot spots in segment 96–106 of RhoA were designed to perturb the Net1-DHPH/RhoA interface. We monitored the inhibition of guanine nucleotide exchange to identify hot spots that affected function (Fig. 11, A and B). Competitive assays performed with peptide 96–102 that formed the RhoA “hydrophobic pocket” showed no inhibition efficiency in the molecular dynamics analysis. In contrast, a short peptide that spanned amino acids 102–106 exhibited an IC50 of 116.5 ± 6.3 μm (Fig. 11C). Longer peptides (96–106 and 100–109) display a poor inhibition effect, suggesting folding/aggregation issues. Finally, no inhibition of Net1 was measured when peptide 100–105, devoid of Phe106, was used.
Figure 10.
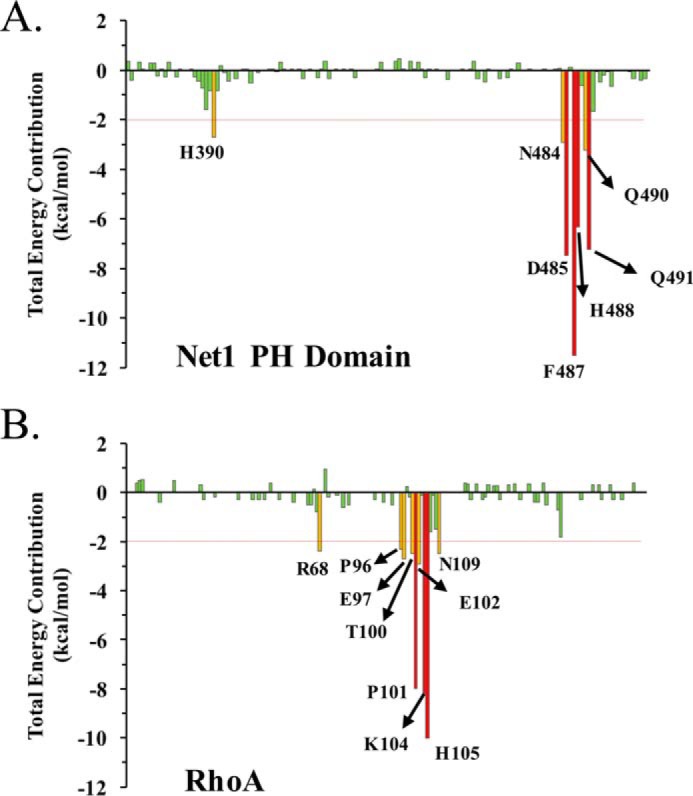
MM-GBSA per residue decomposition analysis of the Net1 PH domain (A) and the RhoA (B) complex. The total binding free energy contribution is shown for each amino acid residue, and those with the highest contributions are highlighted. For MM-GBSA, molecular mechanics energies were combined with the generalized Born and surface area continuum solvation.
Figure 11.
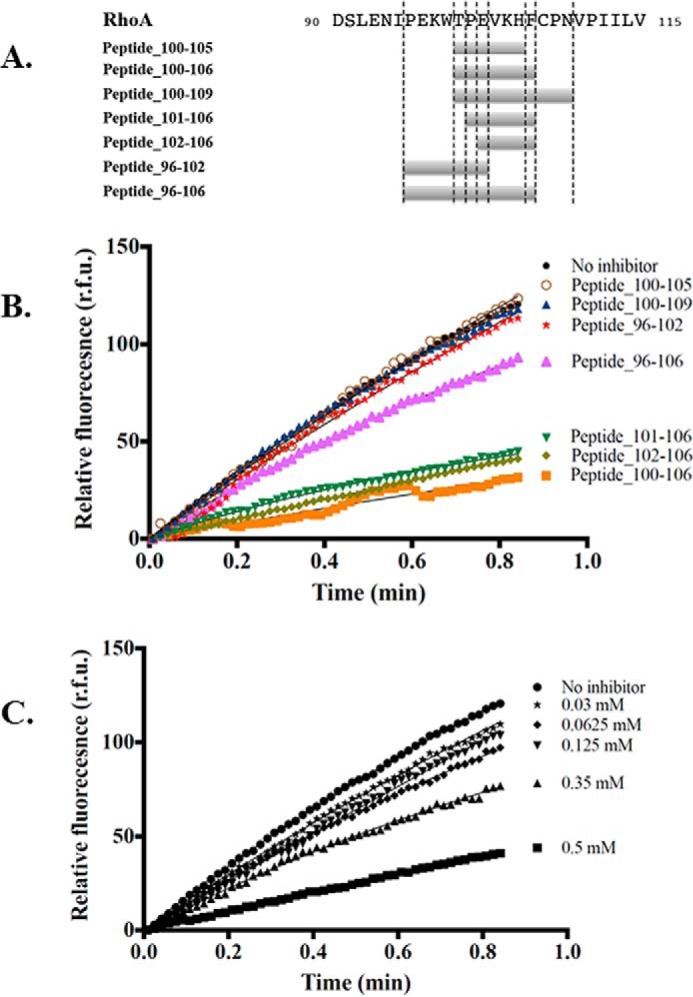
Biochemical characterization of the inhibitory effect of peptides on the Net1/RhoA GTP/GDP exchange reaction. A, schematic representation of the inhibitor peptides. The peptide names (left) include number ranges that correspond to the amino acid sequences (right). B, inhibition of Net1-mediated RhoA GTP/GDP exchange with different inhibitor peptides (all at 0.5 mm). Symbols (from top to bottom) are: closed circles, no peptide; open circles, peptide 100–105; upward triangles, peptide 100–109; stars, peptide 96–102; large upward triangles, peptide 96–106; downward triangles, peptide 101–106; diamonds, peptide 102–106; and squares, peptide 100–106. C, inhibition of Net1-mediated RhoA GTP/GDP exchange with different concentrations of peptide 102–106. Symbols from top to bottom are: circles, no peptide (control); stars, 0.03 mm; diamonds, 0.0625 mm; downward triangles, 0.125 mm; upward triangles, 0.35 mm; and squares, 0.5 mm. The experiments were run at least three times independently. A representative curve is presented here. r.f.u., relative fluorescence units.
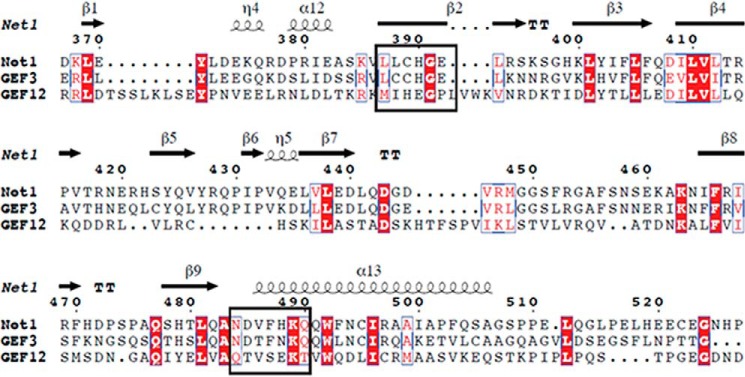
This finding indicated that the stabilization of PH on RhoA was mediated by a limited number of residues in the 102–106 segment of RhoA. Next, we estimated the selectivity of peptide 102–106 inhibition by measuring its effect on the guanine exchange activity of the two closest homologues of Net1, GEF3 and GEF12 (16) (Fig. 12, A and B). We found that 0.5 mm peptide 102–106 did not significantly inhibit GEF3 and GEF12 activities. The inefficient effect of peptide 102–106 on GEF12 could be explained by the difference in the PH/RhoA interfaces observed in the crystal structures. The inability of peptide 102–106 to inhibit GEF3 was unexpected because the Net1 and GEF3 sequences varied by only a single amino acid in this region where both proteins seem to interact (His488 in Net1 versus Asn436 in GEF3; Fig. 13). This finding suggests that His488 is a driving residue for the peptide recognition and the selectivity process. To confirm this hypothesis, the activities of mutated Net1 (H488A and H488N) and GEF3 (N436H) were measured in the presence of peptide 102–106. Mutation of H488N or of H488A made NET1 insensitive to peptide 102–106, whereas sensitivity to the peptide was partially restored for the mutated GEF3 N436H (Fig. 14). These results confirmed that (i) the peptide mimics the binding of RhoA to Net1 PH domain and (ii) the selectivity is driven by the residue His488.
Figure 12.
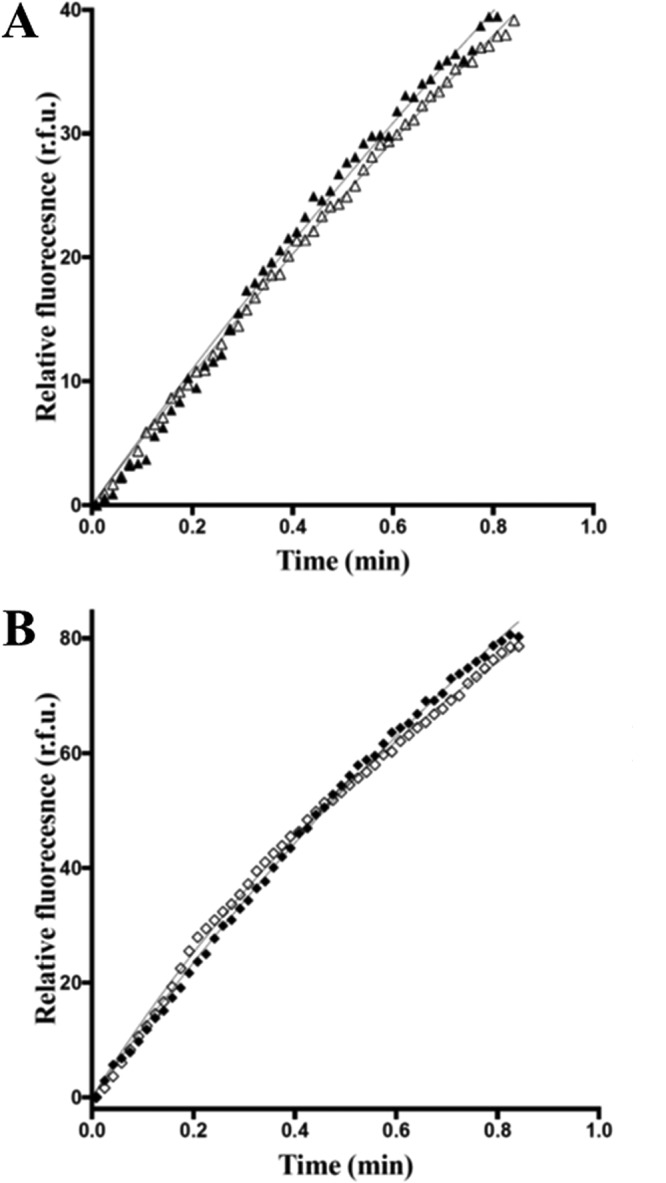
Biochemical characterization of GTP/GDP exchange activities for GEF3/RhoA and GEF12/RhoA complexes. A, GEF3-mediated RhoA GTP/GDP exchange reaction is not inhibited by 0. 5 mm inhibitor peptide 102–106. RhoA exchange activity was measured in the presence of GEF3 (10 μm; dark triangles) or in the presence of both GEF3 (10 μm) and peptide 102–106 (0.5 mm; open triangles). B, GEF12-mediated RhoA GTP/GDP exchange reaction is not inhibited by 0.5 mm inhibitor peptide 102–106. RhoA exchange activity was measured in the presence of GEF12 (0.05 μm; dark squares) or in the presence of both GEF12 (0.05 μm) and peptide 102–106 (0.5 mm; open squares). The experiments were run at least three times independently. A representative curve is presented here. r.f.u., relative fluorescence units.
Figure 13.
Sequence alignment of Net1, GEF3, and GEF12. Amino acid sequences of Net1-PH, GEF3, and GEF12 were aligned with European Molecular Biology Laboratory-European Bioinformatics Institute Clustal Omega. Secondary structure attributions for Net1-PH (Protein Data Bank code 4XH9; indicated above the corresponding sequences) were identified with the DSSP program. Residues involved in the Net1-PH/RhoA formation are enclosed in boxes.
Figure 14.
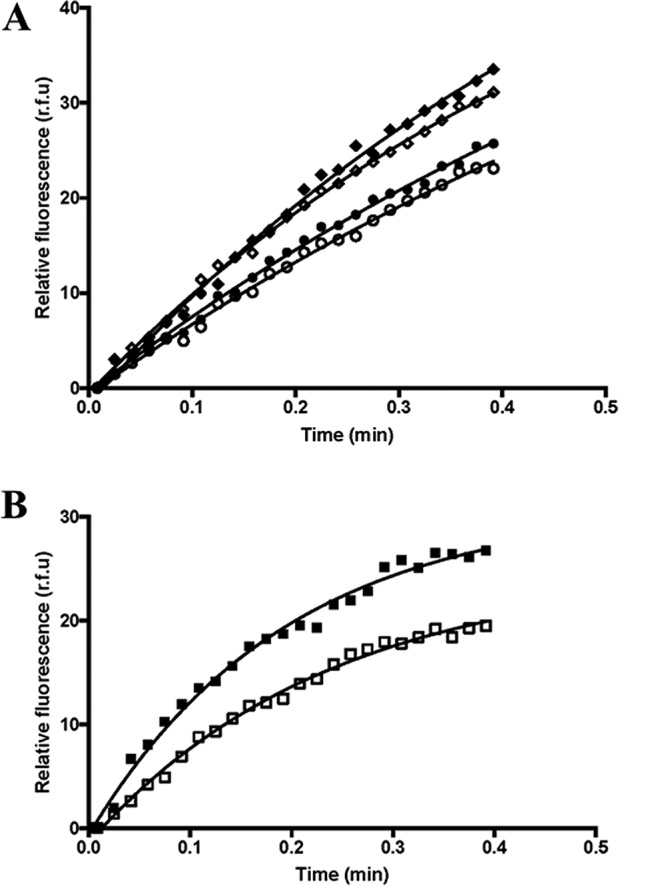
Further biochemical characterization of peptide 102–106 inhibition of the GTP/GDP exchange activities for mutated Net1/RhoA and GEF3/RhoA. A, the Net1-mediated RhoA GTP/GDP exchange reaction was measured in the presence (open symbols) or absence (dark symbols) of 0.5 mm peptide 102–106. Mutated Net1 (H488N (diamonds) or H488A (circles)) was used in those assays together with RhoA. B, the GEF3 N436H mutant–mediated RhoA GTP/GDP exchange reaction was measured in the presence (open symbols) or absence (dark symbols) of 0.5 mm peptide 102–106. The experiments were run at least three times independently. A representative curve is presented here. r.f.u., relative fluorescence units.
To summarize, a hot spot has been identified at the Net1/RhoA interface, and structure-activity analysis of key residues of peptide 102–106 (EVKHF) led to the identification of three functional groups that will help to generate pharmacophore models representing all necessary functional properties in the appropriate spacing and 3D orientation required to facilitate compound optimization: a scaffold (made by the His105 imidazole ring) and a hydrophobic pocket suitable to improve the lipophilic properties during the lead generation (Phe106 phenyl ring) as well as an array to develop the compound selectivity (toward the targeting of Net1 His488).
In conclusion, the search for new approaches for identifying molecules for fighting cancer remains dramatically important. Gaining a better understanding of the molecular nature of relationships that regulate protein/protein interactions will facilitate achieving this goal. However, when the target of interest is neither an enzyme nor a receptor, the nature of the protein/protein interaction that regulates the complex is often a flat surface where hot spots are either difficult to find or simply do not exist (31). An abundance of technologies has been described in the last few years that have facilitated the achievement of this difficult task. In some cases, those efforts have provided patients with less toxic, more specific, tolerable compounds and ultimately drugs (32). Consequently, it is recommended that three paradigms should be revisited: (i) finding specific proteins involved in subclasses of diseases, (ii) improving the descriptions and thus the understanding of protein/protein interactions at the molecular level (33, 34), and (iii) demonstrating that even “flat” surfaces can be druggable, particularly with peptides or macrocycles, which are good starting points for that type of discovery program (35). Here, we used a simple biochemical approach to produce the two partners of the Net1/RhoA complex. This study was the first to solve their cocrystal structure and thus the structure of this type of complex. From there, we used modern molecular dynamics tools to describe the behavior of the complex and the nature of the interface between these proteins. Then we designed short peptide sequences and showed that small sequences could interfere with the interaction between RhoA and Net1, which led to the impairment of RhoA catalytic activity. Although much remains to be undertaken before reaching patients, these results exemplify the technical and strategic avenues that can lead to progress.
Experimental procedures
Reagents and peptides
All reagents used in the present work were of analytical grade or better. Peptides were custom synthesized by Genepep (St. Jean de Vedas, France). In brief, they were synthesized with the solid-phase synthesis method, cleaved off the resin, purified, and thoroughly analyzed with HPLC and MS. Peptide purity was systematically higher than 98% as judged by both techniques.
Plasmids and recombinant proteins
Two plasmids were constructed; one carried the sequence encoding human RhoA (residues 2–180) with an F25N mutation, and the other carried the sequence encoding human Net1 (residues 149–501). Both constructs were cloned into pET28 and expressed in Escherichia coli BL21 RIL (DE3) cells as His6-tagged proteins (N-terminal tag plus a TEV cleavage site for RhoA and a C-terminal tag for Net1). The cells were grown overnight at 17 °C in autoinduction medium (36). Cells were harvested by centrifugation and resuspended in lysis buffer (50 mm Tris, p H8, 250 mm NaCl, 10% (w/v) glycerol, 10 mm MgCl2, 1 mm PMSF, 20 mm MgSO4) in the presence of 10 mg of DNase and 250 mg/liter lysozyme per liter of buffer. During the isolation of RhoA, all buffers, from lysis to the final purification step, were supplemented with 50 μm GDP. The proteins were purified independently, but in a similar fashion, on HisTrap FF crude columns (5 ml). After loading the sample, the column was washed with 20 volumes of wash buffer (50 mm Tris, pH 8, 250 mm NaCl, 10 mm MgCl2, 50 μm GDP, 10% (w/v) glycerol). The protein was eluted with 50 mm Tris, pH 8, 250 mm NaCl, 10 mm MgCl2, 10% (w/v) glycerol, 250 mm imidazole.
For RhoA purification, the protein was then desalted in 20 mm Tris, pH 8, 250 mm NaCl, 2 mm DTT, 5% glycerol, 1 mm MgCl2, 50 μm GDP and cleaved overnight with TEV protease at 4 °C. The sample was then passed through a HisTrap FF column equilibrated with cleavage buffer. Next, the sample was concentrated to 5 mg/ml. The protein was purified with gel-filtration chromatography (Superdex 200 26/60, GE Healthcare) in 20 mm Tris, pH 8, 10 mm HCl, 250 mm NaCl, 2 mm DTT, 5% glycerol, 1 mm MgCl2, 50 μm GDP.
For Net1 isolation, after the HisTrap FF purification step, Net1-DHPH was directly purified with gel-filtration chromatography (Superdex 200 26/60) in 20 mm Hepes, pH 7.5, 150 mm NaCl, 5% (w/v) glycerol, 2 mm DTT.
The Net1/RhoA complex was produced by incubating GDP-loaded RhoA with Net1-DHPH at a molar ratio of 2:1 for 10 min followed by overnight dialysis in 20 mm Tris, pH 7.1, 150 mm NaCl, 5 mm EDTA, 1 mm TCEP. A final gel-filtration step (Superdex 75 26/60) in 20 mm Tris, pH 7.2, 150 mm NaCl, 1 mm TCEP (Fig. 1) was used to isolate the RhoA/Net1-DHPH complex from free RhoA. The complex was concentrated to 12 mg/ml, and this sample was used for crystallization experiments.
Protein purification
Net1 (residues 149–501) H488N, Net1 (residues 149–501) H488A, and DH domain (residues 149–370)
The Net1 sequence encoding residues 149–370 was cloned into the pET15 plasmid and expressed in E. coli BL21 (DE3) cells as a His6-tagged protein (N-terminal tag with a TEV cleavage site).
H488A or H488N mutation was inserted following the QuikChange II site-directed mutagenesis (Agilent Technologies) procedure. Cells were grown in autoinduction medium at 20 °C. Net1 DH, Net1 H488N, and Net1 H488A were purified with the procedure described above for Net1(149–501).
PH domain (residues 358–501)
The Net1 sequence encoding residues 358–501 was cloned into the pET15 plasmid and expressed in E. coli BL21 (DE3) cells as a His6-maltose-binding protein–tagged protein (N-terminal tag with a TEV cleavage site). Cells were grown in LB medium at 17 °C after induction with 0.1 mm isopropyl β-d-1-thiogalactopyranoside. Harvested cells were resuspended in a lysis buffer of 50 mm Tris, 200 mm NaCl, 10% glycerol, 1 mm TCEP, pH 7.5, supplemented with DNase and antiproteases. Cells were lysed at 30 p.s.i. with a cell disruptor. Net1(358–501) was initially purified with affinity chromatography in 50 mm Tris, 200 mm NaCl, 10% glycerol, 1 mm TCEP, pH 7.5, ±500 mm imidazole. Then it was purified with the procedure described above for Net1(149–501). Fractions of interest were further purified with gel-filtration chromatography on Superdex 75 26/60 pre-equilibrated with 50 mm Tris, 200 mm NaCl, 10% glycerol, 1 mm TCEP, pH 7.5. Pure fractions were pooled and incubated with 1:20 TEV overnight at 4 °C under slow agitation. The mixture was diluted (×4) in 50 mm Hepes, 10% glycerol, 1 mm TCEP, pH 7.3, to achieve a final concentration of 50 mm NaCl. The sample was then loaded on a HiTrap SP column (5 ml) that had been pre-equilibrated in 50 mm Hepes, 50 mm NaCl, 10% glycerol, 1 mm TCEP, pH 7.3, at a flow rate of 6 ml/min. Flow-through fractions were saved. Elution was performed with a salt gradient (50–500 mm) in 35 min at a flow rate of 2 ml/min.
ARHGEF3 (residues Ser94–Glu449) and ARHGEF3 (residues Ser94–Glu449) N436H
The gene encoding the DH-PH domain (Ser94–Glu449) of Homo sapiens GEF3 was cloned into the pET15 vector as a His6-tagged protein (C-terminal tag) and expressed in E. coli BL21 (DE3) cells in autoinduction medium at 17 °C. N436H mutation was inserted following the QuikChange II site-directed mutagenesis procedure. ARHGEF3 (WT and N436H) were purified with the procedure described above for Net1(149–501).
ARHGEF12 (residues Asn768–Ser1138 with a Y973F mutation)
The gene encoding the DH-PH domain (Asn768–Ser1138) of H. sapiens GEF12 was cloned into the pET15 vector with both a maltose-binding protein tag (N-terminal tag with TEV) and a His6 tag (C-terminal tag). The protein was expressed in E. coli BL21 RIL (DE3) cells in autoinduction medium at 17 °C. ARHGEF12 was initially purified with affinity chromatography according to the procedure described above for Net1(149–501). Then samples containing ARHGEF12 were pooled and immediately dialyzed overnight at 4 °C in the presence of TEV protease (1:20) against 50 mm Tris, 200 mm NaCl, 10% glycerol, 1 mm TCEP, pH 7.5. Samples were then passed through a HisTrap HP (5-ml) nickel-nitrilotriacetic acid column and eluted with a gradient of 5–50% B (buffer supplemented with 500 mm imidazole) in 50 min at a flow rate of 2 ml/min. Fractions of interest were applied to a Superdex 75 26/60 column that had been pre-equilibrated with 50 mm Tris, 200 mm NaCl, 10% glycerol, 1 mm TCEP, pH 7.5.
1H NMR analysis of Net1 PH domain (residues 358–501)
A 200-μl volume of protein was brought to a concentration of 1.8 mg/ml (104.8 μm) in 20 mm Tris, 200 mm NaCl, 10% glycerol, 1 mm TCEP, pH 7.5. This solution was mixed with 20 μl of D2O (Cambridge Isotopes Laboratory) and placed in a 3-mm NMR tube (Wilmad 307-PP-7). The NMR experiment was performed at 20 °C on a Bruker AVANCE III HD spectrometer equipped with a QCI-F cryoprobe, operating at 500.13 MHz. The spectrum was analyzed with the TopSpin 3.2 program. Protein folding was evaluated based on the presence of a wide range of NH signals in the region of 8.0–9.6 ppm and aliphatic signals in the region of −0.6 to 0.5 ppm. Analysis of the dispersion of the NMR signals in the regions of the methyl protons (0.5–1.5 ppm), α-protons (3.5–6 ppm), and amide protons (6–10 ppm) confirmed the folding of the Net1-PH purified protein (37).
Analytic gel-filtration chromatography of the Net1 PH domain/RhoA complex
Retention profiles of Net1-PH in the presence or absence of RhoA were analyzed with gel-filtration chromatography. As controls, 7 nmol of Net1-PH and 7 nmol of RhoA were loaded on Superdex 75 10/300 GL that had been pre-equilibrated in 20 mm Tris, 100 mm NaCl, 5% glycerol, 0.5 mm TCEP, pH 7.5. To analyze the complex, 7 nmol of Net1-PH and 7 nmol of RhoA were preincubated for 2 h at 4 °C before the gel-filtration analysis. A ratio of 2:1 was also analyzed with the same procedure by mixing 20 nmol of Net1-PH with 10 nmol of RhoA.
Crystallization and structure determination
The RhoA/Net1-DHPH complex was crystallized at 20 °C with the hanging drop vapor diffusion method. Crystals appeared overnight in drops composed of 1 μl of protein solution mixed with 1 μl of the reservoir solution, which contained 0.1 m Bistris propane, pH 7.5, 20% PEG 3350, and 0.2 m tripotassium phosphate. Crystals were flash frozen in reservoir solution supplemented with 15% glycerol. Data were collected at 100 K (after annealing) from the synchrotron radiation beamline ID23 (European Synchrotron Radiation Facility, Grenoble, France). Data were processed with the XDS program (38) and scaled with the SCALA program in the CCP4 suite (39). The initial phase information was obtained by performing molecular replacement with Phaser from the CCP4 suite, and a model was built from our own crystal structure of the apoNet1 DH domain (data not shown) combined with RhoA. The initial densities were improved further by applying solvent flattening and histogram matching with RESOLVE from the Phenix suite (40, 41). Then the PH domain of RhoGEF3 (Protein Data Bank code 2Z0Q) was density-fitted with Phaser to improve the density map of the DH domain. The model was finally improved by applying iterative cycles of model building and refinement with Coot (42) and Refine (Phenix suite) (40, 41). Here, we present the data measurements (Table 3) and model refinement statistics (Table 4). Coordinate files and associated experimental data have been deposited in the Protein Data Bank under accession code 4XH9.
Table 3.
Crystallographic data collection and processing
Data collection and processing were conducted at the European Synchrotron Radiation Facility (Grenoble, France) on the ID23-1 beamline. Values in parentheses represent the outer shell.
| Parameter | Value |
|---|---|
| Wavelength (Å) | 0.97 |
| Temperature (K) | 100 |
| Detector | Pilatus 6M |
| Crystal–detector distance (mm) | 250 |
| Rotation range per image (°) | 1 |
| Total rotation range (°) | 200 |
| Exposure time per image (s) | 0.5 |
| Space group | P1211 |
| a, b, c (Å) | 54.1, 101.4, 116.2 |
| α, β, γ (°) | 90.0, 94.3, 90.0 |
| Resolution range (Å) | 34.0–2.0 (2.1–2.0) |
| No. of unique reflections | 83,900 |
| Completeness (%) | 96 (90.4) |
| Redundancy | 3.4 (3.4) |
| [I/σ(I)] | 13.9 (3.9) |
| Rr.i.m. | 0.07 (0.42)a |
| Overall B factor from Wilson plot (Å2) | 26.3 |
a Estimated by multiplying the conventional Rmerge value by the factor [N/(N − 1)]1/2.
Table 4.
Crystal parameters, data collection, and refinement
DPI, dispersion precision indicator.
| Parameter | Value |
|---|---|
| Crystal parameters | |
| Resolution range (Å) | 35.0–2.0 |
| Completeness (%) | 99.4 |
| σ cutoff | 2.0 |
| No. of reflections, working set | 83,896 |
| No. of reflections, test set | 4,194 |
| Final Rcryst | 0.18 |
| Final Rfree | 0.21 |
| Cruickshank DPI | 0.144 |
| No. of non-H atoms | 9,206 |
| Protein | 8,269 |
| Water | 921 |
| Refinement statistics | |
| r.m.s.d. values | |
| Bonds (Å) | 0.012 |
| Angles (°) | 1.39 |
| Average B factors (Å2) | 35 |
| Protein | 29 |
| Water | 78 |
| Ramachandran plot | |
| Most favored (%) | 97.2 |
| Allowed (%) | 2.4 |
Molecular modeling and simulations
Molecular modeling and simulation protocols were used to study, in atomic detail, the structural stability of Net1. The following systems were simulated: (i) Net1 and (ii) the Net1/RhoA complex. Each system was built with a template of our crystal structure of Net1 in complex with RhoA. Missing loops were modeled with the SWISS-MODEL web interface (43). Hydrogen atoms were added to the protein with the web-based H++ server, which assigned protonation states to all titratable residues at the chosen pH of 7.0 (44). Each system was immersed in a TIP3P water box (45) and neutralized with the appropriate number of counterions (46).
Molecular dynamics simulation protocols
Standard molecular dynamics simulations were performed with the pmemd.cuda module provided in the AMBER14 suite of programs (47) with the ff14SB force field (48). The cutoff distance for the nonbonded interactions was 10 Å, and periodic boundary conditions were applied. Long-range electrostatic interactions were treated with the particle mesh Ewald method (49). The SHAKE algorithm was applied to all bonds involving hydrogens (50), and an integration step of 2 fs was used throughout. Each system was studied with two 100-ns replicas of unrestrained molecular dynamics simulations, run at a constant temperature (300 K) and pressure (1 atm) with the weak coupling algorithm (51).
Analysis methods
Three-dimensional structures were inspected with the computer graphics programs PyMOL (52) and VMD (53). Interatomic distances, angles, and r.m.s.d. values were monitored with the “cpptraj” module in AmberTools15 (47). The last 80 ns of the molecular dynamics trajectories of each system were used to construct two-dimensional normalized density maps. The maps showed the conformational states of Net1 in the presence and absence of RhoA based on two selected collective variables. The first variable, x, corresponded to the r.m.s.d. of the backbone atoms of residues 357–368. It was calculated after aligning only residues 158–354 of the DH domain; the crystal structure of Net1 in complex with RhoA (Protein Data Bank entry 4XH9) was used as reference. The second variable, y, corresponded to the DH-PH angle; i.e. the angle between the α-carbons of residues Gln337, Leu355 (DH domain), and I496 (PH domain). We identified the dominant residues that contributed energy to the formation of the Net1-PH/RhoA complex by calculating the binding free energies of the complex with MM-GBSA per-residue decomposition analysis as implemented in the MMPBSA.py software (54).
Guanine nucleotide exchange assay
In vitro nucleotide exchange assays measured the increase in fluorescence emitted over time upon incorporation of free mant-GTP into a GDP-loaded RhoA molecule. To analyze the inhibition of the GDP/mant-GTP exchange reaction, the time course of the change in fluorescence was recorded in the presence of increasing concentrations of peptides (0.03–0.5 mm). The peptide and 1 μm RhoA were mixed at 25 °C in 100 μl of 20 mm Hepes, pH 7, 150 mm NaCl, 1 mm MgCl2, 1 μm mant-GTP. The reaction was initiated with the addition of 1 μm Net1, 10 μm ARHGEF3, or 0.05 μm ARHGEF12.
Total fluorescence intensities were measured with a Varian Cary Eclipse Fluorescence Spectrophotometer (λex = 360 nm, λem = 440 nm).
Author contributions
A.-P. P., L. M. V., G. F., and J. A. B. conceptualization; A.-P. P. and J. A. B. data curation; A.-P. P. and J. A. B. formal analysis; A.-P. P. validation; A.-P. P., C. G.-P., and J. A. B.-C. investigation; A.-P. P., C. G.-P., J. A. B.-C., L. M. V., and G. F. methodology; A.-P. P., J. A. B.-C., L. M. V., and J. A. B. writing-original draft; A.-P. P., L. M. V., G. F., and J. A. B. writing-review and editing; J. A. B.-C. software; J. A. B. supervision.
Acknowledgment
We are indebted to Dr. Daniel Fletcher (College of Life Sciences, University of Dundee), for performing the RMN experiments.
The authors declare that they have no conflicts of interest with the contents of this article.
The atomic coordinates and structure factors (code 4XH9) have been deposited in the Protein Data Bank (http://wwpdb.org/).
- GEF
- guanine nucleotide exchange factor
- Net1
- neuroepithelial cell transforming gene 1
- DH
- Dbl homology
- PH
- pleckstrin homology
- TEV
- tobacco etch virus
- r.m.s.d.
- root mean square deviation
- MM-GBSA
- molecular mechanics energies with the generalized Born and surface area continuum solvation method
- TCEP
- tris(2-carboxyethyl)phosphine
- Bistris propane
- 1,3-bis[tris(hydroxymethyl)methylamino]propane
- mant-GTP
- 2′-/3′-O-(N′-methylanthraniloyl)guanosine-5′-O-triphosphate
- Wat
- water.
References
- 1. Burridge K., and Wennerberg K. (2004) Rho and Rac take center stage. Cell 116, 167–179 10.1016/S0092-8674(04)00003-0 [DOI] [PubMed] [Google Scholar]
- 2. Vega F. M., and Ridley A. J. (2016) The RhoB small GTPase in physiology and disease. Small GTPases 1–10 10.1080/21541248.2016.1253528 [DOI] [PMC free article] [PubMed] [Google Scholar]
- 3. Zandvakili I., Lin Y., Morris J. C., and Zheng Y. (2017) Rho GTPases: anti- or pro-neoplastic targets? Oncogene 36, 3213–3222 10.1038/onc.2016.473 [DOI] [PMC free article] [PubMed] [Google Scholar]
- 4. Loirand G., Scalbert E., Bril A., and Pacaud P. (2008) Rho exchange factors in the cardiovascular system. Curr. Opin. Pharmacol. 8, 174–180 10.1016/j.coph.2007.12.006 [DOI] [PubMed] [Google Scholar]
- 5. Loirand G., and Pacaud P. (2010) The role of Rho protein signaling in hypertension. Nat. Rev. Cardiol. 7, 637–647 10.1038/nrcardio.2010.136 [DOI] [PubMed] [Google Scholar]
- 6. Peng F., Wu D., Gao B., Ingram A. J., Zhang B., Chorneyko K., McKenzie R., and Krepinsky J. C. (2008) RhoA/Rho-kinase contribute to the pathogenesis of diabetic renal disease. Diabetes 57, 1683–1692 10.2337/db07-1149 [DOI] [PubMed] [Google Scholar]
- 7. Tao W., Wu J., Xie B. X., Zhao Y. Y., Shen N., Jiang S., Wang X. X., Xu N., Jiang C., Chen S., Gao X., Xue B., and Li C. J. (2015) Lipid-induced muscle insulin resistance is mediated by GGPPS via modulation of the RhoA/Rho kinase signaling pathway. J. Biol. Chem. 290, 20086–20097 10.1074/jbc.M115.657742 [DOI] [PMC free article] [PubMed] [Google Scholar]
- 8. Biro M., Munoz M. A., and Weninger W. (2014) Targeting Rho-GTPases in immune cell migration and inflammation. Br. J. Pharmacol. 171, 5491–5506 10.1111/bph.12658 [DOI] [PMC free article] [PubMed] [Google Scholar]
- 9. Koth A. P., Oliveira B. R., Parfitt G. M., de Quadres Buonocore J., and Barros D. M. (2014) Participation of group I p21-activated kinases in neuroplasticity. J. Physiol. 108, 270–277 10.1016/j.jphysparis.2014.08.007 [DOI] [PubMed] [Google Scholar]
- 10. Logé C., Wallez V., Scalbert E., Cario-Tourmaniantz C., Loirand G., Pacaud P., and Lesieur D. (2002) Rho-kinase inhibitors: pharmacomodulations on the lead compound Y-32885. J. Enzyme Inhib. Med. Chem. 17, 381–390 10.1080/1475636021000005659 [DOI] [PubMed] [Google Scholar]
- 11. Smithers C. C., and Overduin M. (2016) Structural mechanisms and drug discovery prospects of Rho GTPases. Cells 5, E26 10.3390/cells5020026 [DOI] [PMC free article] [PubMed] [Google Scholar]
- 12. Sanz-Moreno V., and Marshall C. J. (2010) The plasticity of cytoskeletal dynamics underlying neoplastic cell migration. Curr. Opin. Cell Biol. 22, 690–696 10.1016/j.ceb.2010.08.020 [DOI] [PubMed] [Google Scholar]
- 13. Ridley A. J. (2006) Rho GTPases and actin dynamics in membrane protrusions and vesicle trafficking. Trends Cell Biol. 16, 522–529 10.1016/j.tcb.2006.08.006 [DOI] [PubMed] [Google Scholar]
- 14. Cramer L. P. (1999) Organization and polarity of actin filament networks in cells: implications for the mechanism of myosin-based cell motility. Biochem. Soc. Symp. 65, 173–205 [PubMed] [Google Scholar]
- 15. Jaffe A. B., and Hall A. (2005) Rho GTPases: biochemistry and biology. Annu. Rev. Cell Dev. Biol. 21, 247–269 10.1146/annurev.cellbio.21.020604.150721 [DOI] [PubMed] [Google Scholar]
- 16. Rossman K. L., Der C. J., and Sondek J. (2005) GEF means go: turning on RHO GTPases with guanine nucleotide-exchange factors. Nat. Rev. Mol. Cell Biol. 6, 167–180 10.1038/nrm1587 [DOI] [PubMed] [Google Scholar]
- 17. Alberts A. S., and Treisman R. (1998) Activation of RhoA and SAPK/JNK signalling pathways by the RhoA-specific exchange factor mNET1. EMBO J. 17, 4075–4085 10.1093/emboj/17.14.4075 [DOI] [PMC free article] [PubMed] [Google Scholar]
- 18. Srougi M. C., and Burridge K. (2011) The nuclear guanine nucleotide exchange factors Ect2 and Net1 regulate RhoB-mediated cell death after DNA damage. PLoS One 6, e17108 10.1371/journal.pone.0017108 [DOI] [PMC free article] [PubMed] [Google Scholar]
- 19. Murray D., Horgan G., Macmathuna P., and Doran P. (2008) NET1-mediated RhoA activation facilitates lysophosphatidic acid-induced cell migration and invasion in gastric cancer. Br. J. Cancer 99, 1322–1329 10.1038/sj.bjc.6604688 [DOI] [PMC free article] [PubMed] [Google Scholar]
- 20. Qin H., Carr H. S., Wu X., Muallem D., Tran N. H., and Frost J. A. (2005) Characterization of the biochemical and transforming properties of the neuroepithelial transforming protein 1. J. Biol. Chem. 280, 7603–7613 10.1074/jbc.M412141200 [DOI] [PubMed] [Google Scholar]
- 21. Leyden J., Murray D., Moss A., Arumuguma M., Doyle E., McEntee G., O'Keane C., Doran P., and MacMathuna P. (2006) Net1 and Myeov: computationally identified mediators of gastric cancer. Br. J. Cancer 94, 1204–1212 10.1038/sj.bjc.6603054 [DOI] [PMC free article] [PubMed] [Google Scholar]
- 22. Ye K., Chang S., Li J., Li X., Zhou Y., and Wang Z. (2014) A functional and protein-protein interaction analysis of neuroepithelial cell transforming gene 1 in hepatocellular carcinoma. Tumour Biol. 35, 11219–11227 10.1007/s13277-014-2454-3 [DOI] [PubMed] [Google Scholar]
- 23. Fang L., Zhu J., Ma Y., Hong C., Xiao S., and Jin L. (2015) Neuroepithelial transforming gene 1 functions as a potential prognostic marker for patients with non-small cell lung cancer. Mol. Med. Rep. 12, 7439–7446 10.3892/mmr.2015.4385 [DOI] [PubMed] [Google Scholar]
- 24. Diviani D., Raimondi F., Del Vescovo C. D., Dreyer E., Reggi E., Osman H., Ruggieri L., Gonano C., Cavin S., Box C. L., Lenoir M., Overduin M., Bellucci L., Seeber M., and Fanelli F. (2016) Small-molecule protein-protein interaction inhibitor of oncogenic Rho signaling. Cell Chem. Biol. 23, 1135–1146 10.1016/j.chembiol.2016.07.015 [DOI] [PubMed] [Google Scholar]
- 25. Derewenda U., Oleksy A., Stevenson A. S., Korczynska J., Dauter Z., Somlyo A. P., Otlewski J., Somlyo A. V., and Derewenda Z. S. (2004) The crystal structure of RhoA in complex with the DH/PH fragment of PDZRhoGEF, an activator of the Ca2+ sensitization pathway in smooth muscle. Structure 12, 1955–1965 10.1016/j.str.2004.09.003 [DOI] [PubMed] [Google Scholar]
- 26. Kristelly R., Gao G., and Tesmer J. J. (2004) Structural determinants of RhoA binding and nucleotide exchange in leukemia-associated Rho guanine-nucleotide exchange factor. J. Biol. Chem. 279, 47352–47362 10.1074/jbc.M406056200 [DOI] [PubMed] [Google Scholar]
- 27. Cierpicki T., Bielnicki J., Zheng M., Gruszczyk J., Kasterka M., Petoukhov M., Zhang A., Fernandez E. J., Svergun D. I., Derewenda U., Bushweller J. H., and Derewenda Z. S. (2009) The solution structure and dynamics of the DH-PH module of PDZRhoGEF in isolation and in complex with nucleotide-free RhoA. Protein Sci. 18, 2067–2079 10.1002/pro.219 [DOI] [PMC free article] [PubMed] [Google Scholar]
- 28. Lenoir M., Sugawara M., Kaur J., Ball L. J., and Overduin M. (2014) Structural insights into the activation of the RhoA GTPase by the lymphoid blast crisis (Lbc) oncoprotein. J. Biol. Chem. 289, 23992–24004 10.1074/jbc.M114.561787 [DOI] [PMC free article] [PubMed] [Google Scholar]
- 29. Abdul Azeez K. R., Knapp S., Fernandes J. M., Klussmann E., and Elkins J. M. (2014) The crystal structure of the RhoA-AKAP-Lbc DH-PH domain complex. Biochem. J. 464, 231–239 10.1042/BJ20140606 [DOI] [PMC free article] [PubMed] [Google Scholar]
- 30. Schaefer A., Reinhard N. R., and Hordijk P. L. (2014) Toward understanding RhoGTPase specificity: structure, function and local activation. Small GTPases 5, 6 10.4161/21541248.2014.968004 [DOI] [PMC free article] [PubMed] [Google Scholar]
- 31. Blundell T. L., Sibanda B. L., Montalvão R. W., Brewerton S., Chelliah V., Worth C. L., Harmer N. J., Davies O., and Burke D. (2006) Structural biology and bioinformatics in drug design: opportunities and challenges for target identification and lead discovery. Philos. Trans. R. Soc. Lond. B Biol. Sci. 361, 413–423 10.1098/rstb.2005.1800 [DOI] [PMC free article] [PubMed] [Google Scholar]
- 32. Kotschy A., Szlavik Z., Murray J., Davidson J., Maragno A. L., Le Toumelin-Braizat G., Chanrion M., Kelly G. L., Gong J. N., Moujalled D. M., Bruno A., Csekei M., Paczal A., Szabo Z. B., Sipos S., et al. (2016) The MCL1 inhibitor S63845 is tolerable and effective in diverse cancer models. Nature 538, 477–482 10.1038/nature19830 [DOI] [PubMed] [Google Scholar]
- 33. Ma B., and Nussinov R. (2014) Druggable orthosteric and allosteric hot spots to target protein-protein interactions. Curr. Pharm. Des 20, 1293–1301 10.2174/13816128113199990073 [DOI] [PMC free article] [PubMed] [Google Scholar]
- 34. Renaud J. P., Chung C. W., Danielson U. H., Egner U., Hennig M., Hubbard R. E., and Nar H. (2016) Biophysics in drug discovery: impact, challenges and opportunities. Nat. Rev. Drug Discov. 15, 679–698 10.1038/nrd.2016.123 [DOI] [PubMed] [Google Scholar]
- 35. Dougherty P. G., Qian Z., and Pei D. (2017) Macrocycles as protein-protein interaction inhibitors. Biochem. J. 474, 1109–1125 10.1042/BCJ20160619 [DOI] [PMC free article] [PubMed] [Google Scholar]
- 36. Studier F. W. (2005) Protein production by auto-induction in high density shaking cultures. Protein Expr. Purif. 41, 207–234 10.1016/j.pep.2005.01.016 [DOI] [PubMed] [Google Scholar]
- 37. Page R., Peti W., Wilson I. A., Stevens R. C., and Wüthrich K. (2005) NMR screening and crystal quality of bacterially expressed prokaryotic and eukaryotic proteins in a structural genomics pipeline. Proc. Natl. Acad. Sci. U.S.A. 102, 1901–1905 10.1073/pnas.0408490102 [DOI] [PMC free article] [PubMed] [Google Scholar]
- 38. Kabsch W. (2010) XDS. Acta Crystallogr. D Biol. Crystallogr. 66, 125–132 10.1107/S0907444909047337 [DOI] [PMC free article] [PubMed] [Google Scholar]
- 39. Winn M. D., Ballard C. C., Cowtan K. D., Dodson E. J., Emsley P., Evans P. R., Keegan R. M., Krissinel E. B., Leslie A. G., McCoy A., McNicholas S. J., Murshudov G. N., Pannu N. S., Potterton E. A., Powell H. R., et al. (2011) Overview of the CCP4 suite and current developments. Acta Crystallogr. D Biol. Crystallogr. 67, 235–242 10.1107/S0907444910045749 [DOI] [PMC free article] [PubMed] [Google Scholar]
- 40. Zwart P. H., Afonine P. V., Grosse-Kunstleve R. W., Hung L. W., Ioerger T. R., McCoy A. J., McKee E., Moriarty N. W., Read R. J., Sacchettini J. C., Sauter N. K., Storoni L. C., Terwilliger T. C., and Adams P. D. (2008) Automated structure solution with the PHENIX suite. Methods Mol. Biol. 426, 419–435 10.1007/978-1-60327-058-8_28 [DOI] [PubMed] [Google Scholar]
- 41. Adams P. D., Afonine P. V., Bunkóczi G., Chen V. B., Davis I. W., Echols N., Headd J. J., Hung L. W., Kapral G. J., Grosse-Kunstleve R. W., McCoy A. J., Moriarty N. W., Oeffner R., Read R. J., Richardson D. C., et al. (2010) PHENIX: a comprehensive Python-based system for macromolecular structure solution. Acta Crystallogr. D Biol. Crystallogr. 66, 213–221 10.1107/S0907444909052925 [DOI] [PMC free article] [PubMed] [Google Scholar]
- 42. Emsley P., and Cowtan K. (2004) Coot: model-building tools for molecular graphics. Acta Crystallogr. D Biol. Crystallogr. 60, 2126–2132 10.1107/S0907444904019158 [DOI] [PubMed] [Google Scholar]
- 43. Biasini M., Bienert S., Waterhouse A., Arnold K., Studer G., Schmidt T., Kiefer F., Gallo Cassarino T., Bertoni M., Bordoli L., and Schwede T. (2014) SWISS-MODEL: modelling protein tertiary and quaternary structure using evolutionary information. Nucleic Acids Res. 42, W252–W258 10.1093/nar/gku340 [DOI] [PMC free article] [PubMed] [Google Scholar]
- 44. Anandakrishnan R., Aguilar B., and Onufriev A. V. (2012) H++ 3.0: automating pK prediction and the preparation of biomolecular structures for atomistic molecular modeling and simulations. Nucleic Acids Res. 40, W537–W541 10.1093/nar/gks375 [DOI] [PMC free article] [PubMed] [Google Scholar]
- 45. Jorgensen W. L., Chandrasekhar J., Madura J. D., Impey R. W., and Klei M. L. (1983) Comparison of simple potential functions for simulating liquid water. J. Chem. Phys. 79, 926–935 10.1063/1.445869 [DOI] [Google Scholar]
- 46. Aaqvist J. (1990) Ion-water interaction potentials derived from free energy perturbation simulations. J. Phys. Chem. 94, 8021–8024 10.1021/j100384a009 [DOI] [Google Scholar]
- 47. Case D. A., Babin V., Berryman J. T., Betz R. M., Cerutti D. S., Cheatham T. E., Darden T. A., Duke R. E., Gohlke H., Goetz A. W., Gusarov S., Homeyer N., Janowski P., Kaus J., Kovalenko A., et al. (2014) AmberTools15, University of California, San Francisco [Google Scholar]
- 48. Maier J. A., Martinez C., Kasavajhala K., Wickstrom L., Hauser K. E., and Simmerling C. (2015) ff14SB: improving the accuracy of protein side chain and backbone parameters from ff99SB. J. Chem. Theory Comput. 11, 3696–3713 10.1021/acs.jctc.5b00255 [DOI] [PMC free article] [PubMed] [Google Scholar]
- 49. Darden T., York D., and Pedersen L. (1993) Particle mesh Ewald: an N·log(N) method for Ewald sums in large systems. J. Chem. Phys. 98, 10089–10092 10.1063/1.464397 [DOI] [Google Scholar]
- 50. Andersen H. C. (1983) Rattle: a “velocity” version of the shake algorithm for molecular dynamics calculations. J. Comp. Phys. 52, 24–34 10.1016/0021-9991(83)90014-1 [DOI] [Google Scholar]
- 51. Berendsen H. J. C., Postma J. P. M., van Gunsteren W. F., DiNola A., and Haak J. R. (1984) Molecular dynamics with coupling to an external bath. J. Chem. Phys. 81, 3684–3690 10.1063/1.448118 [DOI] [Google Scholar]
- 52. DeLano W. L. (2012) The PyMOL Molecular Graphics System, version 1.5.0.1, Schrödinger, LLC, New York [Google Scholar]
- 53. Humphrey W., Dalke A., and Schulten K. (1996) VMD: visual molecular dynamics. J Mol. Graph. 14, 33–38 10.1016/0263-7855(96)00018-5 [DOI] [PubMed] [Google Scholar]
- 54. Miller B. R. 3rd, McGee T. D. Jr., Swails J. M., Homeyer N., Gohlke H., and Roitberg A. E. (2012) MMPBSA.py: an efficient program for end-state free energy calculations. J. Chem. Theory Comput. 8, 3314–3321 10.1021/ct300418h [DOI] [PubMed] [Google Scholar]


