

Abstract
Purpose
MR acoustic radiation force imaging (MR-ARFI) provides a method to visualize the focal spot of a focused ultrasound (FUS) beam without introducing a significant temperature rise. With conventional spoiled MR-ARFI pulse sequences, the ARFI phase always equals the motion-encoded phase. In this work, MR-ARFI using transition band balanced steady-state free precession (bSSFP) is presented, which improves the sensitivity of MR-ARFI with high acquisition speed.
Theory and Methods
Motion-encoding gradients (MEG) are inserted into bSSFP sequences for MR-ARFI. By applying an ultrasound pulse during the MEG, motion-encoded phase is generated, which leads to an amplified change in the image phase when operating in the bSSFP transition band. MR-ARFI was performed on a homemade gel phantom using both the proposed technique and a spoiled-GRE ARFI sequence with identical MEG and FUS, and ARFI images were compared.
Results
The bSSFP-ARFI sequence generated an ARFI image phase that is more than 5 times larger than the motion-encoded phase in a few seconds with 2DFT readout. By keeping FUS pulses as short as 1.45 ms, temperature rise was insignificant during the measurement.
Conclusion
bSSFP-ARFI has enhanced sensitivity compared to conventional MR-ARFI pulse sequences, and could provide an efficient way to visualize the focal spot.
Keywords: MRgFUS, MR-ARFI, transition band, bSSFP, high sensitivity
Introduction
MR-guided focused ultrasound (MRgFUS) is an increasingly important non-surgical medical intervention technique. By focusing the ultrasound beam, thermal and mechanical effects of ultrasound can be delivered to prescribed targets inside the human body while having minimal effect on tissue in the beam pathway. Thermal ablation with MRgFUS has been used to treat various diseases in different parts of the body (1–8). One important step before ablative treatments is to visualize the ultrasound focus for accurate targeting, which is typically performed by applying interrogation sonications to raise the temperature by a few degrees at the focal spot and measure the proton resonance frequency (PRF) shift of aqueous tissues (9,10). However, unwanted thermal dose is still deposited by the interrogation sonications, especially in well-perfused organs like the liver where a substantial amount of energy is needed to generate a measurable temperature rise (11). Moreover, this method doesn't work in adipose tissues, for which PRF is not temperature dependent (12).
Another technique that can be used to visualize the ultrasound focal spot is magnetic resonance acoustic radiation force imaging (MR-ARFI), in which image contrast is generated by the tissue displacement induced by the ultrasound radiation force (13,14). This technique does not depend on PRF shift and therefore can be used for both aqueous and adipose tissues. When ultrasound is absorbed, a force is exerted on the tissue along the beam direction. This force is strongest at the focus and can cause displacement on the order of micrometers with typical high-intensity focused ultrasound (HIFU) transducers (13). By synchronizing pulses of focused ultrasound (FUS) with motion-encoding gradients (MEG), spins at the focal spot experience an additional amount of precession, which shows up as a phase change in MR images. The basic motion-sensitization method used for MR-ARFI is identical to that used for MR elastography, which also requires careful synchronization of MEGs with the induced motion (15). FUS pulses of 5-20 ms have been used in MR-ARFI experiments to generate good contrast (16). Long TRs are usually used to keep the FUS duty cycle low to avoid heating and to achieve high SNR. The total acquisition time can be as long as two minutes with 2DFT readout (17). MR-ARFI using fast echo-planar imaging (EPI) readout has also been reported (11,18,19). EPI readout greatly shortens the total acquisition time, but by its nature is susceptible to geometric distortions induced by off-resonance.
Balanced steady-state free precession has been proposed for fMRI (20), thermometry (21,22), as well as motion detection (with alternating steady state) (23,24). In this work, we have developed a high sensitivity MR-ARFI pulse sequence by adding MEG to a balanced steady-state free precession (bSSFP) pulse sequence (25). The phase of transition-band bSSFP signal is very sensitive to the phase that individual spins accrue during each TR. This unique feature has been used for high sensitivity functional MRI (fMRI) (26) and MR-thermometry (27), since both brain activation and temperature rise can induce a change in the off-resonance frequency that leads to additional phase accumulation. In the proposed bSSFP-ARFI technique, spins at the focal spot accrue additional phase through motion encoding, and the image phase changes by an amount that is larger than the motion-encoded phase itself. We compared MR-ARFI images acquired using both bSSFP-ARFI and spoiled GRE (spGRE) ARFI pulse sequences in a homemade gel phantom. With identical FUS pulses and MEG, bSSFP-ARFI showed higher sensitivity and contrast-to-noise ratio (CNR) time efficiency.
Theory
The bSSFP pulse sequence is highly efficient for fast imaging. There are no spoiling gradients and other gradients are exactly “balanced”, which means the net zeroth-order gradient moments are zero along all three axes within each TR cycle (28). Two important parameters of bSSFP are “off-resonance frequency” and “off-resonance phase”, which we will refer to as foff and βoff respectively. The off-resonance frequency foff is the difference between the scanner operating frequency and the PRF, which generally varies with spatial location, and βoff = foff·TR is the phase accrued per TR due to off-resonance. Usually TE = TR/2 in bSSFP sequences. As shown in Fig. 1, the phase of bSSFP signals is nearly constant within a large range around βoff = π (the “passband”), which means within a passband the transverse magnetization is almost completely refocused at TE = TR/2 (29). (Equivalently, passband can be achieved around βoff = 0 with 180° RF phase cycling). The signal experiences a sudden phase change of nearly π radians over a narrow frequency range centered at βoff = 0 (the “transition band”). The phase of the bSSFP signal is always independent of the RF tip angle, and interestingly, a small tip angle leads to a large signal magnitude in the transition band. To perform MR-ARFI, we can insert motion-encoding gradients into the bSSFP sequence to generate an additional motion-encoded phase βMEG = γ ∫GMEG(t)x(t)dt (Fig. 2), where γ is the proton gyromagnetic ratio, GMEG(t) is the MEG amplitude, and x(t) is the tissue displacement in response to the FUS pulse. Unlike spGRE or spin-echo MR-ARFI sequences in which the image phase ϕ changes by exactly the same amount as βMEG, the bSSFP-ARFI sequence yields a change in ϕ that is larger than βMEG when operating in the transition band.
Figure 1.
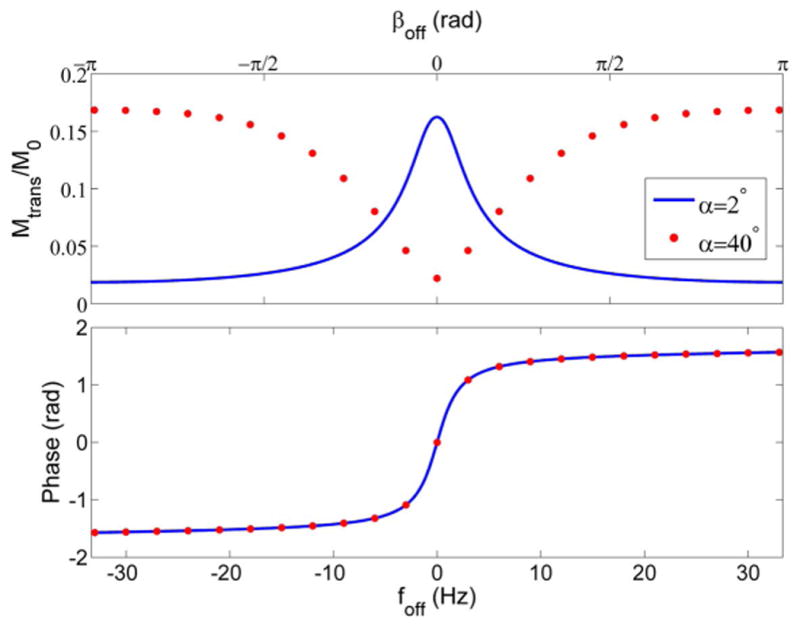
bSSFP signal magnitude and phase as a function of off-resonance phase/frequency at two different tip angles. Assumed values of T1 = 1000 ms, T2 = 100 ms, TR = 15 ms, TE = TR/2 were used to generate these curves.
Figure 2.
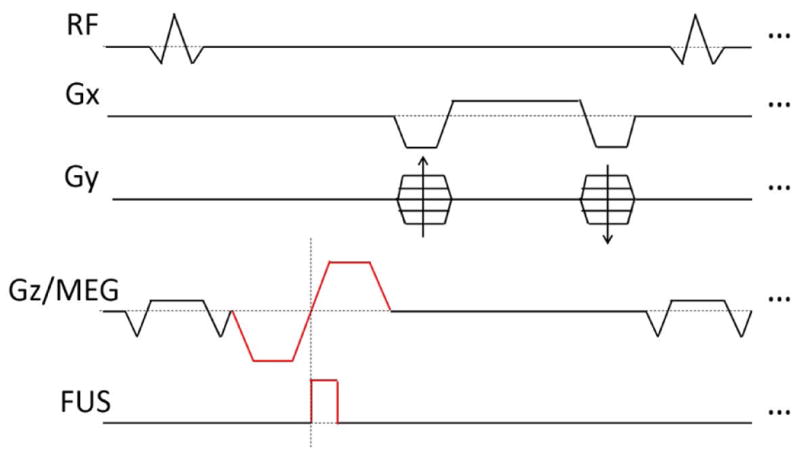
Diagram of the bSSFP-ARFI pulse sequence. The sequence is no longer perfectly symmetric in time and TE ≠ TR/2, but all gradients are still balanced. FUS pulses are synchronized with the second lobe of MEG.
Following the derivation in Ref. (30) for the steady-state bSSFP signal, the image phase ϕ is determined by the off-resonance phase βoff by:
| (1) |
where E2 ≡ e−TR/T2 The first term of Eq. 1 is the steady-state phase immediately after excitation, which is the origin of the sudden phase change. The second term is the additional phase accrued at TE due to off-resonance. On the other hand, for our bSSFP-ARFI pulse sequence, spins accrue phase from both off-resonance and motion encoding, and the image phase is determined by:
| (2) |
The steady-state magnetization depends on the sum of βoff and βMEG, as reflected in the first term of Eq. 2. The second term is the off-resonance phase accrual as in Eq. 1, and the third term is the motion-encoded phase accrued at TE, which depends on whether MEG occur before or after readout. If MEG are placed before readout, spins have been motion encoded already at TE and the third term equals βMEG. If MEG are placed after readout, spins have not experienced the motion-encoded phase yet at TE and the third term is zero. The bSSFP-ARFI image phase is plotted as a function of βMEG in Fig. 3a. The overall ARFI sensitivity can be calculated as the difference in image phase with and without βMEG divided by βMEG.
Figure 3.
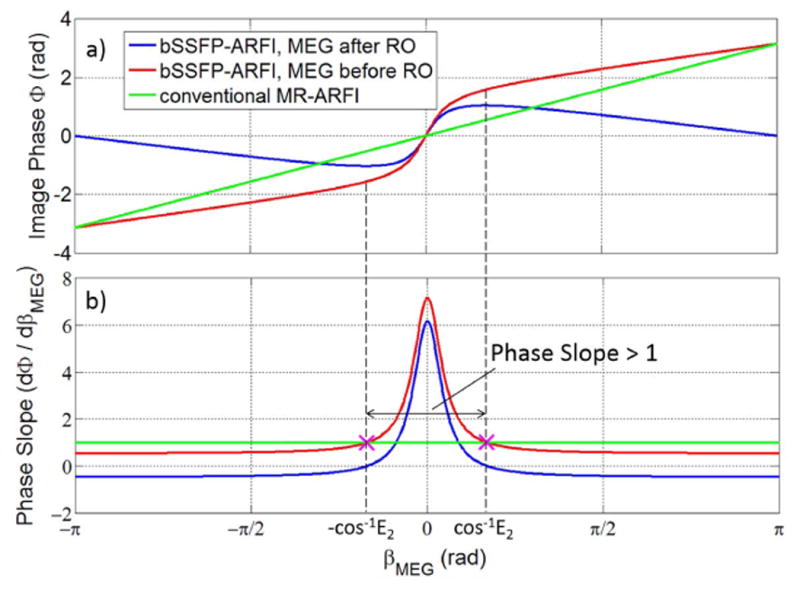
a): Image phase as a function of βMEG for bSSFP-ARFI and conventional spoiled MR-ARFI. b): Derivative of image phase with respect to βMEG (that is, the slope of the curves in a) for both approaches. The range of βMEG with phase slope greater than 1 (for MEG before readout) is also shown. For both a) and b) we assumed βoff = 0, T2 = 100 ms and TR = 15 ms. For nonzero βoff, the bSSFP-ARFI curves would be shifted (for example to the left or right), but the shape would stay the same.
We can calculate the slope of ϕ by taking the derivative of Eq. 2 with respect to βMEG:
| (3) |
Unlike conventional MR-ARFI that always has a phase slope of unity, bSSFP-ARFI has a phase slope greater than 1 for small βMEG (Fig. 3b, assuming βoff = 0). The largest slope occurs at βMEG = 0. Assuming TR ≪ T2, the peak slope is:
| (4) |
where the plus/minus signs are for MEG before/after readout. MEG before readout is more advantageous for ARFI since a slightly higher sensitivity can be achieved. For brain imaging, T2 values for gray matter and white matter at 3T are about 100 ms and 70 ms respectively (31), and a TR less than 15 ms can be achieved for the bSSFP-ARFI sequence. Therefore the sensitivity enhancement can be as high as 5 – 7 times for small βMEG when on resonance. As βMEG becomes large, the phase slope decreases as shown in Fig. 3b. It is therefore important to consider the range of βMEG for which dϕ/dβMEG > 1. Assume we place MEG before readout so the second term of Eq. 3 is +1. By setting Eq. 3 equal to 1 (and βoff equal to 0), we calculated that the limits of βMEG for the phase slope to be greater than 1 is ±cos-1E2.
We also compared the theoretical CNR efficiencies of the bSSFP-ARFI (with small βMEG and βoff = 0) and fast spGRE-ARFI sequences. Assume the spGre sequence is operated at the Ernst angle, and it has the same TR, TE, MEG and FUS as the bSSFP sequence. Ignoring the T2* effect and nonideal flip angle profile, the CNR efficiency ratio is calculated to be:
| (5) |
Where SenbSSFP and SenspGre are the phase sensitivities (with SenspGre = 1), SbSSFP and SspGre are the signal magnitudes, α is the flip angle, E2 ≡ e−TR/T2, and d = (1 − E1 cos α)(1 − E2) − E2(E1 − cos α)( E2 − 1). For α = 2°, TR = 15 ms, T1 = 1000 ms, T2 = 70 or 100 ms, the CNR efficiency of the bSSFP-ARFI sequence is 8 or 13 times higher. However, it is important to note that for βoff ≠ 0, both the bSSFP-ARFI phase sensitivity and signal magnitude are lower; therefore the CNR efficiency gain is smaller when the operating frequency is not exactly on resonance.
Methods
A homemade gel phantom (830 g pudding from a local grocery store, melted and mixed with 35 g of 225 bloom gelatin powder, T1 ∼ 1050 ms, T2 ∼ 88 ms) was used for this study. All MR images were acquired on a 3T GE MR750 scanner (GE Healthcare, Milwaukee, WI) with a single-channel local RF coil. Pulse sequences were developed using SpinBench (HeartVista, Inc. Menlo Park, CA) and implemented on the scanner with RTHawk (HeartVista, Inc. Menlo Park, CA). All images acquired in this study were 2D, with slice thickness = 3 mm, FOV = 12.8 cm and matrix size = 128×128. FUS was generated by a multi-element phased-array transducer (ExAblate 2000, Insightec, Haifa, Israel). The ultrasound pulse (1 MHz, 1.45 ms) was triggered by the scanner, and its acoustic power was 54 W. MEG were oriented parallel to the net direction of FUS propagation and perpendicular to the imaging slice. Each lobe of the MEG was 2.8 ms long, and the amplitude and duration of the plateau were 50 mT/m and 0.93 ms.
The pulse sequence shown in Fig. 2 was used to demonstrate bSSFP-ARFI, with FA = 2°, BW = 391Hz/pixel (9.2 mT/m), TE = 10.0 ms and TR = 14.7 ms. Scanner frequency and shimming gradients were adjusted to make the expected focal spot position on resonance. The steady-state magnetization was achieved by first acquiring a “dummy” image. A pair of images were acquired immediately afterwards. The first one, which was acquired without FUS application, was used as a baseline image. During acquisition of the second image, FUS pulses were triggered at the beginning of the second lobe of MEG. The ARFI-contrast image was generated by calculating the phase difference between these two images at each pixel location:
| (6) |
where the superscripts denote the MEG polarity and the subscripts indicate whether FUS was on. The acquisition time needed for the image pair was 3.8 s.
Because the FUS pulses were fairly strong and frequent, it is possible that heating could occur at the focal spot, leading to an additional off-resonance frequency shift. Thus the phase contrast generated by the bSSFP-ARFI sequence could be caused by both motion encoding and temperature rise. To isolate the temperature-induced phase change, we repeated the measurement described above but with MEG amplitude set to zero. The sequence timing was unchanged, and other MRI and FUS parameters were kept exactly the same. In this case, any image phase change was only due to PRF shift induced by temperature rise. Since the temperature-induced phase change was expected to be small, six averages were acquired to increase the CNR. Enough time (∼ 30 s) was waited between the averages to allow the temperature to come back to the baseline. In order to map the image phase change to frequency change (to further convert to temperature rise), we measured the bSSFP phase transition curve by acquiring a series of images with the same pulse sequence at different scanner operating frequencies without FUS. This series covered a frequency range from 10 Hz below to 10 Hz above resonance in steps of 1 Hz. The image phase was plotted as a function of operating frequency and used to evaluate the temperature rise. Details of this approach can be found in (22,27).
To demonstrate the enhanced sensitivity of the bSSFP-ARFI technique, we also performed MR-ARFI with an spGRE pulse sequence to measure βMEG. The pulse sequence is similar to the one shown in Fig. 2, except with RF spoiling and a spoiler gradient added after the readout. MEG and FUS were kept the same as in the bSSFP-ARFI sequence. Each k-space line was sampled twice with opposing MEG polarities in consecutive TR periods before moving to the next, and FUS was always triggered at the start of the second lobe of MEG. Therefore the temperature-induced phase will cancel after taking the difference of the image phase acquired with opposing MEG polarities. To remove any eddy-current-induced artifacts due to different MEG polarities, baseline images with both MEG polarities were acquired with no FUS (32). Finally the ARFI contrast image was calculated as:
| (7) |
Scan parameters were FA = 10°, BW = 50 kHz, TE = 9.6 ms and TR = 14.5 ms, and total scan time for the four images was about 7.4 s (not including “dummy” TR cycles executed immediately before the first image to help reach steady magnetization). Sixteen averages were acquired to increase the CNR. We waited about 30 s between averages for the focal spot to cool back to room temperature.
Results
An image of ARFI contrast obtained using bSSFP-ARFI in our phantom is shown in Fig. 4a. The focal spot is visible as a white spot at the center of the image, which matches the location of the intended ultrasound target. The average phase over a 2 × 2 pixel ROI at the focal spot is 0.58 rad. The noise in the ARFI contrast image varies across the FOV, since the bSSFP signal magnitude depends on the amount of off-resonance. Therefore the noise at the focal spot cannot be determined directly from Fig. 4a. Instead, it can be shown that the noise in the phase image equals σ/S when S ≫ σ (33), where σ is the noise in the real and imaginary channels and S is the signal magnitude. We determined σ by taking the standard deviation of pixel values in the real and imaginary images in regions with no object, and used the average signal intensity in the magnitude image within the focal ROI for S. The phase noise at the focal spot was thereby calculated to be 0.027 rad and 0.025 rad respectively for the bSSFP images with and without FUS. After taking the phase difference, noise would be √(0.0252+0.0272)=0.037 rad at the focal spot.
Figure 4.
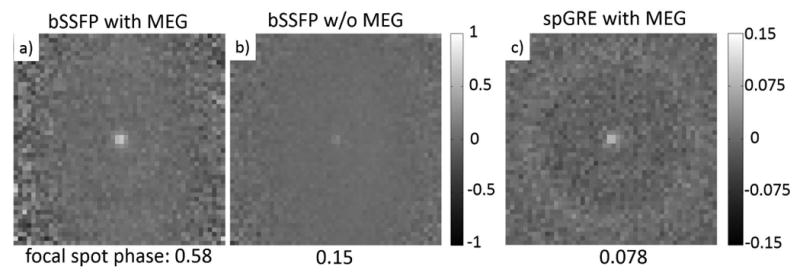
Phase contrast (radians) calculated from a) the bSSFP-ARFI image pair, b) the bSSFP image pair (without MEG) with 6 averages, c) the spGRE-ARFI acquisitions with 16 averages. Note the color scale of c) is different from that of a) and b). FOV is zoomed to 4.8 cm to better show the focal spot.
The phase difference image acquired with FUS applied but MEG nulled is shown in Fig. 4b. In this case, the phase contrast is only due to temperature-induced off-resonance (Δβoff). The average focal spot phase in the focal ROI is 0.15 rad. We thus estimate the amount of image phase generated by motion encoding to be 0.58 - 0.15 = 0.43 rad. Although βMEG and Δβoff both contribute to the focal spot phase, their origins are quite different, and the relative contributions will vary with tissue type depending on its thermal and elastic properties.
The spGRE-ARFI contrast was calculated using Eq. 7 and is shown in Fig. 4c. Since we interleaved opposing MEG polarities TR by TR, it can be assumed that both images were acquired at the same temperature. Thus unlike the bSSFP-ARFI image pair, there is no temperature-related contribution to their phase difference and βMEG can be calculated directly from the phases measured at the focal spot. The average focal ROI phase was 0.078 rad. With 16 averages, the background noise was about 0.01 rad.
By comparing the bSSFP-ARFI focal phase and βMEG measured by spGRE-ARFI, we found the proposed approach increased sensitivity to βMEG by 0.43/0.078 = 5.5 times. We also calculated the time efficiencies of the two sequences as CNR/√(acquisition time). For bSSFP-ARFI, CNR = 0.43/0.036 = 11.9, acquisition time = 3.8 s; For spGRE-ARFI, CNR = 0.078/0.01=7.8, acquisition time = 119 s (including 16 averages). Therefore with the same short FUS, MEG and 2DFT readout, the bSSFP-ARFI sequence is (11.9/√3.8)/(7.8/√119) = 8.5 times more efficient, due to both the enhanced phase sensitivity and bigger signal magnitude at short TR. We note here that the eight-fold increase in CNR efficiency should be considered as a demonstration of the proposed pulse sequence, rather than an accurate general result, since the CNR efficiency depends on the tissue properties as well as the implementation of the sequence like T1, T2, T2*, FA, off-resonance, TE, etc.
The measured bSSFP phase transition curve of a voxel at the focal spot is shown in Fig. 5. Using the bSSFP thermometry technique described in Ref. (27), the focal spot phase change in Fig. 4b was analyzed to indicate a PRF shift of 0.3 Hz, which corresponds to a temperature increase of 0.24 °C at 3T. Since the center of k space was sampled when half of the phase encoding lines had been collected, the temperature rise after full image collection could be around 0.48 °C.
Figure 5.
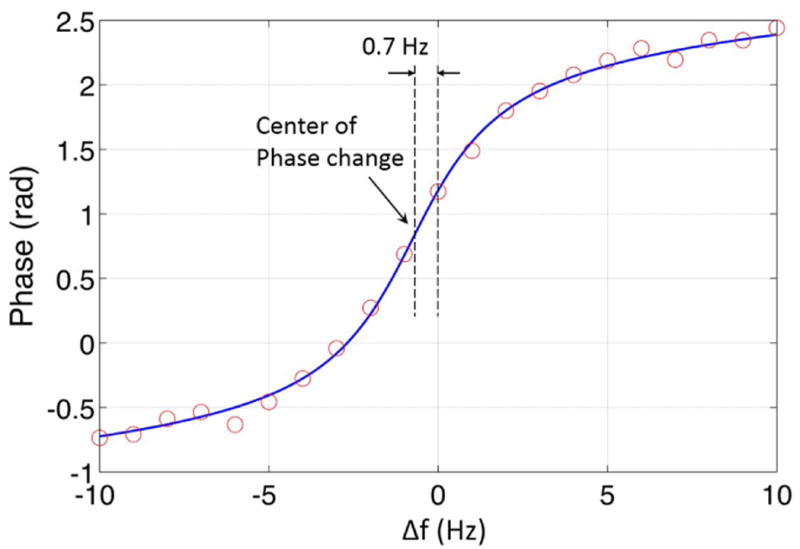
The bSSFP phase transition curve of a voxel at the focal spot. The solid line fits the measured phase to Eq. 1 and a global phase offset. A shift along the x axis is allowed in the fit, to account for the difference between the Larmor frequency and the default scanner operating frequency, which is found to be 0.7 Hz in the data shown here. As mentioned in the discussion section, it is also possible to shift the phase transition curve by intentionally adding an off-resonance frequency.
Discussion
In this work, bSSFP-ARFI was introduced as a new pulse sequence for measuring FUS-induced tissue displacement, with improved sensitivity due to the rapidly changing phase in the transition band. Whereas traditional ARFI sequences have a one-to-one relationship between βMEG and the ARFI image phase, bSSFP-ARFI shows greater ARFI phase than βMEG when operating near resonance. One concern for bSSFP-ARFI is that it might be difficult to shim the field properly to put the ROI in the sensitive transition band if the ultrasound focus location is completely unknown. Fortunately, in MRgFUS, the ultrasound focus location can usually be predicted using prior knowledge of the transducer, like the geometry and phase of the elements, and the measured and expected focal spot position usually agrees within a few millimeters. If multiple bSSFP-ARFI measurements need to be performed over a long time period, compensating for the B0 field drift may be necessary to keep the focal spot on resonance. One solution is to measure the field drift in real-time and adjust the scanner operating frequency (or phase cycling scheme) accordingly, as proposed for transition band bSSFP-fMRI (34,35). For in-vivo applications, the bSSFP-ARFI technique is also likely to be sensitive to motion. Motion of the target tissue would inhibit the buildup of steady state, and even motion away from the target could introduce a slight field change at the target which would affect the ARFI phase shift. Such effects may be difficult to compensate for, and should be considered in future in-vivo applications.
For on-resonance spins, the slope of the image phase (dϕ/dβMEG) used for bSSFP-ARFI is largest in the vicinity of βMEG = 0 and decreases as βMEG becomes larger, as shown in Fig. 3b. We have shown in the theory section that for βoff = 0, the bSSFP-ARFI phase slope is greater than the spGRE-ARFI phase slope (which is 1) only for |βMEG| < cos-1E2, with MEG before readout. To make full use of this limited range of amplification, it is possible to introduce a small βoff so that the phase transition curves in Fig. 3a are slightly shifted along the x axis (Eq. 3). The full range of βMEG for which dϕ/dβMEG is greater than 1 is 2cos-1E2, and the bSSFP-ARFI technique is most suitable for βMEG within this range. If βoff is set to -cos-1E2, the image phase changes by π from βMEG = 0 to βMEG = 2cos-1E2 according to Eq. 2 (Fig. 3a), assuming T2 = 100 ms and TR = 15 ms, 2cos-1E2 = 1.07 rad. In this case, the ARFI sensitivity can be calculated as π/1.07 ≈ 3. For even larger βMEG that cannot be completely contained within this range, the image phase slope for part of the motion-encoded phase is less than unity (could be as low as 1/2, as shown in Fig. 3b), and bSSFP-ARFI gradually loses its sensitivity advantage over conventional spoiled MR-ARFI sequences.
Finally, we note that although the proposed bSSFP-ARFI pulse sequence is relatively straightforward as a qualitative technique, the nonlinear nature of the ARFI phase shift and its sensitivity to subtle field changes will present challenges for quantitative measurements of tissue displacement. However, it is worth pointing out that by incorporating a pre-scan of the bSSFP transition band, it may be possible to map the image phase change to the actual amount of motion encoded phase, similar to the approach described in Ref (27), which addresses the issue of nonlinearity.
Conclusion
We have developed a novel MR-ARFI technique that makes use of the sudden phase change of the bSSFP signal near resonance. We have demonstrated that with careful implementation, ARFI contrast images can be generated in a few seconds. Although FUS was applied every TR (14.7 ms) during the ARFI image acquisition, the necessary pulse duration was short enough that the resulting temperature rise was negligible. The bSSFP-ARFI technique features enhanced sensitivity and high speed with robust 2DFT readout, and might provide a useful alternative to conventional MR-ARFI sequences.
Acknowledgments
The authors would like to thank Dr. Brian Hargreaves and Dr. Ethan Johnson for helpful discussions, Dr. Juan Plata for help with the RTHawk platform, Patrick Ye for help with the FUS system, and Dr. Hans Weber for help with fabricating phantoms.
The authors would also like to acknowledge our funding sources: NIH R01 EB019005, NIH P01 CA159992, NIH R01 MH111825, General Electric, and InSightec.
References
- 1.Trumm CG, Stahl R, Clevert Da, Herzog P, Mindjuk I, Kornprobst S, Schwarz C, Hoffmann RT, Reiser MF, Matzko M. Magnetic resonance imaging-guided focused ultrasound treatment of symptomatic uterine fibroids: impact of technology advancement on ablation volumes in 115 patients. Invest Radiol. 2013;48:359–365. doi: 10.1097/RLI.0b013e3182806904. [DOI] [PubMed] [Google Scholar]
- 2.Napoli A, Anzidei M, De Nunzio C, Cartocci G, Panebianco V, De Dominicis C, Catalano C, Petrucci F, Leonardo C. Real-time magnetic resonance-guided high-intensity focused ultrasound focal therapy for localised prostate cancer: Preliminary experience. Eur Urol. 2013;63:395–398. doi: 10.1016/j.eururo.2012.11.002. [DOI] [PubMed] [Google Scholar]
- 3.Schmitz AC, Gianfelice D, Daniel BL, Mali WPTM, Van den Bosch MAAJ. Image-guided focused ultrasound ablation of breast cancer: Current status, challenges, and future directions. Eur Radiol. 2008;18:1431–1441. doi: 10.1007/s00330-008-0906-0. [DOI] [PMC free article] [PubMed] [Google Scholar]
- 4.Hurwitz MD, Ghanouni P, Kanaev SV, et al. Magnetic resonance-guided focused ultrasound for patients with painful bone metastases: Phase III trial results. J Natl Cancer Inst. 2014;106:1–9. doi: 10.1093/jnci/dju082. [DOI] [PMC free article] [PubMed] [Google Scholar]
- 5.Elias WJ, Huss D, Voss T, et al. A pilot study of focused ultrasound thalamotomy for essential tremor. N Engl J Med. 2013;369:640–8. doi: 10.1056/NEJMoa1300962. [DOI] [PubMed] [Google Scholar]
- 6.Magara A, Bühler R, Moser D, Kowalski M, Pourtehrani P, Jeanmonod D. First experience with MR-guided focused ultrasound in the treatment of Parkinson's disease. J Ther ultrasound. 2014;2:11. doi: 10.1186/2050-5736-2-11. [DOI] [PMC free article] [PubMed] [Google Scholar]
- 7.Jeanmonod D, Werner B, Morel A, Michels L, Zadicario E, Schiff G, Martin E. Transcranial magnetic resonance imaging–guided focused ultrasound: noninvasive central lateral thalamotomy for chronic neuropathic pain. Neurosurg Focus. 2012;32:E1. doi: 10.3171/2011.10.FOCUS11248. [DOI] [PubMed] [Google Scholar]
- 8.McDannold N, Clement G, Black P, Jolesz F, Hynynen K. Transcranial MRI-guided focused ultrasound surgery of brain tumors: Initial findings in three patients. Neurosurgery. 2010;66:323–332. doi: 10.1227/01.NEU.0000360379.95800.2F. [DOI] [PMC free article] [PubMed] [Google Scholar]
- 9.Peters RD, Hinks RS, Henkelman RM. Ex vivo tissue-type independence in proton-resonance frequency shift MR thermometry. Magn Reson Med. 1998;40:454–459. doi: 10.1002/mrm.1910400316. [DOI] [PubMed] [Google Scholar]
- 10.Rieke V, Pauly KB. MR thermometry. J Magn Reson Imaging. 2008;27:376–390. doi: 10.1002/jmri.21265. [DOI] [PMC free article] [PubMed] [Google Scholar]
- 11.Holbrook AB, Ghanouni P, Santos JM, Medan Y, Butts Pauly K. In vivo MR acoustic radiation force imaging in the porcine liver. Med Phys. 2011;38:5081. doi: 10.1118/1.3622610. [DOI] [PMC free article] [PubMed] [Google Scholar]
- 12.De Poorter J, De Wagter C, De Deene Y, Thomsen C, Stahlberg F, Achten E. Noninvasive MRI thermometry with the proton resonance frequency (PRF) method: In vivo results in human muscle. Magn Reson Med. 1995;33:74–81. doi: 10.1002/mrm.1910330111. [DOI] [PubMed] [Google Scholar]
- 13.McDannold N, Maier SE. Magnetic resonance acoustic radiation force imaging. Med Phys. 2008;35:3748–3758. doi: 10.1118/1.2956712. [DOI] [PMC free article] [PubMed] [Google Scholar]
- 14.Radicke M, Engelbertz A, Habenstein B, Lewerenz M, Oehms O, Trautner P, Weber B, Wrede S, Maier K. New image contrast method in magnetic resonance imaging via ultrasound. Hyperfine Interact. 2008;181:21–26. [Google Scholar]
- 15.Muthupillai R, Rossman PJ, Lomas DJ, Greenleaf JF, Riederer SJ, Ehman RL. Magnetic Resonance Imaging of Transverse Acoustic Strain Waves. Magn Reson Med. 1996;336:266–274. doi: 10.1002/mrm.1910360214. [DOI] [PubMed] [Google Scholar]
- 16.Chen J, Watkins R, Pauly KB. Optimization of encoding gradients for MR-ARFI. Magn Reson Med. 2010;63:1050–1058. doi: 10.1002/mrm.22299. [DOI] [PMC free article] [PubMed] [Google Scholar]
- 17.Kaye EA, Pauly KB. Adapting MRI acoustic radiation force imaging for in vivo human brain focused ultrasound applications. Magn Reson Med. 2013;69:724–733. doi: 10.1002/mrm.24308. [DOI] [PMC free article] [PubMed] [Google Scholar]
- 18.Kaye EA, Chen J, Pauly KB. Rapid MR-ARFI method for focal spot localization during focused ultrasound therapy. Magn Reson Med. 2011;65:738–743. doi: 10.1002/mrm.22662. [DOI] [PMC free article] [PubMed] [Google Scholar]
- 19.de Bever JT, Odéen H, Todd N, Farrer AI, Parker DL. Evaluation of a three-dimensional MR acoustic radiation force imaging pulse sequence using a novel unbalanced bipolar motion encoding gradient. Magn Reson Med. 2016 Sep;76(3):803–13. doi: 10.1002/mrm.25971. [DOI] [PMC free article] [PubMed] [Google Scholar]
- 20.Scheffler K, Seifritz E, Bilecen D, Venkatesan R, Hennig J. Detection of BOLD changes by means of a frequency- sensitive trueFISP technique : preliminary results. 2001:490–496. doi: 10.1002/nbm.726. [DOI] [PubMed] [Google Scholar]
- 21.Scheffler K. Fast frequency mapping with balanced SSFP: Theory and application to proton-resonance frequency shift thermometry. Magn Reson Med. 2004;51:1205–1211. doi: 10.1002/mrm.20081. [DOI] [PubMed] [Google Scholar]
- 22.Paliwal V, El-Sharkawy AM, Du X, Yang X, Atalar E. SSFP-based MR thermometry. Magn Reson Med. 2004;52:704–708. doi: 10.1002/mrm.20231. [DOI] [PubMed] [Google Scholar]
- 23.Bieri O, Maderwald S, Ladd ME, Scheffler K. Balanced alternating steady-state elastography. Magn Reson Med. 2006;55:233–241. doi: 10.1002/mrm.20812. [DOI] [PubMed] [Google Scholar]
- 24.Miller GW, Timbie KF, Price RJ. Fluctuating Equilibrium MR-ARFI. Proc Intl Soc Mag Reson Med. 2014:261. [Google Scholar]
- 25.Zheng Y, Marx M, Miller GW, Pauly KB. High Speed, High Sensitivity MR-ARFI Using a Balanced Steady-State Free Precession Pulse Sequence. Proc Intl Soc Mag Reson Med. 2016:2104. [Google Scholar]
- 26.Miller KL, Hargreaves BA, Lee J, Ress D, DeCharms RC, Pauly JM. Functional brain imaging using a blood oxygenation sensitive steady state. Magn Reson Med. 2003;50:675–683. doi: 10.1002/mrm.10602. [DOI] [PubMed] [Google Scholar]
- 27.Zheng Y, Miller GW. High speed, high sensitivity MR thermometry using a balanced steady-state free precession pulse sequence. Proc Intl Soc Mag Reson Med. 2015:1654. [Google Scholar]
- 28.Scheffler K, Lehnhardt S. Principles and applications of balanced SSFP techniques. Eur Radiol. 2003;13:2409–2418. doi: 10.1007/s00330-003-1957-x. [DOI] [PubMed] [Google Scholar]
- 29.Scheffler K, Hennig J. Is TrueFISP a gradient-echo or a spin-echo sequence? Magn Reson Med. 2003;49:395–397. doi: 10.1002/mrm.10351. [DOI] [PubMed] [Google Scholar]
- 30.Brown RW, Cheng YCN, Haacke EM, Thompson MR, Venkatesan R. Magnetic Resonance Imaging Physical Principles and Sequence Design. 2nd. Wiley-Blackwell; 2014. pp. 472–473. [Google Scholar]
- 31.Stanisz GJ, Odrobina EE, Pun J, Escaravage M, Graham SJ, Bronskill MJ, Henkelman RM. T1, T2 relaxation and magnetization transfer in tissue at 3T. Magn Reson Med. 2005;54:507–512. doi: 10.1002/mrm.20605. [DOI] [PubMed] [Google Scholar]
- 32.Auboiroux V, Viallon M, Roland J, et al. ARFI-prepared MRgHIFU in liver: Simultaneous mapping of ARFI-displacement and temperature elevation, using a fast GRE-EPI sequence. Magn Reson Med. 2012;68:932–946. doi: 10.1002/mrm.23309. [DOI] [PubMed] [Google Scholar]
- 33.Gudbjartsson H, Patz S. The Rician distribution of noisy MRI data. Magn Reson Med. 1995;34:910–914. doi: 10.1002/mrm.1910340618. [DOI] [PMC free article] [PubMed] [Google Scholar]
- 34.Lee J, Santos JM, Conolly SM, Miller KL, Hargreaves BA, Pauly JM. Respiration-induced B0 field fluctuation compensation in balanced SSFP: Real-time approach for transition-band SSFP fMRI. Magn Reson Med. 2006;55:1197–1201. doi: 10.1002/mrm.20879. [DOI] [PubMed] [Google Scholar]
- 35.Wu ML, Wu PH, Huang TY, Shih YY, Chou MC, Liu HS, Chung HW, Chen CY. Frequency stabilization using infinite impulse response filtering for SSFP fMRI at 3T. Magn Reson Med. 2007;57:369–379. doi: 10.1002/mrm.21138. [DOI] [PubMed] [Google Scholar]