Abstract
Image mean square displacement analysis (iMSD) is a method allowing the mapping of diffusion dynamics of molecules in living cells. However, it can also be used to obtain quantitative information on the diffusion processes of fluorescently labelled molecules and how their diffusion dynamics change when the cell environment is modified. In this paper, we describe the use of iMSD to obtain quantitative data of the diffusion dynamics of a small cytoskeletal protein, profilin 1 (pfn1), at the membrane of live cells and how its diffusion is perturbed when the cells are treated with Cytochalasin D and/or the interactions of pfn1 are modified when its actin and polyphosphoinositide binding sites are mutated (pfn1-R88A). Using total internal reflection fluorescence microscopy images, we obtained data on isotropic and confined diffusion coefficients, the proportion of cell areas where isotropic diffusion is the major diffusion mode compared to the confined diffusion mode, the size of the confinement zones and the size of the domains of dynamic partitioning of pfn1. Using these quantitative data, we could demonstrate a decreased isotropic diffusion coefficient for the cells treated with Cytochalasin D and for the pfn1-R88A mutant. We could also see changes in the modes of diffusion between the different conditions and changes in the size of the zones of pfn1 confinements for the pfn1 treated with Cytochalasin D. All of this information was acquired in only a few minutes of imaging per cell and without the need to record thousands of single molecule trajectories.
Keywords: correlation spectroscopy, diffusion dynamics, single particle, microscopy, TIRF
1. Introduction
Image mean square displacement analysis or iMSD is a new method of image processing[1, 2], which is based on the calculation of the mean square displacement (MSD) commonly used in single particle tracking, but without resolving single particles. Therefore, the iMSD plot is similar to the plots obtained from single particle tracking technique and can be used to reconstruct the protein diffusion law and extract quantitative information of the parameters characterizing the different modes of diffusion. The dynamics of molecules analyzed with image mean square displacement can be assessed using 2 complementary approaches; one favoring spatial resolution and the other focusing on quantification of the diffusion dynamics. In the first approach, one wants to localize where different types of diffusion occur in the cells or the effect of a particular treatment on a given region of the cells and relate these to specific structures. In this case, one can use the iMSD analysis to map the different modes of diffusion to ROIs and plot them on the image of the cell to obtain a visual representation of these diffusion modes and characteristics. The resolution of these maps will depend on the size of the ROI. The size of the ROI can be selected in SimFCS (the software used for this article available at www.lfd.uci.edu) and scanning of the whole image can be achieved with an ROI as small as 8 × 8 pixels. In addition, the image can be scanned with steps of up to 1/8th of the size of the ROI resulting in pixel size resolution. However, analyzing the image with such a small ROI is often not practical. Indeed, the brightness of the fluorophore as well as the diffusion of the fluorophore will ultimately determine how small your ROI can be and if the image signal is weak or the diffusion coefficient is too small, then a larger ROI will need to be used. In the second approach and the one that we will discuss in this paper, we are not concerned with where the diffusion or types of diffusion occur, but we want to obtain quantitative information on how diffusion changes due to various conditions. In this approach, one records images from a population of cells and all the data are pooled together. Of course the two approaches could also be combined and both localization and quantitative data on the molecule diffusion characteristics can be obtained. In the second approach however, we can use larger ROI and therefore use images that may not be bright enough for high-resolution mapping. To illustrate the type of quantitative information that one can get from iMSD analysis, we will look at the dynamics of Profilin 1 at the membrane of live cells. Profilin (Pfn1) is a small protein that plays a role at the cross road of cellular processes orchestrating non-muscle cell motility. Pfn1, a multi-ligand protein that interacts with G-actin, membrane polyphosphoinositides (PPIs) and a plethora of proteins containing poly-L-proline (PLP) domains, has been linked to many cellular activities. In general, Pfn1 promotes membrane protrusion and cell migration by facilitating actin polymerization at the leading edge, through its interactions with actin and PLP-ligands[3, 4]. N-WASP/WAVE, Ena/VASP and formins are three major classes of actin binding protein shown to interact with Pfn1 through its PLP binding site and modulate its action on actin polymerization. In contrast to actin and PLP interactions, PPI interactions of Pfn1 have received much less attention in the literature. It has been shown that Pfn1 can bind to PI(4,5)P2, PI(3,4,5)P3 (PIP3) and PI(3,4)P2[5]. However, these findings were entirely based on an in vitro binding assay consisting of purified protein and non-physiological phospholipid micelles. A recent model of the cell surface, the active composite model, proposes that a dynamic network of short cortical actin filaments would transiently be attached to the cell membrane with longer filaments forming a static actin mesh. The dynamic cortical network would interact with cell membrane molecules creating transient nanodomains within the membrane[6]. Direct interaction of Pfn1 with the dynamic cortical actin or indirect interaction due to the formation of domains in the membrane that could either promote or prevent Pfn1 interaction with the membrane will therefore affect Pfn1 signaling and function. The dynamics of Pfn1 at the plasma membrane in live cells has never been investigated and iMSD analysis can provide a range of information that can help to shed light on these processes.
2. Materials and Methods
2.1. Plasmids
Wild type human Pfn1 and eGFP coding sequences were amplified by PCR using Q5 High Fidelity DNA Polymerase (NEB, Ipswich, MA) from pET11dWtProf (GENEART, Thermo Fisher Scientific) and pGK-H2B-eGFP (Addgene 21210) plasmids, respectively using primers incorporating a linker (SGLRSRAQASM) between the Pfn1 and eGFP[7]. Pfn1 and eGFP were cloned into pGem T easy vector (Promega) using a Gibson reaction (NEB, Ipswich MA) to form the GFP-profilin construct. The fusion of GFP on the N-terminus of profilin has been shown not to interfere with profilin's activity both in in vitro assays[8] and in cells[3]. After sequencing, GFP-profilin was re-amplified by PCR to create the sequences necessary for ligation into the cumate inducible pLenti cloning vector (ABM, Richmond, Canada) by a Gibson reaction. The R88A profilin mutant was generated by site directed mutagenesis using NEB Base Changer.
2.2. Transfection
Viral particles were produced in HEK293LV cells using the 2nd Generation packaging and envelope plasmids psPAX2 and pMDG.2 (Addgene). Virus production and transfection followed the manufacturer's instructions (http://www.addgene.org/tools/protocols/plko/#E). MDA-MB-231 cells were transfected using Viafect (Promega) at a ratio of 4:1 (Viafect:DNA) with pLenti-EF1α-CymR-Neo vector (ABM, Richmond, Canada) containing the cumate repressor and neomycin resistance genes. Selection was carried out using G418 (Sigma) at 500 μg/ml. Once cloned, cells were further transfected with the pLenti GFP-profilin construct and stably transfected cells were selected with 1 μg/ml puromycin (AG Scientific, San Diego).
2.3. Cell Culture
MDA-MB-231 cells and HEK293LV cells were maintained in high glucose DMEM GlutaMAX medium supplemented with 10% FBS, 1mM sodium pyruvate and 100 U/ml penicillin-streptomycin (Invitrogen). In addition, transfected MDA-MB-231 cells were maintained in 250 μg/ml G418 (Sigma) and 1μg/ml puromycin (AG Scientific, San Diego). 48 hours prior to imaging, GFP-profilin MDA-MB-321 cells were seeded onto 35 mm imaging dishes (MatTek, Ashland, MA) coated with 2μg/ml fibronectin (Invitrogen) and cumate (ABM, Richmond. Canada) was added to a final concentration of 30 μg/ml. MD-MB-231 cells have a reduced Pfn1 expression compared to their control HMEC cells[9]. In our conditions and after cumate induction, the level of recombinant Pfn1 expression, as evaluated from immunoblots, was moderate (∼0.7× the endogenous Pfn1 expression) and therefore the total Pfn1 levels are likely to be close to levels seen in normal cells (data not shown). Cytochalasin D (SCBT, Dallas TX) at final concentrations of 0.5μM in DMSO (0.1% final volume) (Sigma) was added to the imaging dishes 15 minutes before image acquisition, and images were acquired within 2 hours. A control group with the addition of 0.1% final volume of DMSO was also imaged. Since no differences were found between the control groups with or without DMSO, the data from the two groups were pooled.
2.4. TIRF microscopy
An Olympus X71 TIRF microscope equipped with a 63× NA 1.43 objective coupled to a Photometrics 512B EMCCD camera was used for the experiments described here. An argon ion laser emitting at 488nm was coupled to the microscope. The intensity of the laser was regulated using a series of neutral density filters with a nominal out power of 1mW as measured at the entrance of the microscope objective after passing through the fibre and the spatial filter. Images were acquired in temperature controlled chambers at 37°C and 5% CO2. A preview image of the cells is acquired first; making sure that the light exposure of the cell is kept to a minimum. Then a region of the cell of 128×128 pixels is selected. For each region of the cell a minimum of 2,048 frames were obtained at a rate of 50 frames/s. The pixel size was 145nm giving an image size of 18.56 × 18.56 μm. The radial waist of the PSF was determined using sub-resolution fluorescent beads (Life Technologies, Carlsbad, CA) to be ±280nm. The image stacks were transferred into SimFCS software (Laboratory for Fluorescence Dynamics, Irvine, CA) for analysis.
2.5. iMSD Analysis
The iMSD analysis has been described in Di Rienzo et al.[2] and is an extension of the spatiotemporal image correlation (STIC) function previously described by Hebert et al.[10] which is defined as
| Eq. 1 |
where ξ and χ are the distance between correlated pixels in the x and y directions, respectively, τ is the time lag, I(x,y,t) is the fluorescence intensity at point x,y and time t and the 〈 〉 indicates the average over x,y and t. If the particle size is negligible, G(ξ,χ,τ) can be written as
| Eq. 2 |
and is the convolution of the instrument point spread function W(ξ,χ) and p(ξ,χ,τ) a probability distribution describing the dispersive dynamics of the particles, multiplied by the ratio of a factor γ which depends on the shape of the illumination volume and N, the average number of molecules in the observation volume. For membrane or 2D diffusion, the probability distribution pD(ξ,χ,τ) can be calculated by integration of Fick's diffusion law as follows
| Eq. 3 |
where D is the diffusion coefficient and G(ξ,χ,τ) can be rewritten as
| Eq. 4 |
and is a Gaussian function centered at the origin (ξ=0,χ=0) where gD(τ)is the temporal correlation function in the diffusive case and is defined as
| Eq. 5 |
and is the correlation function variance which is plotted as a function of time (τ) to give the iMSD. Therefore, for moving particles, as the variance in Eq. 4 increases with delay time, the amplitude decreases according to Eq. 5.
2.6. Analysis of the iMSD curve
For isotropic diffusion (free diffusing particles), the iMSD plot is linear in delay time τ and the data were fitted to the following equation:
| Eq. 6 |
Where D is the diffusion coefficient, τ the time and σ20 the iMSD offset which is due to a combination of the instrumental waist and the particle/domain size [2].
In the case of confined diffusion, the data were fitted to:
| Eq. 7 |
where L is the linear size of the confinement area and τc is an index on how fast the confinement occurs. The diffusion coefficient (Dmicro) in the confined area is calculated as L2/12τc.
When the diffusion is only transiently confined, the data are fitted to the following equation:
| Eq. 8 |
Where Dmacro is the slower long range diffusion coefficient and Dmicro (the local confined diffusivity) can be calculated as (L2/12τc)+Dmacro.
An analysis window of 32×32 pixels (ROI) was used to calculate the iMSD (Figure 1). The images were processed using the iMSD script in the SimFCS help menu. A mask was first drawn onto the cell to eliminate the edge of the cells, which may display occasional movements. A step of ¼ of the ROI size was selected for the scanning resulting in 169 ROI analyzed per image. The first scan was performed with a Gaussian fit of the whole surface of the iMSD function. Fittings of the iMSD function for each ROI are saved during the first analysis, allowing subsequent repeats of the analysis with all types of models of diffusion without recalculating the correlation function. The data obtained after fitting the models for diffusion to equations 6, 7 and 8 are then exported as text files and imported into Excel for further analysis.
Figure 1.
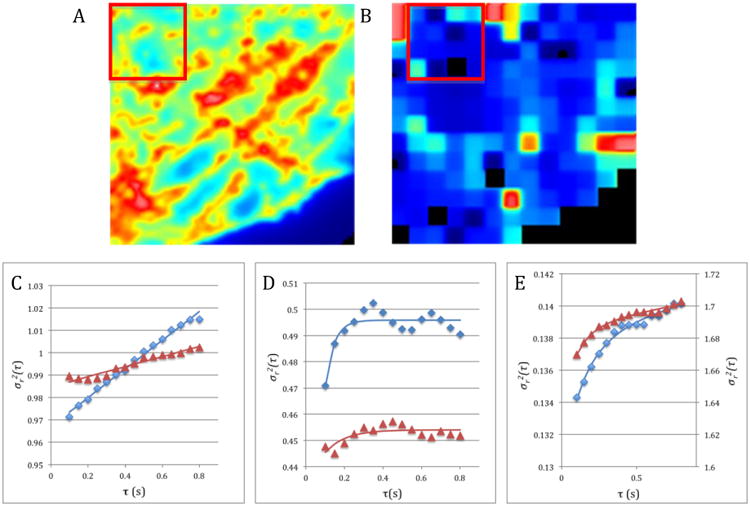
iMSD analysis of a TIRF image. A. Average intensity of the image stack with a 32 × 32 pixels region of interest used to calculate the iMSD at the first position of the analysis scan. B. Offset map obtained after scanning the image stack but before filtering the data using the correlation coefficient. The region of interest has been placed as an illustration of the scanning process in the second position of the scan (i.e. moved in x by 8 pixels and in y by 0 pixel). C to E. Fitting of the iMSD data (continuous line) to different modes of diffusions. The blue diamonds (trapezes) are data obtained from a control cell ROI and the brown triangles the data obtained from a ROI of a cell treated with Cytochalasin D. C. ROIs with isotropic diffusion. D. ROIs with confined diffusion. E. ROIs with transiently confined diffusion.
For each fit, an adjusted R-squared value was calculated and used to filter the data. Only ROI with a correlation coefficient value higher than 0.5 were used in the analysis.
While filtering using the correlation coefficient could have been done in SimFCS before exporting the data, we preferred to do this in the spreadsheet, as ROI poorly fitting any of the models would have been discarded. Two main reasons could lead to poor fittings of all models. The signal to noise ratio for that particular ROI is too low and this can be assessed by looking at the intensity of the image for that particular ROI or the molecules in that ROI are immobile and/or diffusing very slowly.
Once the filtering was completed, the goodness of the fit of each iMSD curve was evaluated for the three models of diffusion using the correlation coefficient. The models of diffusion with the best fit were then selected. Since in iMSD, the diffusion is analyzed for many trajectories simultaneously over the areas of the ROI, there is a continuum of diffusion types across the cell depending on the relative proportion of the different diffusion types in each ROI. Therefore, in some cases different models could be fitted to the same data. For instance, when the size of the confinement regions is small, the iMSD curves for isotropic and transiently confined diffusion become very similar. Also, when the isotropic diffusion part of the transiently confined diffusion mode is very slow, the iMSD curves become very similar to the iMSD curves for the confined diffusion modes. In those cases, the model with the least fitting variables was used. Any outliers in the data were individually inspected and the specific ROI was discarded only if the iMSD curve displayed discontinuity resulting from failure of the fit to the surfaces of the STIC function.
3. Results and Discussion
3.1. Isotropic diffusion of Pfn1 at the membrane
Fitting of the iMSD curves to equations 6 (isotropic diffusion) and 8 (transiently confined diffusion) provide the rate of isotropic or long range diffusion (Dmacro). Since we are interested in the diffusion of Pfn1 in this work, we have excluded ROI where Pfn1 is immobile. A minimum of 10 different cells which did not show major movements or bleaching were used for this analysis. For the control cells expressing wild type Pfn1-GFP there were no differences between the cells with or without DMSO (which was used to treat the cells with Cytochalasin D) and the data were pooled resulting in 464 ROI displaying isotropic diffusion. The diffusion coefficients varied markedly between different ROI within the same cells with values ranging from 0.0015 μm2/s for the 0.1 percentile to 0.077 μm2/s for the 0.9 percentile. The average was calculated to be 0.033 ± 0.003 μm2/s (mean ± SEM) (Figure 2). These values are significantly slower than those determined for β subunit of Cholera Toxin (CTxB) using iMSD [1], especially taking the different temperature of the experiments (22°C for CTxB instead of 37°C) into account which would have likely resulted in faster diffusion coefficients for CTxB. Although the GFP linked to Pfn1 will affect the diffusion coefficient it will only do so marginally, since the increase in molecular mass would only result in a ∼1.5 change in Pfn1 diffusion coefficient and is therefore not likely to be solely responsible for the slow diffusion observed for Pfn1. Treatment of the cells with Cytochalasin D (Cyto D), which predominantly binds to the barbed end of the actin filaments[11], results in actin dynamics disruption by blocking filament barbed end elongation and increased formation of profilin: actin complexes[12]. When WT Pfn1 GFP expressing cells were treated with Cytochalasin D, we observe a significant reduction in the rate of isotropic diffusion coefficient to 0.019 ± 0.003 μm2/s (p<0.0009) with diffusion coefficients ranging from 0.0012 μm2/s for the 0.1 percentile to 0.042 μm2/s for the 0.9 percentile. These results show that the treatment with Cyto D affects mostly a fast diffusing population of Pfn1 (Figure 2).
Figure 2.
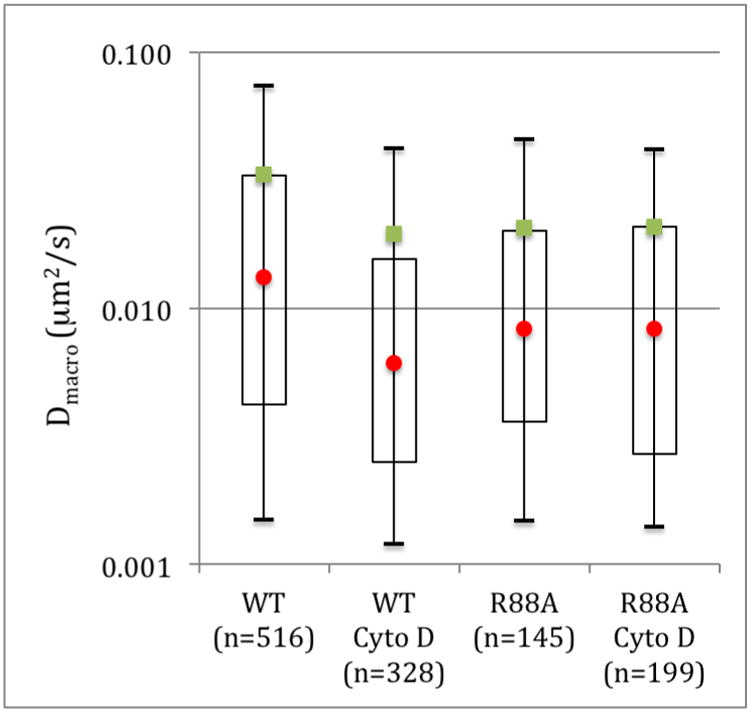
Long range isotropic diffusion characteristics of Pfn1 obtained by iMSD. The mean values are represented by the green squares and the median by the red circles. The open rectangles are the 1st to the 3rd quartile and the bars the 0.1 to 0.9 percentile. n is the number of ROI displaying isotropic diffusion.
Similarly, disruption of the actin and PPI binding sites by the R88A mutation on Pfn1 show a significant decrease in isotropic diffusion coefficients from 0.033 ± 0.003 μm2/s to 0.021 ± 0.003 μm2/s (p<0.008). However, there are no differences in isotropic diffusion between the Cyto D treated cells and the R88A mutants. While we could have expected an increase in Pfn1 isotropic diffusion coefficient with the disruption of the actin and PPI binding site, this is not the case and point to the presence of a subset of slower diffusing Pfn1 at the membrane. It is worth noting that because of the relatively long (50 ms) frame time, we are not able to detect the faster fluctuations of the free Pfn1diffusing in the proximity of the membrane.
In addition, treatment of the R88A mutant with Cyto D does not decrease the isotropic diffusion coefficients further (Figure 2), indicating that the actin and/or PPI binding sites are important for the fast diffusing population of Pfn1, which was released from the membrane by the R88A mutation.
3.2. Confined diffusion of Pfn1
For the ROIs where equation 7 and 8 are giving the best fit of the iMSD curves, the local diffusivity (Dmicro) and the size of the confinement zones where the local (confined) diffusion occurs can be obtained (Figure 3A). Interestingly, the proportion of the cells' surface where confined diffusion occurs varies with the treatments. The WT Pfn1 GFP expressing cells have 28% more cell areas undergoing confined diffusion than isotropic diffusion. In the R88A mutant, only 2% more membrane areas are displaying confined compared to isotropic diffusions. Indicating that the mutation affects the mode of Pfn1 diffusion at the membrane. Cyto D has an even more dramatic effect on the mode of diffusion with Pfn1 diffusing isotropically in the majority of the cell membrane with 16% and 30% more area of isotropic diffusion compared to confined diffusion for the WT cells treated with Cyto D and the R88A mutant cells treated with Cyto D, respectively (Figure 3B). However, and in contrast with the long range isotropic diffusion of Pfn1, the rate of confined diffusion is not significantly affected by any of the treatments (Figure 3A) suggesting that the local environment of Pfn1 at the membrane is not modified by Cyto D treatment or the Pfn1 mutation.
Figure 3.
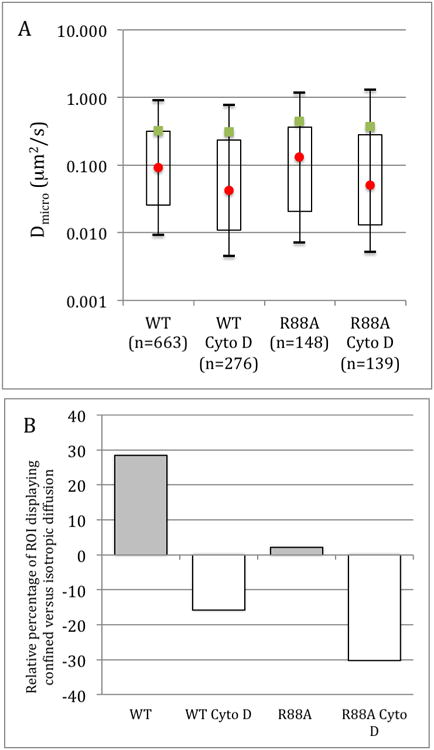
Diffusion characteristics of Pfn1 obtained by iMSD. A. Confined diffusion characteristics of WT Pfn1 and R88A mutant Pfn1 and the effects of cytochalasin D. the mean values are represented by the green squares and the median by the red circles. The open rectangles are the 1st to the 3rd quartile and the bars the 0.1 to 0.9 percentile. n is the number of ROI displaying confined diffusion. B. Percentage of isotropic versus confined diffusion modes. The grayed bars represent higher percentage of confined diffusion modes.
The second parameter obtained from equations 7 and 8 which is the size of confinement zone has an average value of 775 ± 11 nm and 775 ± 28 nm for the WT and R88A cells, respectively. This is significantly larger than the confinement size obtained for CtxB of 566 ± 13 nm[1] suggesting that at least the majority of Pfn1 diffuses within different structures than CtxB and GM1. The confinement sizes decrease significantly upon Cyto D treatment for both wild type and mutant expressing cells (Figure 4) with an average confinement size of 685 ± 18 nm (p<0.004) for the WT cells and 729 ± 22 nm (p<0.05) for the R88A mutant.
Figure 4.
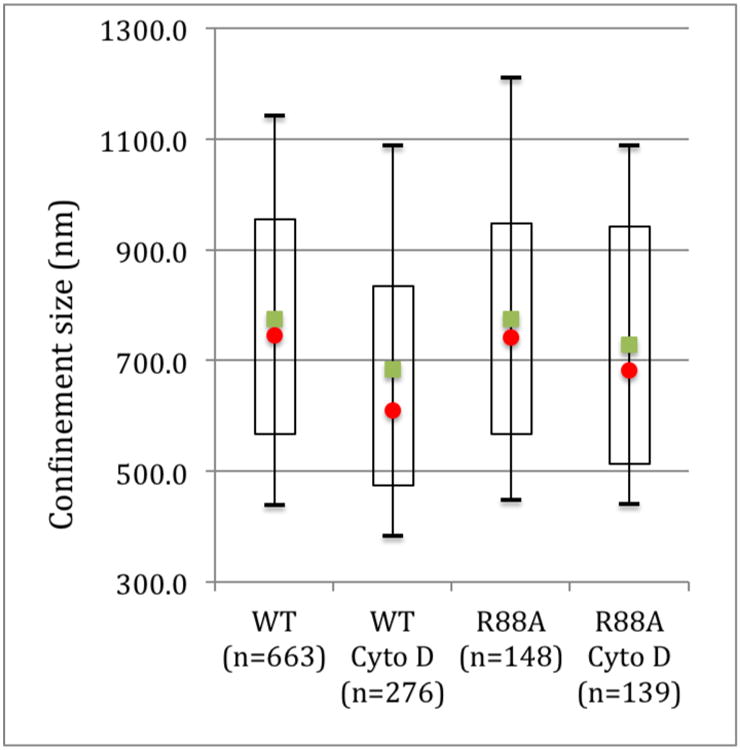
Confinement size of WT Pfn1 and R88A mutant Pfn1 and the effects of cytochalasin D. The mean values are represented by the green squares and the median by the red circles. The open rectangles are the 1st to the 3rd quartile and the bars the 0.1 to 0.9 percentile. n is the number of ROI displaying confined diffusion.
The R88A mutation on Pfn1 has been shown to affect both the actin and PPI binding sites with a 4 fold decrease in affinity for actin and a 2 fold decrease in affinity for PI(4,5)P2[13]. Our data suggest that there is no direct influence of these ligands binding on confined diffusions. Therefore, the diffusion within the confinement zones and the size of these confinement zones are not linked to a direct interaction between Pfn1 and actin or PPI.
Cyto D has been shown to induce the formation of filamentous actin aggregates or foci formation[14]. In addition, Saka et al.[15] reported that Cyto D treated cells displayed a large reorganization of protein assemblies at the cell membrane with a slightly larger area occupied by protein assemblies but a 4.5 fold increase in assembly size. Since the R88A mutant shows little difference compared with the WT Pfn1 with the exception of the rate of isotropic diffusion, it is unlikely that most Pfn1 molecules have a direct connection with the cytoskeleton at the membrane. However, the disruption of the cortical actin network might lead to a condensation of the area of Pfn1 confined diffusion.
3.3. Dynamic partitioning of Pfn1 at the membrane
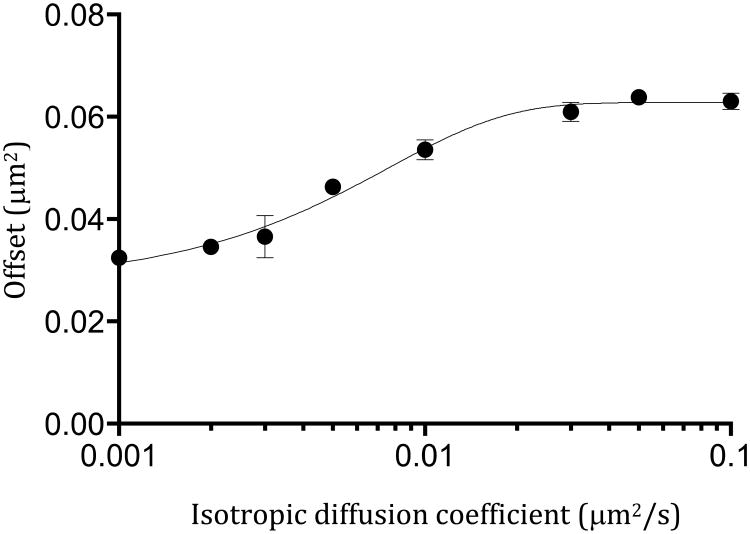
Another parameter that can be extracted from the iMSD curve to obtain quantitative information about the dynamics of Pfn1 at the membrane is the offset of the iMSD (σ20). The offset of the iMSD (i.e. the iMSD value at delay time zero) is a combination of the size of the PSF, the size of the particles under observation and the trapping component of dynamic partitioning of the diffusing molecules into fixed nanodomains smaller than the observation volume[2]. The value of the iMSD offset is also affected by the exposure time of the diffusing particles and for a given exposure time, will therefore change as a function of the rate of diffusion of the particles. To take this contribution into account, we simulated the isotropic diffusion of particles in a membrane using SimFCS. The simulations were performed on 128×128 pixels images with a frame time of 50ms per frame, a PSF radial waist of 280 nm and run in triplicate for diffusion coefficients between 0.001 to 0.1 μm2/s and analyzed as described for the cell images but without scanning and a ROI of 128×128 pixels (Figure 5). The contribution of the PSF to σ20 is expected to be 0.0784 μm2 for a PSF radial waist of 280nm. However, because most of the diffusion coefficients for Pfn1 are below 0.1 μm2/s, the apparent contribution of the PSF to the offset is lower and needs to be corrected. Therefore, the simulated data points were fitted to a four-parameter logistic curve and the equation obtained was then used to correct and subtract the offset value due to the size of the PSF from the iMSD data obtained in the cells. The offset for WT Pfn1 was calculated to be 0.936 ± 0.020 μm2 with a value of 0.244 μm2 for the 0.1 percentile and 1.850 μm2 for the 0.9 percentile (Figure 6). This is an order of magnitude larger than the offset values reported for CtxB[1], again showing that Pfn1 is unlikely to be associated with nanodomains containing GM1. After treatment with Cyto D, the offset value significantly (p<0.0000) increases to 1.166 ± 0.027 μm2 resulting mostly from an increase in the 0.1 percentile value from 0.244 μm2 to 0.460 μm2. Similar offset values are obtained for the R88A mutant in the presence and absence of Cyto D with an average offset of 1.269 ± 0.039 μm2 for the R88A expressing cells and 1.224 ± 0.033 μm2 for these cells treated with Cyto D. Pfn1 is known to associate with the membrane through its PPI binding sites[16]. While the R88A mutant has a 2 fold decreases in affinity for PI(4,5)P2 there is a high concentration of Pfn1 in cells. Since Pfn1 can bind up to 5 PPI lipid molecules[17] with high affinity[16], Pfn1 will have different affinities for PPIs depending on the number of phosphates and their positions. It is therefore likely that some complexes of Pfn1:PPI on the membrane will be tightly bound while others interacting with a smaller number of PPI or low affinity PPI will have much weaker interactions. The R88A mutation could therefore not completely prevent the interaction between Pfn1 and the membrane PPIs. It could however affect the low affinity interaction between PPI and Pfn1 for instance those where Pfn1 interacts with a small number of PPIs. These smaller clusters of Pfn1:PPI complexes could be diffusing faster than the larger ones and therefore the mutation would “remove” the fast diffusing population from the membrane and the Pfn1 associated with smaller partitioning domains. A similar process could also occur in the WT cells treated with Cyto D where the increased availability of G-actin would compete with PPIs for Pfn1 binding again preferentially removing Pfn1 from the complexes with lower affinity.
Figure 5.
iMSD offset as a function of diffusion coefficients. The circles are the mean values for data obtained from 3 simulations for each diffusion coefficient. The bars are the SEM. The line is the fit of the data. The equation obtained from the fit of the four-parameter logistic curve was used to correct the offset for the effect of the diffusion coefficient.
Figure 6.
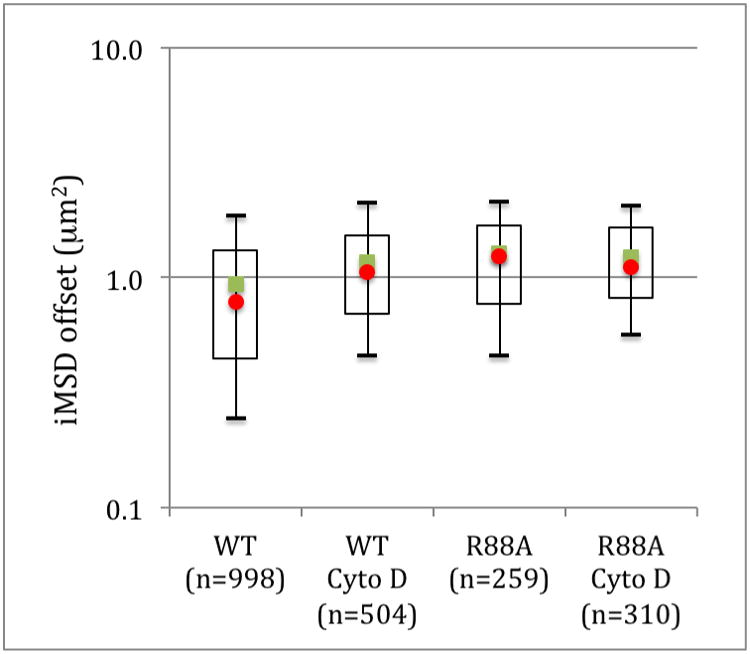
Corrected iMSD offset of WT Pfn1 and R88A mutant Pfn1 and the effects of cytochalasin D. The mean values are represented by the green squares and the median by the red circles. The open rectangles are the 1st to the 3rd quartile and the bars the 0.1 to 0.9 percentile. n is the number of ROI.
4. Conclusions
In this paper, we illustrated an application of the iMSD analysis, which focuses on acquiring quantitative data on the diffusion characteristics of Pfn1. We further used these quantitative data to investigate the effect of a mutation affecting the Pfn1 actin and PPI binding site as well as the effect of the disruption of the cortical actin network of the cells by Cyto D. With this approach, we did not need very bright images necessary for high-resolution spatial localisation of the diffusion processes. We could use low-level illumination from TIRF microscopy, reducing photobleaching and phototoxicity. By sampling between 10 and 20 cells in each condition investigated we rapidly obtained the rates of isotropic diffusion, and the rates of diffusion within zones of confinements. We also quantified the size of the confinements and the combination of the size of the particle and the dynamic partitioning of Pfn1 in nanodomains. In addition, we identified changes in the diffusion modes between the different conditions investigated. All of this information was acquired in only a few minutes of imaging per cells and without the need to record thousands of single molecule trajectories.
Highlights.
Image mean square displacement provides rapid quantitative data on diffusion dynamics.
Quantitative analysis can be achieved with care on samples with relatively low brightness.
Cytochalasin D and profilin R88A mutation modifies profilin's diffusion at the membrane.
Acknowledgments
M.A.D. and E.G. were supported in part by NIH grants P41 GM103540, and P50-GM076516. We also thank Mrs Milka Stakic for the cell cultures used in this work. R.D. was supported by an Australian Postgraduate Award from the University of New England
Footnotes
Publisher's Disclaimer: This is a PDF file of an unedited manuscript that has been accepted for publication. As a service to our customers we are providing this early version of the manuscript. The manuscript will undergo copyediting, typesetting, and review of the resulting proof before it is published in its final citable form. Please note that during the production process errors may be discovered which could affect the content, and all legal disclaimers that apply to the journal pertain.
References
- 1.Moens PD, Digman MA, Gratton E. Modes of diffusion of cholera toxin bound to GM1 on live cell membrane by image mean square displacement analysis. Biophys J. 2015;108(6):1448–58. doi: 10.1016/j.bpj.2015.02.003. [DOI] [PMC free article] [PubMed] [Google Scholar]
- 2.Di Rienzo C, Gratton E, Beltram F, Cardarelli F. Fast spatiotemporal correlation spectroscopy to determine protein lateral diffusion laws in live cell membranes. Proc Natl Acad Sci USA. 2013;110(30):12307–12312. doi: 10.1073/pnas.1222097110. [DOI] [PMC free article] [PubMed] [Google Scholar]
- 3.Ding Z, Gau D, Deasy B, Wells A, Roy P. Both actin and polyproline interactions of Profilin-1 are required for migration, invasion and capillary morphogenesis of vascular endothelial cells. Exp Cell Res. 2009 doi: 10.1016/j.yexcr.2009.07.004. [DOI] [PMC free article] [PubMed] [Google Scholar]
- 4.Ding Z, Lambrechts A, Parepally M, Roy P. Silencing profilin-1 inhibits endothelial cell proliferation, migration and cord morphogenesis. J Cell Sci. 2006;119(Pt 19):4127–37. doi: 10.1242/jcs.03178. [DOI] [PubMed] [Google Scholar]
- 5.Lu PJ, Shieh WR, Rhee SG, Yin HL, Chen CS. Lipid products of phosphoinositide 3-kinase bind human profilin with high affinity. Biochemistry. 1996;35(44):14027–34. doi: 10.1021/bi961878z. [DOI] [PubMed] [Google Scholar]
- 6.Rao M, Mayor S. Active organization of membrane constituents in living cells. Curr Opin Cell Biol. 2014;29:126–32. doi: 10.1016/j.ceb.2014.05.007. [DOI] [PubMed] [Google Scholar]
- 7.Bae YH, Ding Z, Das T, Wells A, Gertler F, Roy P. Profilin1 regulates PI(3,4)P2 and lamellipodin accumulation at the leading edge thus influencing motility of MDA-MB-231 cells. Proc Natl Acad Sci U S A. 2010;107(50):21547–21552. doi: 10.1073/pnas.1002309107. [DOI] [PMC free article] [PubMed] [Google Scholar]
- 8.Wittenmayer N, Rothkegel M, Jockusch BM, Schlüter K. Functional characterization of green fluorescent protein-profilin fusion proteins. European Journal of Biochemistry. 2000;267(16):5247–5256. doi: 10.1046/j.1432-1327.2000.01600.x. [DOI] [PubMed] [Google Scholar]
- 9.Zou L, Jaramillo M, Whaley D, Wells A, Panchapakesa V, Das T, Roy P. Profilin-1 is a negative regulator of mammary carcinoma aggressiveness. Br J Cancer. 2007;97(10):1361–71. doi: 10.1038/sj.bjc.6604038. [DOI] [PMC free article] [PubMed] [Google Scholar]
- 10.Hebert B, Costantino S, Wiseman PW. Spatiotemporal image correlation spectroscopy (STICS) theory, verification, and application to protein velocity mapping in living CHO cells. Biophys J. 2005;88(5):3601–3614. doi: 10.1529/biophysj.104.054874. [DOI] [PMC free article] [PubMed] [Google Scholar]
- 11.Cooper JA. Effects of cytochalasin and phalloidin on actin. J Cell Biol. 1987;105(4):1473–8. doi: 10.1083/jcb.105.4.1473. [DOI] [PMC free article] [PubMed] [Google Scholar]
- 12.Nejedla M, Sadi S, Sulimenko V, de Almeida FN, Blom H, Draber P, Aspenstrom P, Karlsson R. Profilin connects actin assembly with microtubule dynamics. Mol Biol Cell. 2016;27(15):2381–93. doi: 10.1091/mbc.E15-11-0799. [DOI] [PMC free article] [PubMed] [Google Scholar]
- 13.Lambrechts A, Jonckheere V, Dewitte D, Vandekerckhove J, Ampe C. Mutational analysis of human profilin I reveals a second PI(4,5)-P2 binding site neighbouring the poly(L-proline) binding site. BMC Biochem. 2002;3(1):1–12. doi: 10.1186/1471-2091-3-12. [DOI] [PMC free article] [PubMed] [Google Scholar]
- 14.Schliwa M. Action of cytochalasin D on cytoskeletal networks. J Cell Biol. 1982;92(1):79–91. doi: 10.1083/jcb.92.1.79. [DOI] [PMC free article] [PubMed] [Google Scholar]
- 15.Saka SK, Honigmann A, Eggeling C, Hell SW, Lang T, Rizzoli SO. Multi-protein assemblies underlie the mesoscale organization of the plasma membrane. Nat Commun. 2014;5:4509. doi: 10.1038/ncomms5509. [DOI] [PMC free article] [PubMed] [Google Scholar]
- 16.Ostrander DB, Gorman JA, Carman GM. Regulation of profilin localization in Saccharomyces cerevisiae by phosphoinositide metabolism. J Biol Chem. 1995;270(45):27045–50. doi: 10.1074/jbc.270.45.27045. [DOI] [PubMed] [Google Scholar]
- 17.Goldschmidt-Clermont PJ, Kim JW, Machesky LM, Rhee SG, Pollard TD. Regulation of phospholipase C-gamma 1 by profilin and tyrosine phosphorylation. Science. 1991;251(4998):1231–3. doi: 10.1126/science.1848725. [DOI] [PubMed] [Google Scholar]


