

Abstract
Oligodendrogliomas are primary human brain tumors with a characteristic 1p/19q co-deletion of important prognostic relevance, but little is known about the pathology of this chromosomal mutation. We developed a network-based approach to identify novel cancer gene candidates in the region of the 1p/19q co-deletion. Gene regulatory networks were learned from gene expression and copy number data of 178 oligodendrogliomas and further used to quantify putative impacts of differentially expressed genes of the 1p/19q region on cancer-relevant pathways. We predicted 8 genes with strong impact on signaling pathways and 14 genes with strong impact on metabolic pathways widespread across the region of the 1p/19 co-deletion. Many of these candidates (e.g. ELTD1, SDHB, SEPW1, SLC17A7, SZRD1, THAP3, ZBTB17) are likely to push, whereas others (e.g. CAP1, HBXIP, KLK6, PARK7, PTAFR) might counteract oligodendroglioma development. For example, ELTD1, a functionally validated glioblastoma oncogene located on 1p, was overexpressed. Further, the known glioblastoma tumor suppressor SLC17A7 located on 19q was underexpressed. Moreover, known epigenetic alterations triggered by mutated SDHB in paragangliomas suggest that underexpressed SDHB in oligodendrogliomas may support and possibly enhance the epigenetic reprogramming induced by the IDH-mutation. We further analyzed rarely observed deletions and duplications of chromosomal arms within oligodendroglioma subcohorts identifying putative oncogenes and tumor suppressors that possibly influence the development of oligodendroglioma subgroups. Our in-depth computational study contributes to a better understanding of the pathology of the 1p/19q co-deletion and other chromosomal arm mutations. This might open opportunities for functional validations and new therapeutic strategies.
Electronic supplementary material
The online version of this article (10.1186/s40478-018-0544-y) contains supplementary material, which is available to authorized users.
Keywords: Oligodendrogliomas, 1p/19q co-deletion, Network biology, Network inference, Network propagation, Cancer genomics, Bioinformatics, Computational systems biology
Introduction
Between 4 and 8 percent of all primary human brain tumors are classified as oligodendrogliomas [80]. Oligodendrogliomas belong to the class of diffuse gliomas that typically show infiltrative growth into the surrounding brain tissue, relapse, and progression to more aggressive tumors [54]. Histological similarities to normal oligodendrocytes were used for many years to diagnose oligodendrogliomas [47], but pure histological classifications can vary considerably between neuropathologists [14, 76]. Therefore, molecular markers for a more robust classification of oligodendrogliomas have been explored. First, it has been revealed that the majority of oligodendrogliomas showed a recurrent loss of heterozygosity of the chromosomal arms 1p and 19q (1p/19q co-deletion) associated with improved chemotherapy response and longer relapse-free survival [9, 28, 60]. Further, the 1p/19q-co-deletion is always accompanied by heterozygous somatic point mutations of the isocitrate dehydrogenase gene (IDH1/2) [37]. These IDH-mutations are known to induce the glioma-CpG island methylator phenotype (G-CIMP) [53, 75]. Both characteristic molecular markers (1p/19q co-deletion and IDH mutation) have recently been included into the new 2016 World Health Organization (WHO) classification system for tumors of the central nervous system [48]. This new classification utilizes histological features in combination with the co-occurrence of the 1p/19q co-deletion and the IDH-mutation to diagnose oligodendrogliomas.
So far, the clinical relevance of the oligodendroglioma-specific 1p/19q co-deletion has been well-studied [9, 10, 28, 33, 69, 78], but the pathogenesis of the recurrent 1p/19q co-deletion still remains elusive. The 1p/19q co-deletion is likely to emerge from an unbalanced translocation between the 1q and 19p arm [29]. This suggests that driver genes could be located in close proximity to the fusion points, but no oncogenic fusion genes have been reported. On the other hand, the recurrent 1p/19q co-deletion suggests that tumor suppressors could be located on the 1p and 19q arm. According to the classical two hit hypothesis, both alleles of a tumor suppressor must be mutated to contribute to oncogenesis [36]. The search for inactivating point mutations on the remaining copies of the 1p and 19q arm identified FUBP1 located on 1p and CIC located on 19q as potential tumor suppressors [8, 20]. But FUBP1 mutations are only observed in about 29% and CIC mutations in about 62% of oligodendrogliomas [69]. This implies that these mutations occur later during tumor development and are therefore not responsible for the initial development of oligodendrogliomas. Moreover, it is likely that haploinsufficiency [16, 63] induced by the 1p/19q co-deletion may contribute to the development of oligodendrogliomas. The loss of one allele of each gene on 1p and 19q could directly contribute to oncogenesis by reduced expression levels or indirectly by alterations of regulatory networks. However, standard statistical approaches are not suited to identify differentially expressed driver genes on 1p/19q, because hundreds of genes are down-regulated on both chromosomal arms due to the co-deletion making it impossible to distinguish between driver and passenger genes. Further, the recurrence of virtually identical 1p/19q co-deletions in different oligodendrogliomas does not allow to narrow down chromosomal regions on 1p and 19q where driver genes might be located.
Novel computational strategies are required to search for putative cancer candidate genes located within the region of the 1p/19q co-deletion. Generally, the analysis of gene mutations in the context of gene interaction networks represents a promising strategy to address this challenge [24, 39, 65]. Importantly, we recently showed that gene regulatory networks inferred from gene expression and copy number data can be used to quantify impacts of gene copy number mutations on cancer-relevant target genes [64, 65]. The key idea behind this approach is the propagation of gene expression alterations through a gene regulatory network to determine how individual gene copy number mutations influence the expression of other genes in the network. Utilizing such an approach, each individual gene located within the region of the 1p/19q co-deletion can be analyzed offering the unique possibility to search for novel cancer candidate genes that influence the development of oligodendrogliomas.
Here, we develop a network-based approach to identify novel putative cancer gene candidates for oligodendrogliomas (Fig. 1). We utilized gene expression and copy number data of 178 histologically classified oligodendrogliomas from The Cancer Genome Atlas (TCGA) to learn gene regulatory networks. We used these networks to determine impacts of differentially expressed genes with underlying copy number mutations on known cancer-relevant signaling and metabolic pathway genes utilizing network propagation. We screened the region of the recurrent 1p/19q co-deletion and other rarely mutated chromosomal arms revealing several interesting novel putative cancer candidate genes that have the potential to be involved in the development of oligodendrogliomas.
Fig. 1.

Methodological overview. Gene copy number and expression data of 178 histologically classified oligodendrogliomas from The Cancer Genome Atlas (TCGA) were randomly split into training (two-thirds) and corresponding test (one-third) samples. Oligodendroglioma-specific gene regulatory networks were learned based on gene expression and copy number data of each training set. The obtained networks were validated on their corresponding oligodendroglioma test sets and independent data of closely related oligoastrocytomas from TCGA. Network propagation was applied to genes within the region of the 1p/19q co-deletion to identify those genes that had a strong impact on the expression of known cancer-relevant signaling and metabolic pathways
Materials and methods
Gene copy number and expression data
DNA copy number profiles (aCGH), gene expression data (RNA-seq), and clinical annotations of 178 histologically classified oligodendrogliomas (133 with and 45 without 1p/19q co-deletion) of the TCGA lower grade glioma (LGG, gdc.cancer.gov) cohort and gene expression data (RNA-seq) of three commercially available normal brain samples (StrataGen, BioChain, and Clonetech) from [38] were considered. The tumors represent the 1p/19q and IDHme subgroups described in [38]. Gene copy number profiles of individual tumors were determined from aCGH profiles as described in [65]. Gene expression counts of tumor and normal samples were jointly normalized with the cyclic loess method using the R function voom of the limma package [61]. We finally included gene copy number and gene expression measurements of 12,285 genes in our data set after excluding all genes with very low expression values (less than 1 read count per million reads mapped) in at least 50% of samples. Further, aCGH and gene expression data of 118 histologically classified oligoastrocytomas (34 with and 84 without 1p/19q co-deletion) of the TCGA LGG cohort were processed in the same way and considered for independent network validation. All processed data are contained in Additional file 1: Table S1 and Additional file 2: Table S2.
Identification of chromosomal aberrations and gene copy number mutations
Hierarchical clustering of gene copy number profiles of the 178 histologically classified oligodendrogliomas was done using the R function heatmap.2 (euclidean distance, complete linkage) of the R package gplots [79]. We found that 133 tumors had the characteristic 1p/19q co-deletion (Additional file 3: Figure S1, see [38] for all tumors). We considered each of these tumors with 1p/19q co-deletion and determined deleted and duplicated genes. To realize this, we computed the average copy number log2-ratio ri (ri<0) of tumor to normal DNA within the 1p/19q co-deletion region for tumor i∈{1,⋯,133}. We marked each gene in tumor i as deleted if its gene-specific copy number log-ratio was less than 0.5·ri. In analogy, we marked each gene as duplicated if its log-ratio was greater than − 0.5·ri. We considered a scaling factor of 0.5 to account for the fact that gene copy number measurements are typically noisy depending on the individual tumor content of the patient samples. This enabled us to specify for each tumor all genes and chromosomal regions (e.g. deletion of 4q, duplication of 7p) affected by deletions or duplications that were visible in the heatmap in addition to the 1p/19q co-deletion (Additional file 3: Figure S1).
Identification of differentially expressed genes
Differentially expressed genes between oligodendrogliomas with 1p/19q co-deletion and normal brain samples were derived by moderated t-tests using limma’s standard workflow [61]. P-values were adjusted for multiple testing by computing q-values (R package qvalue) [68]. Under- and overexpressed genes in oligodendrogliomas in comparison to normal brain were selected using a q-value cutoff of 0.05 (Additional file 4: Table S3).
Gene and pathway annotation analysis
Gene annotations (transcription factors/cofactors, kinases, phosphatases, oncogenes, tumor suppressors) and genes included in cancer-relevant signaling and metabolic pathways were obtained from [65]. The number of differentially expressed genes per annotation category was determined separately for under- and overexpressed genes and the significance of gene enrichment in each category was quantified using Fisher’s exact test.
Inference of gene regulatory networks
Gene expression (log2-ratios of tumor to average normal brain) and gene copy number (log2-ratios of tumor to normal DNA) data of all histologically classified oligodendrogliomas were used to learn gene regulatory networks using the R package regNet [64]. Histologically classified oligodendrogliomas without 1p/19q co-deletion were included to increase the variation of gene expression within the region of the 1p/19q co-deletion to support the selection of relevant links between genes. We randomly divided the oligodendrogliomas into a training set containing two-thirds of the tumors (119) for network inference and a test set containing the remaining one-third of tumors (59) for network validation. For each of the 12,285 genes in our data set, regNet models the expression of each gene as a linear combination of its own gene copy number and the expression of all other genes to determine the most relevant predictors (gene-specific copy number and expression of putative regulators) of each gene [64]. To solve each gene-specific linear model, regNet uses lasso regression [70] in combination with a significance test for lasso [46] to estimate the coefficient and corresponding significance (q-value) for each gene-specific predictor. Lasso regression selects the most relevant predictors of each gene and automatically shrinks the coefficients of other irrelevant predictors to zero. To avoid the inclusion of spurious predictors that only represent the local copy number state but not putative regulatory dependencies between genes, we removed local gene-specific predictors 50 genes down- and up-stream of each gene as done in [65]. We finally only considered the most significant predictors of each gene with a q-value equal or less than 0.01. Network inference was very time consuming (390h CPU time per network). Nevertheless, we repeated the genome-wide network inference ten times with different training sets to integrate evidences from different networks into the prediction of novel tumor gene candidates.
Identification of major regulators
To determine major regulators with many outgoing links to other genes, we defined a scoring scheme that integrates the learned networks. We assume that links that are present in more networks are also more relevant than links that are only found in some networks. First, we counted for each gene g∈{1,…,12285} the number of outgoing links cgi that were observed in i∈{1,…,10} of the 10 networks resulting in a count matrix C:=(cgi). Next, we standardized each column sum of C to 1 to account for different numbers of outgoing links involved in counting. Finally, we determined for each gene its score by summing up the corresponding gene-specific row values of the standardized count matrix C. Genes with greater score values have more stable outgoing links across the learned networks than genes with lower scores. This ranking of genes enabled to determine major regulators across the networks and to test if genes of a specific annotation class have greater scores than genes that were not part of this class (Wilcoxon rank sum test).
Validation of learned networks
To assess the prediction quality of individual gene expression levels by each network, we computed correlations between network-based predicted and experimentally measured gene expression levels for each of the ten networks considering the corresponding network-specific oligodendroglioma test set. We further utilized each network to predict the expression levels of 118 histologically classified oligoastrocytomas (34 with 1p/19q co-deletion, 84 without 1p/19q co-deletion), a tumor type that is closely related to oligodendrogliomas [38, 48]. In addition, to have baseline models for the different validation data sets, we computed 25 random networks (degree-preserving network permutations) for each of the ten learned networks using regNet [64] to compare their prediction quality to those of the ten original networks. To summarize the prediction results of the different networks, we computed median correlations between predicted and measured expression levels and we further analyzed if the obtained median correlation distribution of the original networks was significantly shifted into the positive range compared to the correlation distribution of the random networks using a Wilcoxon rank sum test.
Network-based impact quantification of gene copy number mutations on signaling and metabolic pathways
We considered all oligodendrogliomas with 1p/19q co-deletion to analyze how differentially expressed genes between tumor and normal brain tissue located within the region of the 1p/19q co-deletion impact on cancer-relevant signaling and metabolic pathways. We used the network propagation algorithm implemented in regNet [64] to realize this. This algorithm considers a learned network and the prediction quality of individual genes to compute direct and indirect impacts between each pair of genes considering all possible network paths (Fig. 1). We have previously shown that this algorithm can correctly predict downstream impacts of gene perturbation experiments [65].
We first computed the total strength of impacts that flow from a differentially expressed gene located within the region of the 1p/19q co-deletion to individual signaling and metabolic pathway genes for each of the ten learned networks. To compare the obtained impacts to random baseline models, we considered the 25 random network instances computed for each of the ten networks to determine the corresponding average impacts of each differentially expressed gene of the 1p/19q region on all signaling and metabolic genes. We next compared the median impact of each gene under the ten original networks to the corresponding average impacts of this gene under the random networks using a paired one-sided Wilcoxon rank sum test and further corrected for multiple testing by computing q-values [68]. We used a paired test to account for the fact that the random networks that belong to each of the ten individual networks were derived by degree-preserving network permutations. We considered a one-sided test because only genes with greater impact obtained under corresponding random models are of interest. We considered differentially expressed genes within the region of the 1p/19q co-deletion as high-impact genes if they had significantly greater impacts on signaling or metabolic pathways than under corresponding random networks using a q-value cutoff of 0.05.
Moreover, we also analyzed impacts of differentially expressed genes in chromosomal regions that were much less frequently affected by deletions or duplications in oligodendrogliomas. We specifically focused on aberrations of whole chromosomal arms in addition to the characteristic 1p/19q co-deletion. To account for noisy gene copy number measurements, we defined a chromosomal arm to be mutated if at least 80% of its genes were duplicated or deleted, respectively. To validate the considered mutated chromosomal arms, we compared our predictions to those reported for oligodendrogliomas of the POLA cohort [33] and found that they have been previously described (Table 1). We considered each chromosomal arm that was mutated in at least six oligodendrogliomas with 1p/19q co-deletion and defined a corresponding subcohort of oligodendrogliomas that showed these mutations. We considered each subcohort and computed for all differentially expressed genes located on the mutated chromosomal arm corresponding impacts on signaling and metabolic pathway genes as described above.
Table 1.
Statistics of rarely mutated chromosomal arms
| Deletions | Duplications | |||||||
|---|---|---|---|---|---|---|---|---|
| Chromosomal arm | 4q | 9q | 13q | 15q | 18q | 7p | 7q | 11q |
| TCGA: OD II + III | 9.8% | 4.5% | 10.5% | 9.0% | 15.0% | 6.0% | 9.0% | 4.5% |
| TCGA: OD III | 13.8% | 5.2% | 10.3% | 12.1% | 20.7% | 6.9% | 10.3% | 6.9% |
| POLA: OD III | 16.2% | 14.7% | 5.9% | 14.7% | 8.8% | 4.4% | 7.3% | 19.1% |
Chromosomal arms affected by deletions (4q, 9q, 13q, 15q and 18q) and duplications (7p, 7q and 11q) in subsets of oligodendrogliomas in addition to the characteristic 1p/19q co-deletion. Percentages of affected oligodendrogliomas are shown for the TCGA cohort (TCGA: OD II + III comprised 133 oligodendrogliomas of WHO grades II and III, TCGA: OD III comprised 58 oligodendrogliomas of WHO grade III) and the POLA cohort [33] (POLA: OD III comprised 68 oligodendrogliomas of WHO grade III)
Results and discussion
Many under- and several overexpressed genes are observed within the region of the 1p/19q co-deletion
We considered all oligodendrogliomas with 1p/19q co-deletion and compared their gene expression profiles to normal brain references to identify differentially expressed genes. We observed 3,068 (23.8%) under- and 3204 (24.9% of genes) overexpressed genes in oligodendrogliomas (q-value < 0.05, Additional file 4: Table S3). Only few strongly underexpressed tumor suppressors (log-ratio <−2: ANO3 and CDH1), but several strongly overexpressed oncogenes (log-ratio > 2: MYC, EGFR, PDGFRA, PIK3CA, PRRX1, ASCC3, ZNF117, CRISPLD1, CSMD3, ALDH1L2, MDGA2, TSHR and H3F3A) were among these genes.
Considering chromosomal locations, we found that 524 underexpressed genes (45.2% of genes on 1p/19q) and interestingly also 130 overexpressed genes (11.2% of genes on 1p/19q) were located within the region of the 1p/19q co-deletion. We observed strong underexpression for 74 of the 524 underexpressed genes on 1p/19q (log-ratio <−2). The ten most strongly underexpressed genes on 1p/19q were LC17A7, PRKCG, RIMS3, KIAA1324, AK5, SLC6A17, CD22, HPCA, MAG and CHD5. We also observed strong overexpression for 10 of the 130 overexpressed genes on 1p/19q (log-ratio > 2: SAMD11, SLC35E2, HES5, GRHL3, RCC1, SPOCD1, HFM1, DLL3, IL4I1 and CACNG6). Interestingly, DLL3 and HES5 are part of the Notch signaling pathway involved in oligodendrocyte specification [56] restricting cell proliferation and tumor growth in glioma mouse models [22].
We further analyzed all differentially expressed genes in the context of known cancer-relevant signaling pathways (Fig. 2). We observed that especially the Notch and Hedgehog signaling were strongly enriched for overexpressed genes, whereas MAPK signaling was enriched for underexpressed genes (Fig. 2a). In addition, also ErbB signaling and the Adherens junction pathway tended to show an enrichment of underexpressed genes. Considering metabolic pathways, we found that the oxidative phosphorylation pathway was enriched for underexpressed genes (Fig. 2b). Also the pyrimidine, purine and pentose phosphate pathway tended to show some enrichment of differentially expressed genes.
Fig. 2.

Signaling and metabolic pathway analysis of differentially expressed genes. Differentially expressed genes between oligodendrogliomas and normal brain references (q-value < 0.05, Additional file 4: Table S3) were mapped to known cancer-relevant signaling (a) and metabolic pathways (b). The number of over- and underexpressed genes are shown for each pathway. Asterisks symbols highlight pathways enriched for over- or underexpressed genes (Fisher’s exact test with ’*’ for P<0.1 and ’**’ for P<0.05)
Transcriptional regulatory networks predict tumor gene expression levels
To provide the basis for the impact quantification of gene copy number mutations on cancer-relevant pathways, we used regNet [64] to learn genome-wide transcriptional regulatory networks based on gene copy number and expression data of 178 histologically classified oligodendrogliomas with and without 1p/19q co-deletion. We repeated the genome-wide network inference ten times utilizing different training and test data sets (see “Materials and methods” section for details). The resulting networks had on average 67,900 ± 1080 directed links between regulators and target genes (Additional file 3: Figure S3). More than three quarters of these links were activator links (78%) and the others were inhibitor links.
Next, we integrated the outgoing links of each gene across the ten networks to derive a connectivity score that accounts for the co-occurrence of links (see “Materials and methods” for details). This score is higher for genes with more stable outgoing links across n of networks than for genes with less co-occurring links. We utilized these scores and found that tumor suppressor genes, oncogenes, essential genes and signaling pathway genes had significantly greater connectivity scores than genes that were not included in these categories (Wilcoxon rank sum tests: P=0.035 for tumor suppressors, P=0.028 for oncogenes, P=5.39·10−9 for essential genes, P=0.01 for signaling pathway genes). The ten genes with the greatest connectivity score were (GARS, CCDC85B, NDUFA1, SPRED2, BIRC6, MRPL45, EDA2R, HMGCS1, SLC17A7, RAB40B; Additional file 3: Figure S4). CCDC85B is a known downstream target of p53 signaling with reported function as tumor suppressor [26]. Also SPRED2 is a known tumor suppressor that induces autophagy [32]. SLC17A7 has been observed as a tumor suppressor in a glioblastoma stem cell line [44]. BIRC6 can inhibit apoptosis in glioblastoma cell lines [11]. RAB40B is a member of the RAS oncogene family potentially involved in the remodeling of the extracellular matrix during invasion of breast cancer [27]. Other genes like GARS, NDUFA1, HMGCS1, and SLC17A7 have known functions in cellular metabolism. This clearly indicates that major regulators in our networks are known to have important cancer-relevant functions.
We further tested the capability of each network to predict the expression level of each of the 12,285 genes in independent oligodendroglioma (59 randomly selected tumors left out from network learning) and closely related oligoastrocytoma (118 samples including 34 tumors with and 84 tumors without 1p/19q co-deletion) test sets that were not considered for network inference. To realize this, we computed correlations between originally measured gene expression levels and corresponding network-based predicted gene expression levels across all tumor samples in each test set for each of the ten networks to analyze the prediction quality. Corresponding median gene-specific correlations integrating the prediction results of the ten networks are summarized in Fig. 3 (see Additional file 3: Figure S5 for individual networks). Overall, the vast majority of genes showed strong positive correlations between measured and predicted expression values with a median correlation of 0.75 for the oligodendroglioma test sets and a median correlation of 0.73 for the oligoastrocytoma test set. We also compared these results to predictions of gene expression levels that were obtained from random networks of same complexity as the originally learned networks (degree-preserving network permutations). We found that our networks made significantly better predictions of originally measured gene expression levels than corresponding random networks (Fig. 3, Wilcoxon rank sum test: P<2.2·10−16 for each of both test sets).
Fig. 3.
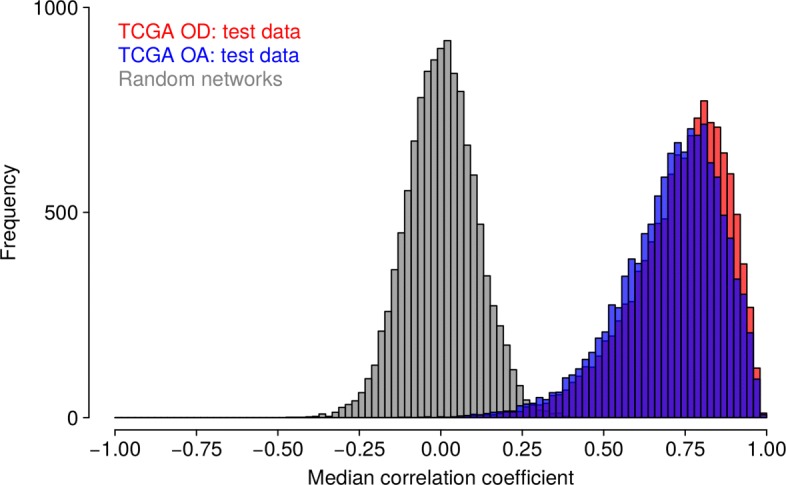
Network-based prediction quality of gene expression levels. The ten learned gene regulatory networks were analyzed for their performance to predict the expression levels of the 12,285 genes in independent tumor test sets (TCGA OD: 59 network-specific oligodendrogliomas left out from network inference, TCGA OA: 118 closely related oligoastrocytomas). Corresponding histograms of gene-specific median correlations between predicted and measured gene expression levels are shown. The strong shift of both histograms (red, blue) into the positive range shows that the prediction quality of oligodendroglioma-specific networks was significantly better than for random networks (grey) of same complexity (Wilcoxon rank sum tests: P<2.2·10−16)
Genes directly affected by the 1p/19q co-deletion strongly impact on cancer-relevant signaling pathways
We utilized the learned networks to determine impacts of differentially expressed genes located within the region of the 1p/19q co-deletion on known cancer-relevant signaling pathway genes (see Fig. 1 for an illustration). To realize this, we considered the 654 differentially expressed genes observed within the 1p/19q region (524 under- and 130 overexpressed genes with q-values < 0.05, Additional file 4: Table S3) and applied regNet [64] to compute impacts of these genes on the expression of signaling pathway genes using network propagation. We did this independently for each network and computed corresponding impacts for each gene pair under random networks. We further integrated the scores of the ten networks and determined all differentially expressed 1p/19q-genes with significantly greater impacts on the expression of known cancer signaling pathway genes than under random networks (paired Wilcoxon rank sum tests, q-value < 0.05, see “Materials and methods” section for details). Predicted high-impact genes are shown in Fig. 4a and provided in Additional file 5: Table S4. We performed in-depth literature searches and analyzed gene annotations [62] to characterize cellular functions and known cancer-relevant impacts of these genes.
Fig. 4.

Genes located in the region of the 1p/19q co-deletion with strong impact on signaling and metabolic pathways. Impacts of differentially expressed genes of the 1p/19q region on the expression of known cancer-relevant signaling pathway genes (a) and metabolic pathway genes (b). All shown genes had significantly greater impacts under the oligodendroglioma-specific gene regulatory networks than under corresponding random networks of same complexity (q-value ≤0.05). The high-impact genes are widespread across the region of the 1p/19q co-deletion. Genes colored in green were underexpressed and genes colored in red were overexpressed in oligodendrogliomas compared to normal brain tissue
The gene with the greatest impact on signaling pathway genes was ELTD1 located on the 1p arm. ELTD1 encodes for a G-protein coupled receptor. The deletion of one copy of the 1p arm in oligodendrogliomas did not lead to a reduced expression of ELTD1. We found ELTD1 significantly overexpressed in oliogodendrogliomas compared to normal brain tissue. ELTD1 has been identified to represent a key player of tumor angiogenesis [50]. ELTD1 has also been functionally validated as oncogene in glioblastomas [72, 86]. The microRNA-139-5p has been reported to act as a tumor suppressor inhibiting ELTD1 expression in glioblastoma cell lines [15].
The only detected high-impact gene located on the 19q arm with strong impact on signaling pathway genes was KLK6. KLK6 encodes for a serine-protease and was strongly underexpressed in oligodendrogliomas compared to normal brain tissue. High expression levels of KLK6 have been associated with poor prognosis of intracranial tumors [18] and resistance of glioblastomas to cytotoxic agents [19]. KLK6 has recently been found to be involved in the control of metastasis formation in colon cancer [66].
PTAFR located on the 1p arm encodes for a G-protein coupled receptor involved in the regulation of cell proliferation and angiogenesis. PTAFR was strongly underexpressed in oligodendrogliomas compared to normal brain. PTAFR is a putative oncogene and has been reported to play a role in different types of cancer including the activation of PI3K-Akt signaling in esophageal cancer [12] or the support of prostate cancer development via ERK1/ERK2 signaling [30].
ZBTB17 located on the 1p arm was underexpressed in oligodendrogliomas compared to normal brain tissue. ZBTB17 encodes a transcriptional regulator interacting with MYC-genes. Reduced expression of ZBTB17 due to heterozygous loss of 1p36 has been reported to increase the aggressiveness of neuroblastomas [25]. This suggests that ZBTB17 is a putative tumor suppressor gene.
CAP1 located on the 1p arm was underexpressed in oligodendrogliomas compared to normal brain tissue. CAP1 is involved in the cyclic AMP pathway and interacts with the actin cytoskeleton influencing cell adhesion [82]. CAP1 expression has been reported to be positively correlated with proliferation, migration, invasion, and WHO grade of gliomas [3, 21].
So far, no roles in cancer have been reported for the two overexpressed high-impact genes THAP3 and ZMYM1 located on the 1p arm. Both genes are likely to encode transcription factors. THAP3 is involved in the regulation of cell proliferation [51]. ZMYM1 could be involved in the regulation of the cytoskeletal organization and cell morphology.
Further, we used our network propagation algorithm to predict potential regulatory downstream effects of high-impact genes on individual cancer-relevant signaling pathways (Additional file 3: Figure S6a). Especially the overexpression of ELTD1 and the underexpression of PTAFR in oligodendrogliomas tend to influence the expression of several signaling pathways suggesting complex regulatory dependencies that support or counteract oligodendroglioma growth. Specific impacts of individual high-impact genes are summarized in Additional file 3: Texts S1.
In summary, depending on the expression states in combination with reported roles in cancer, genes like ELTD1, ZBTB17, or THAP3 are likely to support oligodendroglioma growth, whereas other genes like KLK6, PTAFR, or CAP1 may restrict the speed of tumor growth. This might contribute to the overall better prognosis of oligodendroglioma patients in comparison to patients with other gliomas [69].
Genes directly affected by the 1p/19q co-deletion strongly impact on metabolic pathways
Similar to the analysis of signaling pathways, we used network propagation to identify those differentially expressed genes within the region of the 1p/19q co-deletion that had strong impacts on the expression of metabolic pathway genes. We predicted 14 high-impact genes widespread across the 1p/19q region (q-value < 0.05, Fig. 4b, Additional file 6: Table S5). All genes were underexpressed in oligodendrogliomas compared to normal brain, except for overexpressed DPH5. Two genes with strong impact on signaling pathways (KLK6, PTAFR) were also among these high-impact genes. In contrast to our previous impact quantification for signaling pathways that revealed only one high-impact gene on the 19q arm (Fig. 4a), we now found six genes (MAG, COX6B1, EIF3K, SEPW1, SLC17A7, KLK6) with strong impact on the expression of metabolic pathway genes on 19q (Fig. 4b). We again performed in-depth gene annotation analyses and literature searches to summarize known functions and roles in cancer.
SLC17A7, the gene with the greatest impact on the expression of metabolic pathways, has been observed as tumor suppressor in a glioblastoma stem cell line [44]. SLC17A7 is located on the 19q arm, encodes for a vesicle-bound, sodium-dependent phosphate transporter expressed in neuron-rich regions, and was strongly underexpressed in oligodendrogliomas compared to normal brain.
SDHB is located on the 1p arm, encodes for the succinate dehydrogenase complex subunit B, and was underexpressed in oligodendrogliomas in comparison to normal brain. Germline mutations of SDHB have been reported for patients with head and neck paraganglioma [5] and phaeochromocytomas [7]. Succinate accumulated in SDHB-mutated cells inhibits alpha-ketoglutarate-dependent enzymes leading to the activation of hypoxia induced genes and hypermethylation of DNA and histones in paraganglioma [4, 40]. Similarly, a knockdown of SDHB in mouse ovarian cancer cells enhanced cell proliferation and induced hypermethylation of histones promoting an epithelial-to-mesenchymal transition [2]. All these findings suggest that reduced expression of SDHB in oligodendrogliomas may support and possibly enhance the epigenetic reprogramming via the same pathomechanism induced by a heterozygous IDH-mutation that is found in each oligodendroglioma [13, 48].
PARK7 located on the 1p arm was underexpressed in oligodendrogliomas compared to normal brain tissue. PARK7 encodes for a peptidase that protects cells against oxidative stress. Downregulation of PARK7 has been associated with a reduction of cell proliferation, migration, and invasion of glioma cell lines [31]. Downregulation of PARK7 in clear renal cell carcinoma cells increased cisplatin-induced apoptosis [73]. PARK7 has been reported as oncogene in different cancers activating PI3K-Akt, MAPK, and mTOR signaling to protect cells against hypoxic stress [77].
HBXIP located on the 1p arm was underexpressed in oligodendrogliomas compared to normal brain tissue. HBXIP functions as a cofactor of survivin in the suppression of apoptosis [49]. HBXIP has been reported to promote the proliferation and migration of breast cancer cells [45]. Conversely, suppression of HBXIP has been found to reduce cell proliferation, migration and invasion of bladder carcinomas [42]. This suggests that the underexpression of HBXIP could counteract oligodendroglioma growth.
SEPW1 is located on 19q, encodes for a selenoprotein that functions as an glutathione antioxidant, and was underexpressed in oligodendrogliomas compared to normal brain. SEPW1 has been mapped to a putative tumor suppressor region on the 19q arm of gliomas [67]. SEPW1 has been shown to be involved in the control of cell cycle progression [23] and to regulate expression, activation and degradation of EGFR [1].
C1orf144 (SZRD1) located on 1p was underexpressed in oligodendrogliomas in comparison to normal brain tissue. C1orf144 has recently been reported as a potential tumor suppressor in cervical cancer involved in the regulation of cell cycle arrest in G2 and induction of apoptosis [84].
MAG located on 19q was underexpressed in oligodendrogliomas compared to normal brain tissue. MAG encodes for a membrane protein involved in myelination of oligodendrocytes, protection of neurons against apoptosis, and inhibition of neurite outgrowth [59].
Further, only DPH5 located on 1p was overexpressed in oligodendrogliomas compared to normal brain. DPH5 encodes for a specific methionine-dependent methyltransferase involved in diphthamide synthesis. Diphthamide, a post-transcriptionally modified histidine, is required for eEF-2, which is essential for protein biosynthesis. Further, two underexpressed high-impact genes, RPL22 and EIF3K, known to be important for protein synthesis were found. Strong impacts of genes involved in protein synthesis might represent a byproduct of increased transcription in tumors. In addition, COX6B1 located on 19q and ATP5F1 located on 1p were underexpressed in oligodendrogliomas in comparison to normal brain. Both genes have functions in the respiratory chain.
In addition, we also used our network propagation algorithm to further predict potential regulatory downstream effects of high-impact genes from Fig. 4b on individual metabolic pathways (Additional file 3: Figure S6b). Interestingly, six genes were predicted to contribute to a downregulation of the oxidative phosphorylation. Detailed information to specific impacts of individual high-impact genes are summarized in Additional file 3: Text S1.
Again, genes like SLC17A7, SDHB, SEPW1, or SZRD1 may support oligodendroglioma growth and other genes like PARK7 or HBXIP may restrict the speed of tumor growth. Such counteracting impacts could contribute to a better prognosis [69].
Impact of rare gene copy number mutations on cancer-relevant signaling and metabolic pathways
We further used our network-based impact quantification strategy to determine if potential candidate genes with high-impact on signaling or metabolic pathways are located on chromosomal arms that were rarely affected by deletions or duplications in oligodendrogliomas with 1p/19q co-deletion (Table 1; deletions: 4q, 9q, 13q, 15q, 18q; duplications: 7p, 7q, 11q; Additional file 3: Figure S1). All these additional mutations have previously been observed in the POLA cohort [33] and several of these mutations were also observed in copy number profiles of single oligodendroglioma cells [71]. These additional copy number mutations occurred more frequently in oligodendrogliomas of WHO grade III than in grade II tumors suggesting that they are associated with tumor progression and may impact on survival [35, 74]. See Additional file 3: Text S2 for further details to subgroups of oligodendrogliomas with additional chromosomal arm mutations. We first determined for each subcohort of oligodendrogliomas with a specific chromosomal arm mutation all differentially expressed genes in comparison to normal brain tissue (q-value ≤0.05). We next analyzed all differentially expressed genes of a mutated chromosomal arm to identify those genes that were predicted to have a strong impact on the expression of cancer-relevant signaling (Additional file 7: Table S6) and metabolic pathways (Additional file 8: Table S7) utilizing network propagation. We predicted 15 differentially expressed genes with strong impact on signaling pathways on the chromosomal arms 4q, 9q, 7p, 7q, 11q, and 18q (Fig. 5a–f) and 12 genes with strong impact on metabolic pathways on the chromosomal arms 7p, 11q, 15q, and 18q (Fig. 5g–i, 7p not shown) at a q-value cutoff of 0.1 (less stringent than before because of much smaller sample sizes). Functional annotations and literature searches of all predicted high-impact genes are summarized in Additional file 3: Text S3 for signaling pathways and in Additional file 3: Text S4 for metabolic pathways. Next, we only briefly highlight some findings.
Fig. 5.

Genes located on rarely mutated chromosomal arms with strong impact on signaling and metabolic pathways. Impacts of differentially expressed genes of rarely mutated chromosomal arms (Table 1) on the expression of known cancer-relevant signaling pathway genes (a–f) and metabolic pathway genes (g–i). All shown genes had significantly greater impacts under the oligodendroglioma-specific gene regulatory networks than under corresponding random networks of same complexity (q-value ≤0.1). Genes colored in green were underexpressed and genes colored in red were overexpressed in oligodendrogliomas with the corresponding chromosomal arm mutation in comparison to normal brain tissue
Considering genes with high-impact on signaling pathways (Fig. 5a–f), we identified several overexpressed genes in subcohorts of oligodendrogliomas with additional chromosomal arm mutations that were previously found to be involved in tumorigenesis. For example, EMCN located on the q-arm of chromosome 4 was overexpressed in oligodendrogliomas with 4q deletion. EMCN encodes a glycoprotein that can inhibit adhesion of cells to the extracellular matrix [34]. EIF3B located on the p-arm of chromosome 7 was overexpressed in oligodendrogliomas with 7p duplication. EIF3B encodes a subunit of the eukaryotic translation initiation factor. A knockdown of EIF3B inhibited cell proliferation and increased apoptosis in a glioblastoma cell line [43]. CALD1 located on the q-arm of chromosome 7 was overexpressed in oligodendrogliomas with 7q duplication. CALD1 is involved in the regulation of the neovascularization of gliomas [85] and has been associated with tamoxifen resistance of breast cancer [17]. Also DNAJB6 located on the q-arm of chromosome 7 was overexpressed in oligodendrogliomas with 7q duplication. Overexpression of DNAJB6 has been reported to promote invasion of colorectal cancer [83]. In addition to these putative oncogenes, we also observed two overexpressed genes with potential tumor suppressor functions that may counteract oligodendroglioma development. DMTF1 located on 7q encodes a transcription factor with a cyclin D-binding domain that has been shown to inhibit cell growth and cell cycle progression in bladder cancer [57]. Further, FAU located on 11q encodes a fusion protein that has been reported to be involved in the regulation of apoptosis of breast cancer [58].
Considering genes with high-impact on metabolic pathways (Fig. 5g–i), we identified four underexpressed genes in subcohorts of oligodendrogliomas with additional chromosomal arm mutations with functions in cellular energy metabolism and impacts on cell migration, apoptosis, or blood vessel development in cancer (deletion of 15q: COX5A, PKM2; deletion of 18q: ATP5A1; duplication of 11q: PYGM; Additional file 3: Text S4). In addition, UBXN1 located on the q-arm of chromosome 11 was overexpressed in oligodendrogliomas. UBXN1 encodes a ubiquitin-binding protein and has been reported to inhibit the tumor suppressor BRAC1 [81]. Interestingly, we found that SDHD located on 11q was overexpressed in oligodendrogliomas with 11q duplication. This might represent a response to the reduced expression of SDHB discussed before. Further, activation of the expression of the tumor suppressor CDKN1A in response to the loss of SDHD expression has been reported [52]. Thus, overexpressed SDHD might counteract the expression of CDKN1A to support cell proliferation. Moreover, also ACAT1 located on 11q was overexpressed. ACAT1 encodes a mitochondrially localized acetyl-CoA acetyltransferase. Inhibition of ACAT1 by Avasimibe inhibited cell growth by inducing cell cycle arrest and apoptosis in glioblastoma cell lines [6, 55]. Further, inhibition of ACAT1 has also been shown to suppress growth and metastasis of pancreatic cancer [41].
In-depth analysis of known potential tumor suppressor genes FUBP1 and CIC
We also performed a detailed analysis of the expression behavior and corresponding network-based impacts of the potential tumor suppressors FUBP1 and CIC reported for oligodendrogliomas [8]. FUBP1 located on 1p and CIC located on 19q were both moderately underexpressed in oligodendrogliomas with 1p/19q co-deletion compared to normal brain references (Additional file 4: Table S3). Further, oligodendrogliomas with additional small deletions, insertions or point mutations within FUBP1 or CIC showed moderately reduced expression of these genes compared to oligodendrogliomas without mutations. This trend was much stronger for tumors with FUBP1 mutations (average expression 4.58 vs. 5.25 comparing 38 tumors with to 95 tumors without mutation, t-test: P=0.0001) than for tumors with CIC mutations (average expression 6.42 vs. 6.60 comparing 85 tumors with to 48 tumors without mutation, t-test: P=0.01).
Further, FUBP1 has been reported to negatively regulate the expression of MYC [8]. This relationship was also predicted by our network propagation approach. FUBP1 had a stronger impact on MYC comparing our networks to corresponding random networks (paired Wilcoxon rank test: P<0.001, see “Materials and methods” for details). Globally, FUBP1 and CIC underexpression had moderate impacts on different signaling and metabolic pathways (Additional file 3: Figure S7). Thus, reduced expression of both genes due to the 1p/19q co-deletion could contribute to tumor development, but both genes were not among the predicted putative high impact genes with altered gene expression levels. Still, other pathomechanisms triggered by small deletions, insertions or point mutations within FUBP1 or CIC could play an important role in affected tumors.
Conclusions
The clinical relevance of the 1p/19q co-deletion has been known for many years, but detailed insights to underlying pathomechanisms are not known. Our computational approach provides a novel starting point to characterize molecular changes induced by the 1p/19q co-deletion. We predicted several interesting cancer candidate genes widespread across the region of the 1p/19q co-deletion with strong impact on signaling and metabolic pathways. These candidate genes are possibly involved in the development of oligodendrogliomas. Interestingly, several of these genes (e.g. ELTD1, SDHB, SEPW1, SLC17A7, SZRD1, THAP3, ZBTB17) are likely to push, whereas other genes (e.g. CAP1, HBXIP, KLK6, PARK7, PTAFR) might restrict oligodendroglioma development. This observation could contribute to the fact that oligodendrogliomas have an improved prognosis in comparison to other types of gliomas. Importantly, the overexpression of ELTD1 in oligodendrogliomas despite the loss of 1p indicates that this gene may act as oncogene as reported for closely related glioblastomas. Similarly, the underexpression of SLC17A7 in oligodendrogliomas may counteract its known function as tumor suppressor reported for glioblastomas. Moreover, the underexpression of SDHB may contribute to the epigenetic reprogramming of oligodendrogliomas via the same pathomechanism as triggered by the IDH-mutation. All these findings indicate that several genes located on 1p/19q may simultaneously influence tumor development. Further, we also predicted cancer candidate genes on rarely mutated chromosomal arms that are likely to contribute to oligodendroglioma development and tumor progression in subcohorts of patients. In sum, our computational predictions contribute to a better understanding of the pathology of the 1p/19q co-deletion, might open opportunities for novel experimental studies, and possibly trigger ideas for the development of targeted treatment strategies.
Additional files
Table S1. Gene copy number data. (XLS 68300 kb)
Table S2. Gene expression data. (XLS 48300 kb)
Texts S1–S4 and Figures S1–S7. (PDF 1800 kb)
Table S3. Differentially expressed genes between oligodendrogliomas with 1p/19q co-deletion and normal brain tissue. (XLS 2240 kb)
Table S4. Genes located on 1p/19q with strong impact on signaling pathways. (XLS 115 kb)
Table S5. Genes located on 1p/19q with strong impact on metabolic pathways. (XLS 115 kb)
Table S6. Genes located on rarely mutated chromosomal arms with strong impact on signaling pathways. (XLS 187 kb)
Table S7. Genes located on rarely mutated chromosomal arms with strong impact on metabolic pathways. (XLS 187 kb)
Acknowledgements
This study would have been impossible without the comprehensive data sets made publicly available by the TCGA Research Network. We thank the reviewers for their valuable comments. We thank Chris Lauber (IMB TU Dresden) for support in data acquisition.
Funding
We thank the Else Kröner-Fresenius-Stiftung for financial support of the study within the Else Kröner Promotionskolleg Dresden. We acknowledge support by the German Research Foundation and the Open Access Publication Funds of the SLUB/TU Dresden to cover the article processing charge.
Availability of data and materials
Data of all considered TCGA tumors are publicly available from the The Genomic Data Commons Data Portal (https://portal.gdc.cancer.gov/). Processed gene expression and copy number data are contained in the Additional files 1 and 2. Utilized algorithms for network inference and network propagation are publicly available from GitHub (https://github.com/seifemi/regNet).
Abbreviations
- 1p
p-arm of chromosome 1
- 19q
q-arm of chromosome 19
- OD
oligodendroglioma
- TCGA
The cancer genome atlas
- WHO
World health organization
Authors’ contributions
MS designed the study. JG performed the analysis. BK supported the biological interpretation. MS and JG wrote the manuscript. All authors read and approved the final manuscript.
Ethics approval and consent to participate
No ethical approval was required for this study. All utilized public omics data sets were generated by others who obtained ethical approval.
Competing interests
The authors declare that they have no competing interests.
Publisher’s Note
Springer Nature remains neutral with regard to jurisdictional claims in published maps and institutional affiliations.
Footnotes
Electronic supplementary material
The online version of this article (10.1186/s40478-018-0544-y) contains supplementary material, which is available to authorized users.
Contributor Information
Josef Gladitz, Email: josef.gladitz@mailbox.tu-dresden.de.
Barbara Klink, Email: barbara.klink@uniklinikum-dresden.de.
Michael Seifert, Email: michael.seifert@tu-dresden.de.
References
- 1.Alkan Z, Duong FL, Hawkes WC. Selenoprotein W controls epidermal growth factor receptor surface expression, activation and degradation via receptor ubiquitination. Biochim Biophys Acta. 2015;1853(5):1087–95. doi: 10.1016/j.bbamcr.2015.02.016. [DOI] [PubMed] [Google Scholar]
- 2.Aspuria PP, Lunt SY, Väremo L, Vergnes L, Gozo M, Beach JA, et al (2014) Succinate dehydrogenase inhibition leads to epithelial-mesenchymal transition and reprogrammed carbon metabolism. Cancer Metab 2:21. 10.1186/2049-3002-2-21. [DOI] [PMC free article] [PubMed]
- 3.Bao Z, Qiu X, Wang D, Ban N, Fan S, Chen W, et al. High expression of adenylate cyclase-associated protein 1 accelerates the proliferation, migration and invasion of neural glioma cells. Pathol - Res Pract. 2016;212(4):264–273. doi: 10.1016/j.prp.2015.12.017. [DOI] [PubMed] [Google Scholar]
- 4.Baysal BE, Maher ER. 15 YEARS OF PARAGANGLIOMA: genetics and mechanism of pheochromocytoma-paraganglioma syndromes characterized by germline SDHB and SDHD mutations. Endocr Relat Cancer. 2015;22(4):71–82. doi: 10.1530/ERC-15-0226. [DOI] [PubMed] [Google Scholar]
- 5.Baysal BE, Willett-Brozick JE, Lawrence EC, Drovdlic CM, Savul SA, McLeod DR, et al. Prevalence of SDHB, SDHC, and SDHD germline mutations in clinic patients with head and neck paragangliomas. J Med Genet. 2002;39(3):178–83. doi: 10.1136/jmg.39.3.178. [DOI] [PMC free article] [PubMed] [Google Scholar]
- 6.Bemlih S, Poirier M-D, Andaloussi AE. Acyl-coenzyme A: cholesterol acyltransferase inhibitor Avasimibe affect survival and proliferation of glioma tumor cell lines. Cancer Biol Ther. 2010;9(12):1025–1032. doi: 10.4161/cbt.9.12.11875. [DOI] [PubMed] [Google Scholar]
- 7.Benn DE, Croxson MS, Tucker K, Bambach CP, Richardson AL, Delbridge L, et al. Novel succinate dehydrogenase subunit B (SDHB) mutations in familial phaeochromocytomas and paragangliomas, but an absence of somatic SDHB mutations in sporadic phaeochromocytomas. Oncogene. 2003;22(9):1358–64. doi: 10.1038/sj.onc.1206300. [DOI] [PubMed] [Google Scholar]
- 8.Bettegowda C, Agrawal N, Jiao Y, Sausen M, Wood LD, Hruban RH, et al. Mutations in CIC and FUBP1 contribute to human oligodendroglioma. Science. 2011;333(6048):1453–1455. doi: 10.1126/science.1210557. [DOI] [PMC free article] [PubMed] [Google Scholar]
- 9.Cairncross JG, Ueki K, Zlatescu MC, Lisle DK, Finkelstein DM, Hammond RR, et al. Specific genetic predictors of chemotherapeutic response and survival in patients with anaplastic oligodendrogliomas. J Natl Cancer Inst. 1998;90(19):1473–9. doi: 10.1093/jnci/90.19.1473. [DOI] [PubMed] [Google Scholar]
- 10.Ceccarelli M, Barthel FP, Malta TM, Sabedot TS, Salama SR, Murray BA, et al. Molecular profiling reveals biologically discrete subsets and pathways of progression in diffuse glioma. Cell. 2016;164(3):550–563. doi: 10.1016/j.cell.2015.12.028. [DOI] [PMC free article] [PubMed] [Google Scholar]
- 11.Chakrabarti M, Klionsky DJ, Ray SK. mir-30e blocks autophagy and acts synergistically with proanthocyanidin for inhibition of AVEN and BIRC6 to increase apoptosis in glioblastoma stem cells and glioblastoma SNB19 cells. PLoS ONE. 2016;11(7):0158537. doi: 10.1371/journal.pone.0158537. [DOI] [PMC free article] [PubMed] [Google Scholar]
- 12.Chen J, Lan T, Zhang W, Dong L, Kang N, Zhang S, et al. Platelet-activating factor receptor-mediated PI3k/AKT activation contributes to the malignant development of esophageal squamous cell carcinoma. Oncogene. 2015;34(40):5114–5127. doi: 10.1038/onc.2014.434. [DOI] [PubMed] [Google Scholar]
- 13.Cohen A, Holmen S, Colman H. IDH1 and IDH2 mutations in gliomas. Curr Neurol Neurosci Rep. 2013;13(5):345. doi: 10.1007/s11910-013-0345-4. [DOI] [PMC free article] [PubMed] [Google Scholar]
- 14.Coons SW, Johnson PC, Scheithauer BW, Yates AJ, Pearl DK. Improving diagnostic accuracy and interobserver concordance in the classification and grading of primary gliomas. Cancer. 1997;79:1381–1393. doi: 10.1002/(SICI)1097-0142(19970401)79:7<1381::AID-CNCR16>3.0.CO;2-W. [DOI] [PubMed] [Google Scholar]
- 15.Dai S, Wang X, Li X, Cao Y. MicroRNA-139-5p acts as a tumor suppressor by targeting ELTD1 and regulating cell cycle in glioblastoma multiforme. Biochem Biophys Res Commun. 2015;467(2):204–210. doi: 10.1016/j.bbrc.2015.10.006. [DOI] [PubMed] [Google Scholar]
- 16.Davoli T, Xu AW, Mengwasser KE, Sack LM, Yoon JC, Park PJ, Elledge SJ. Cumulative haploinsufficiency and triplosensitivity drive aneuploidy patterns and shape the cancer genome. Cell. 2013;155(4):948–962. doi: 10.1016/j.cell.2013.10.011. [DOI] [PMC free article] [PubMed] [Google Scholar]
- 17.De Marchi T, Timmermans AM, Smid M, Look MP, Stingl C, Opdam M. Annexin-A1 and caldesmon are associated with resistance to tamoxifen in estrogen receptor positive recurrent breast cancer. Oncotarget. 2016;7(3):3098–110. doi: 10.18632/oncotarget.6521. [DOI] [PMC free article] [PubMed] [Google Scholar]
- 18.Drucker KL, Gianinni C, Decker PA, Diamandis EP, Scarisbrick IA. Prognostic significance of multiple kallikreins in high-grade astrocytoma. BMC Cancer. 2015;15:565. doi: 10.1186/s12885-015-1566-5. [DOI] [PMC free article] [PubMed] [Google Scholar]
- 19.Drucker K, Paulsen AR, Giannini C, Decker PA, Blaber SI, Blaber M, et al. Clinical significance and novel mechanism of action of kallikrein 6 in glioblastoma. Neuro Oncol. 2013;15(3):305–318. doi: 10.1093/neuonc/nos313. [DOI] [PMC free article] [PubMed] [Google Scholar]
- 20.Eisenreich S, Abou-El-Ardat K, Szafranski K, Campos Valenzuela JA, Rump A, Nigro JM, et al (2013) Novel CIC point mutations and an exon-spanning, homozygous deletion identified in oligodendroglial tumors by a comprehensive genomic approach including transcriptome sequencing. PLoS ONE 8(9):e76623. 10.1371/journal.pone.0076623. [DOI] [PMC free article] [PubMed]
- 21.Fan YC, Cui CC, Zhu YS, Zhang L, Shi M, Yu JS. Overexpression of CAP1 and its significance in tumor cell proliferation, migration and invasion in glioma. Oncol Rep. 2016;36(3):1619–1625. doi: 10.3892/or.2016.4936. [DOI] [PubMed] [Google Scholar]
- 22.Giachino C, Boulay JL, Ivanek R, Alvarado A, Tostado C, Lugert S. A tumor suppressor function for notch signaling in forebrain tumor subtypes. Cancer Cell. 2015;28(6):730–742. doi: 10.1016/j.ccell.2015.10.008. [DOI] [PubMed] [Google Scholar]
- 23.Hawkes WC, Alkan Z. Delayed cell cycle progression from SEPW1 depletion is p53- and p21-dependent in MCF-7 breast cancer cells. Biochem Biophys Res Commun. 2011;413(1):36–40. doi: 10.1016/j.bbrc.2011.08.032. [DOI] [PubMed] [Google Scholar]
- 24.Hofree M, Shen JP, Carter H, Gross A, Ideker T. Network-based stratification of tumor mutations. Nat Methods. 2013;10(11):1108–1115. doi: 10.1038/nmeth.2651. [DOI] [PMC free article] [PubMed] [Google Scholar]
- 25.Ikegaki N, Gotoh T, Kung B, Riceberg JS, Kim DY, Zhao H, et al. De novo identification of MIZ-1 (ZBTB17) encoding a MYC-interacting zinc-finger protein as a new favorable neuroblastoma gene. Clin Cancer Res. 2007;13(20):6001–6009. doi: 10.1158/1078-0432.CCR-07-0071. [DOI] [PubMed] [Google Scholar]
- 26.Iwai A, Hijikata M, Hishiki T, Isono O, Chiba T, Shimotohno K. Coiled-coil domain containing 85B suppresses the beta-catenin activity in a p53-dependent manner. Oncogene. 2008;27(11):1520–1526. doi: 10.1038/sj.onc.1210801. [DOI] [PubMed] [Google Scholar]
- 27.Jacob A, Linklater E, Bayless BA, Lyons T, Prekeris R. The role and regulation of Rab40b-Tks5 complex during invadopodia formation and cancer cell invasion. J Cell Sci. 2016;129(23):4341–4353. doi: 10.1242/jcs.193904. [DOI] [PMC free article] [PubMed] [Google Scholar]
- 28.Jansen M, Yip S, Louis DN. Molecular pathology in adult gliomas: diagnostic, prognostic, and predictive markers. Lancet Neurol. 2010;9(7):717–726. doi: 10.1016/S1474-4422(10)70105-8. [DOI] [PMC free article] [PubMed] [Google Scholar]
- 29.Jenkins RB, Blair H, Ballman KV, Giannini C, Arusell RM, Law M. A t(1;19)(q10;p10) mediates the combined deletions of 1p and 19q and predicts a better prognosis of patients with oligodendroglioma. Cancer Res. 2006;66(20):9852–61. doi: 10.1158/0008-5472.CAN-06-1796. [DOI] [PubMed] [Google Scholar]
- 30.Ji W, Chen J, Mi Y, Wang G, Xu X, Wang W. Platelet-activating factor receptor activation promotes prostate cancer cell growth, invasion and metastasis via ERK1/2 pathway. Int J Oncol. 2016;49(1):181–188. doi: 10.3892/ijo.2016.3519. [DOI] [PubMed] [Google Scholar]
- 31.Jin S, Dai Y, Li C, Fang X, Han H, Wang D. MicroRNA-544 inhibits glioma proliferation, invasion and migration but induces cell apoptosis by targeting PARK7. Am J Transl Res. 2016;8(4):1826–37. [PMC free article] [PubMed] [Google Scholar]
- 32.Jiang K, Liu M, Lin G, Mao B, Cheng W, Liu H, et al. Tumor suppressor Spred2 interaction with LC3 promotes autophagosome maturation and induces autophagy-dependent cell death. Oncotarget. 2016;7(18):25652–25667. doi: 10.18632/oncotarget.8357. [DOI] [PMC free article] [PubMed] [Google Scholar]
- 33.Kamoun A, Idbaih A, Dehais C, Elarouci N, Carpentier C, Letouzé E, et al (2016) Integrated multi-omics analysis of oligodendroglial tumours identifies three subgroups of 1p/19q co-deleted gliomas. Nat Commun 7:11263. 10.1038/ncomms11263. [DOI] [PMC free article] [PubMed]
- 34.Kinoshita M, Nakamura T, Ihara M, Haraguchi T, Hiraoka Y, Tashiro K, et al. Identification of human endomucin-1 and -2 as membrane-bound O-sialoglycoproteins with anti-adhesive activity. FEBS Lett. 2001;499(1-2):121–126. doi: 10.1016/S0014-5793(01)02520-0. [DOI] [PubMed] [Google Scholar]
- 35.Klink B, Schlingelhof B, Klink M, Stout-Weider K, Patt S, Schrock E. Glioblastomas with oligodendroglial component - common origin of the different histological parts and genetic subclassification. Anal Cell Pathol (Amst) 2010;33(1):37–54. doi: 10.1155/2010/279317. [DOI] [PMC free article] [PubMed] [Google Scholar]
- 36.Knudson AG. Two genetic hits (more or less) to cancer. Nat Rev Cancer. 2001;1(2):157–62. doi: 10.1038/35101031. [DOI] [PubMed] [Google Scholar]
- 37.Labussiere M, Idbaih A, Wang X-W, Marie Y, Boisselier B, Falet C, et al. All the 1p19q codeleted gliomas are mutated on IDH1 or IDH2. Neurology. 2010;74(23):1886–1890. doi: 10.1212/WNL.0b013e3181e1cf3a. [DOI] [PubMed] [Google Scholar]
- 38.Lauber C, Klink B, Seifert M (2018) Comparative analysis of histologically classified oligodendrogliomas reveals characteristic molecular differences between subgroups. BMC Cancer 18:399. 10.1186/s12885-018-4251-7. [DOI] [PMC free article] [PubMed]
- 39.Leiserson MDM, Vandin F, Wu H-T, Dobson JR, Eldridge JV, Thomas JL, et al. Pan-cancer network analysis identifies combinations of rare somatic mutations across pathways and protein complexes. Nat Genet. 2015;47(2):106–114. doi: 10.1038/ng.3168. [DOI] [PMC free article] [PubMed] [Google Scholar]
- 40.Letouzé E, Martinelli C, Loriot C, Burnichon N, Abermil N, Ottolenghi C. SDH mutations establish a hypermethylator phenotype in paraganglioma. Cancer Cell. 2013;23(6):739–52. doi: 10.1016/j.ccr.2013.04.018. [DOI] [PubMed] [Google Scholar]
- 41.Li J, Gu D, Lee SS, Song B, Bandyopadhyay S, Chen S, et al. Abrogating cholesterol esterification suppresses growth and metastasis of pancreatic cancer. Oncogene. 2016;35(50):6378–6388. doi: 10.1038/onc.2016.168. [DOI] [PMC free article] [PubMed] [Google Scholar]
- 42.Li X, Liu S. Suppression of HBXIP reduces cell proliferation, migration and invasion in vitro, and tumorigenesis in vivo in human urothelial carcinoma of the bladder. Cancer Biother Radiopharm. 2016;31(9):311–316. doi: 10.1089/cbr.2016.2038. [DOI] [PubMed] [Google Scholar]
- 43.Liang H, Ding X, Zhou C, Zhang Y, Xu M, Zhang C, et al. Knockdown of eukaryotic translation initiation factors 3B (EIF3B) inhibits proliferation and promotes apoptosis in glioblastoma cells. Neurol Sci. 2012;33(5):1057–62. doi: 10.1007/s10072-011-0894-8. [DOI] [PubMed] [Google Scholar]
- 44.Lin B, Lee H, Yoon J-G, Madan A, Wayner E, Tonning S, et al. Global analysis of H3K4me3 and H3K27me3 profiles in glioblastoma stem cells and identification of SLC17A7 as a bivalent tumor suppressor gene. Oncotarget. 2015;6(7):5369–5381. doi: 10.18632/oncotarget.3030. [DOI] [PMC free article] [PubMed] [Google Scholar]
- 45.Liu S, Li L, Zhang Y, Zhang Y, Zhao Y, You X. The oncoprotein HBXIP uses two pathways to up-regulate S100A4 in promotion of growth and migration of breast cancer cells. J Biol Chem. 2012;287:30228–39. doi: 10.1074/jbc.M112.343947. [DOI] [PMC free article] [PubMed] [Google Scholar]
- 46.Lockhart R, Taylor J, Tibshirani RJ, Tibshirani R. A significance test for the lasso. Ann Stat. 2014;42(2):413–468. doi: 10.1214/13-AOS1175. [DOI] [PMC free article] [PubMed] [Google Scholar]
- 47.Louis DN, Ohgaki H, Wiestler OD, Cavenee WK, Burger PC, Jouvet A, et al. The 2007 WHO classification of tumours of the central nervous system. Acta Neuropathol. 2007;114(2):97–109. doi: 10.1007/s00401-007-0243-4. [DOI] [PMC free article] [PubMed] [Google Scholar]
- 48.Louis DN, Perry A, Reifenberger G, von Deimling A, Figarella-Branger D, Cavenee WK, et al. The 2016 World health organization classification of tumors of the central nervous system: a summary. Acta Neuropathol. 2016;131(6):803–820. doi: 10.1007/s00401-016-1545-1. [DOI] [PubMed] [Google Scholar]
- 49.Marusawa H, Matsuzawa S, Welsh K, Zou H, Armstrong R, Tamm I, et al. HBXIP functions as a cofactor of survivin in apoptosis suppression. EMBO J. 2003;22:2729–40. doi: 10.1093/emboj/cdg263. [DOI] [PMC free article] [PubMed] [Google Scholar]
- 50.Masiero M, Simoes FC, Han HD, Snell C, Peterkin T, Bridges E, et al. A core human primary tumor angiogenesis signature identifies the endothelial orphan receptor ELTD1 as a key regulator of angiogenesis. Cancer Cell. 2013;24(2):229–241. doi: 10.1016/j.ccr.2013.06.004. [DOI] [PMC free article] [PubMed] [Google Scholar]
- 51.Mazars R, Gonzales-de-Peredo A, Cayrol C, Lavigne AC, Vogel JL, Ortega N. The THAP-zinc finger protein THAP1 associates with coactivator HCF-1 and O-GlcNAc transferase: a link between DYT6 and DYT3 dystonias. J Biol Chem. 2010;285(18):13364–71. doi: 10.1074/jbc.M109.072579. [DOI] [PMC free article] [PubMed] [Google Scholar]
- 52.Millán-Uclés A, Diaz-Castro B, Garcia-Flores P, Báez A, Pérez-Simón JA, López-Barneo J, et al. A conditional mouse mutant in the tumor suppressor SdhD gene unveils a link between p21(WAF1/Cip1) induction and mitochondrial dysfunction. PLoS ONE. 2014;9(1):85528. doi: 10.1371/journal.pone.0085528. [DOI] [PMC free article] [PubMed] [Google Scholar]
- 53.Noushmehr H, Weisenberger DJ, Diefes K, Phillips HS, Pujara K, Berman BP, et al. Identification of a CpG island methylator phenotype that defines a distinct subgroup of glioma. Cancer Cell. 2010;17(5):510–522. doi: 10.1016/j.ccr.2010.03.017. [DOI] [PMC free article] [PubMed] [Google Scholar]
- 54.Ohgaki H, Kleihues P. The definition of primary and secondary glioblastoma. Clin Cancer Res. 2013;19(4):764–772. doi: 10.1158/1078-0432.CCR-12-3002. [DOI] [PubMed] [Google Scholar]
- 55.Ohmoto T, Nishitsuji K, Yoshitani N, Mizuguchi M, Yanagisawa Y, Saito H, et al. K604, a specific acyl-CoA:cholesterol acyltransferase 1 inhibitor, suppresses proliferation of U251-MG glioblastoma cells. Mol Med Rep. 2015;12(4):6037–42. doi: 10.3892/mmr.2015.4200. [DOI] [PubMed] [Google Scholar]
- 56.Park HC, Appel B. Delta-Notch signaling regulates oligodendrocyte specification. Development. 2003;130(16):3747–3755. doi: 10.1242/dev.00576. [DOI] [PubMed] [Google Scholar]
- 57.Peng Y, Dong W, Lin TX, Zhong GZ, Liao B, Wang B. MicroRNA-155 promotes bladder cancer growth by repressing the tumor suppressor DMTF1. Oncotarget. 2015;6(18):16043–58. doi: 10.18632/oncotarget.3755. [DOI] [PMC free article] [PubMed] [Google Scholar]
- 58.Pickard MR, Green AR, Ellis IO, Caldas C, Hedge VL, Mourtada-Maarabouni M. Dysregulated expression of Fau and MELK is associated with poor prognosis in breast cancer. Breast Cancer Res. 2009;11(4):60. doi: 10.1186/bcr2350. [DOI] [PMC free article] [PubMed] [Google Scholar]
- 59.Quarles RH. Myelin-associated glycoprotein (MAG): past, present and beyond. J Neurochem. 2007;100(6):1431–1448. doi: 10.1111/j.1471-4159.2006.04319.x. [DOI] [PubMed] [Google Scholar]
- 60.Reifenberger J, Reifenberger G, Liu L, James CD, Wechsler W, Collins VP. Molecular genetic analysis of oligodendroglial tumors shows preferential allelic deletions on 19q and 1p. Am J Pathol. 1994;145(5):1175–90. [PMC free article] [PubMed] [Google Scholar]
- 61.Ritchie ME, Phipson B, Wu D, Hu Y, Law CW, Shi W, et al (2015) limma powers differential expression analyses for RNA-sequencing and microarray studies. Nucleic Acids Res 43(7):e47. http://doi.org/10.1093/nar/gkv007. [DOI] [PMC free article] [PubMed]
- 62.Safran M, Dalah I, Alexander J, Rosen N, Stein TI, Shmoish M, et al (2010) GeneCards version 3: the human gene integrator. Database 2010:baq020. http://doi.org/10.1093/database/baq020. [DOI] [PMC free article] [PubMed]
- 63.Santarosa M, Ashworth A. Haploinsufficiency for tumour suppressor genes: when you don’t need to go all the way. Biochim Biophys Acta. 2004;1654(2):105–22. doi: 10.1016/j.bbcan.2004.01.001. [DOI] [PubMed] [Google Scholar]
- 64.Seifert M, Beyer A. regNet: An R package for network-based propagation of gene expression alterations. Bioinformatics. 2018;34(2):308–311. doi: 10.1093/bioinformatics/btx544. [DOI] [PubMed] [Google Scholar]
- 65.Seifert M, Friedrich B, Beyer A (2016) Importance of rare gene copy number alterations for personalized tumor characterization and survival analysis. Genome Biol 17:204. 10.1186/s13059-016-1058-1. [DOI] [PMC free article] [PubMed]
- 66.Sells E, Pandey R, Chen H, Skovan BA, Cui H, Ignatenko NA. Specific microRNA–mRNA regulatory network of colon cancer invasion mediated by tissue kallikrein–related peptidase 6. J R Stat Soc Ser B. 2017;19(5):396–411. doi: 10.1016/j.neo.2017.02.003. [DOI] [PMC free article] [PubMed] [Google Scholar]
- 67.Smith JS, Tachibana I, Pohl U, Lee HK, Thanarajasingam U, Portier BP, et al. A transcript map of the chromosome 19q-arm glioma tumor suppressor region. Genomics. 2000;64(1):44–50. doi: 10.1006/geno.1999.6101. [DOI] [PubMed] [Google Scholar]
- 68.Storey JD. A direct approach to false discovery rates. J R Statist Soc B. 2002;64(3):479–498. doi: 10.1111/1467-9868.00346. [DOI] [Google Scholar]
- 69.(2015) The Cancer Genome Atlas Research Network: Comprehensive, integrative genomic analysis of diffuse lower-grade gliomas. N Engl J Med 372(26):2481–2498. 10.1056/NEJMoa1402121. [DOI] [PMC free article] [PubMed]
- 70.Tibshirani R. Regression shrinkage and selection via the lasso. J R Stat Soc Ser B. 1994;58:267–288. [Google Scholar]
- 71.Tirosh I, Venteicher AS, Hebert C, Escalante LE, Patel AP, Yizhak K, et al. Single-cell RNA-seq supports a developmental hierarchy in human oligodendroglioma. Nature. 2016;539(539):309–313. doi: 10.1038/nature20123. [DOI] [PMC free article] [PubMed] [Google Scholar]
- 72.Towner RA, Jensen RL, Colman H, Vaillant B, Smith N, Casteel R, et al. ELTD1, a potential new biomarker for gliomas. Neurosurgery. 2013;72(1):77–91. doi: 10.1227/NEU.0b013e318276b29d. [DOI] [PMC free article] [PubMed] [Google Scholar]
- 73.Trivedi R, Dihazi GH, Eltoweissy M, Mishra DP, Mueller GA, Dihazi H. The antioxidant protein PARK7 plays an important role in cell resistance to cisplatin-induced apoptosis in case of clear cell renal cell carcinoma. Eur J Pharmacol. 2016;784:99–110. doi: 10.1016/j.ejphar.2016.04.014. [DOI] [PubMed] [Google Scholar]
- 74.Trost D, Ehrle rM, Fimmers R, Felsberg J, Sabel MC, Kirsch L, et al. Identification of genomic aberrations associated with shorter overall survival in patients with oligodendroglial tumors. Int J Cancer. 2007;120(11):2368–76. doi: 10.1002/ijc.22574. [DOI] [PubMed] [Google Scholar]
- 75.Turcan S, Rohle D, Goenka A, Walsh LA, Fang F, Yilmaz E, et al. IDH1 mutation is sufficient to establish the glioma hypermethylator phenotype. Nature. 2012;483(7390):479–483. doi: 10.1038/nature10866. [DOI] [PMC free article] [PubMed] [Google Scholar]
- 76.van den Bent MJ. Interobserver variation of the histopathological diagnosis in clinical trials on glioma: a clinician’s perspective. Acta Neuropathol. 2010;120(3):297–304. doi: 10.1007/s00401-010-0725-7. [DOI] [PMC free article] [PubMed] [Google Scholar]
- 77.Vasseur S, Afzal S, Tardivel-Lacombe J, Park DS, Iovanna JL, Mak TW. DJ-1/PARK7 is an important mediator of hypoxia-induced cellular responses. Proc Natl Acad Sci. 2009;106:1111–6. doi: 10.1073/pnas.0812745106. [DOI] [PMC free article] [PubMed] [Google Scholar]
- 78.Venteicher AS, Tirosh I, Hebert C, Yizhak K, Neftel C, Filbin MG, et al. Decoupling genetics, lineages, and microenvironment in IDH-mutant gliomas by single-cell RNA-seq. Science. 2017;355(6332):8478. doi: 10.1126/science.aai8478. [DOI] [PMC free article] [PubMed] [Google Scholar]
- 79.Warnes GR, Bolker B, Bonebakker L, Gentleman R, Huber W, Liaw A, et al (2016) gplots: Various R programming tools for plotting data. R package gplots version 3.0.1.
- 80.Wesseling P, van den Bent M, Perry A. Oligodendroglioma: pathology, molecular mechanisms and markers. Acta Neuropathol. 2015;129(6):809–27. doi: 10.1007/s00401-015-1424-1. [DOI] [PMC free article] [PubMed] [Google Scholar]
- 81.Wu-Baer F, Ludwig T, Baer R. The UBXN1 protein associates with autoubiquitinated forms of the BRCA1 tumor suppressor and inhibits its enzymatic function. Mol Cell Biol. 2010;30(11):2787–2798. doi: 10.1128/MCB.01056-09. [DOI] [PMC free article] [PubMed] [Google Scholar]
- 82.Zhang H, Ghai P, Wu H, Wang C, Field J, Zhou G-L. Mammalian adenylyl cyclase-associated protein 1 (CAP1) regulates cofilin function, the actin cytoskeleton, and cell adhesion. J Biol Chem. 2013;288(29):20966–20977. doi: 10.1074/jbc.M113.484535. [DOI] [PMC free article] [PubMed] [Google Scholar]
- 83.Zhang TT, Jiang YY, Shang L, Shi ZZ, Liang JW, Wang Z. Overexpression of DNAJB6 promotes colorectal cancer cell invasion through an IQGAP1/ERK-dependent signaling pathway. Mol Carcinog. 2015;54:1205–13. doi: 10.1002/mc.22194. [DOI] [PubMed] [Google Scholar]
- 84.Zhao N, Zhang G, He M, Huang H, Cao L, Yin A. SZRD1 is a novel protein that functions as a potential tumor suppressor in cervical cancer. J Cancer. 2017;8(11):2132–2141. doi: 10.7150/jca.18806. [DOI] [PMC free article] [PubMed] [Google Scholar]
- 85.Zheng PP, Sieuwerts AM, Luider TM, van der Weiden M, Sillevis-Smitt PA, Kros JM. Differential expression of splicing variants of the human caldesmon gene (CALD1) in glioma neovascularization versus normal brain microvasculature. Am J Pathol. 2004;164(6):2217–28. doi: 10.1016/S0002-9440(10)63778-9. [DOI] [PMC free article] [PubMed] [Google Scholar]
- 86.Ziegler J, Pody R, Coutinho de Souza P, Evans B, Saunders D, Smith N, et al. ELTD1, an effective anti-angiogenic target for gliomas: preclinical assessment in mouse GL261 and human G55 xenograft glioma models. Neuro-Oncology. 2017;19(2):175–185. doi: 10.1093/neuonc/now147. [DOI] [PMC free article] [PubMed] [Google Scholar]
Associated Data
This section collects any data citations, data availability statements, or supplementary materials included in this article.
Supplementary Materials
Table S1. Gene copy number data. (XLS 68300 kb)
Table S2. Gene expression data. (XLS 48300 kb)
Texts S1–S4 and Figures S1–S7. (PDF 1800 kb)
Table S3. Differentially expressed genes between oligodendrogliomas with 1p/19q co-deletion and normal brain tissue. (XLS 2240 kb)
Table S4. Genes located on 1p/19q with strong impact on signaling pathways. (XLS 115 kb)
Table S5. Genes located on 1p/19q with strong impact on metabolic pathways. (XLS 115 kb)
Table S6. Genes located on rarely mutated chromosomal arms with strong impact on signaling pathways. (XLS 187 kb)
Table S7. Genes located on rarely mutated chromosomal arms with strong impact on metabolic pathways. (XLS 187 kb)
Data Availability Statement
Data of all considered TCGA tumors are publicly available from the The Genomic Data Commons Data Portal (https://portal.gdc.cancer.gov/). Processed gene expression and copy number data are contained in the Additional files 1 and 2. Utilized algorithms for network inference and network propagation are publicly available from GitHub (https://github.com/seifemi/regNet).