

ABSTRACT
Listeria monocytogenes is a food pathogen capable of growing at a broad temperature range from 50°C to refrigerator temperatures. A key requirement for bacterial activity and growth at low temperatures is the ability to adjust the membrane lipid composition to maintain cytoplasmic membrane fluidity. In this study, we confirmed earlier findings that the extents of fatty acid profile adaptation differed between L. monocytogenes strains. We were able to demonstrate for isolates from food that growth rates at low temperatures and resistance to freeze-thaw stress were not impaired by a lower adaptive response of the fatty acid composition. This indicated the presence of a second adaptation mechanism besides temperature-regulated fatty acid synthesis. For strains that showed weaker adaptive responses in their fatty acid profiles to low growth temperature, we could demonstrate a significantly higher concentration of isoprenoid quinones. Three strains even showed a higher quinone concentration after growth at 6°C than at 37°C, which is contradictory to the reduced respiratory activity at lower growth temperatures. Analyses of the membrane fluidity in vivo by measuring generalized polarization and anisotropy revealed modulation of the transition phase. Strains with increased quinone concentrations showed an expanded membrane transition phase in contrast to strains with pronounced adaptations of fatty acid profiles. The correlation between quinone concentration and membrane transition phase expansion was confirmed by suppression of quinone synthesis. A reduced quinone concentration resulted in a narrower transition phase. Expansion of the phase transition zone by increasing the concentration of non-fatty acid membrane lipids is discussed as an additional mechanism improving adaptation to temperature shifts for L. monocytogenes strains.
IMPORTANCE Listeria monocytogenes is a foodborne pathogen with an outstanding temperature range for growth. The ability for growth at temperatures close to the freezing point constitutes a serious contamination potential for cold stored food. The only known mechanism of the species for adaptation of membrane fluidity is modification of the membrane fatty acid composition. We were able to demonstrate that, at least for some strains, this adaptation mechanism is supported by regulation of the menaquinone concentration. The increase of this neutral membrane lipid is correlated with fluidization of the membrane under low-temperature conditions and therefore represents a fatty acid-independent mechanism for adaptation to low temperatures.
KEYWORDS: Listeria monocytogenes, TMA-DPH, anisotropy, fatty acids, low temperature, membrane fluidity, menaquinone
INTRODUCTION
Listeria monocytogenes is a Gram-positive facultative intracellular foodborne pathogen that occurs ubiquitously in the environment and causes human listeriosis (1). The severity of the disease is demonstrated by its high mortality, which can range between 14 and 30% (2). L. monocytogenes is characterized by its high adaptive capability in response to various environmental factors, such as temperature and osmotic stress (3). The growth of L. monocytogenes can occur in a remarkably broad temperature range, from −2°C to 50°C (1, 4). This allows the persistence of the bacterium in food-processing facilities, leading to subsequent secondary contamination of refrigerated food, which is the main transmission path of human listeriosis.
A key function to ensure growth at low temperature is the maintenance of membrane lipid homeostasis (5). Bacteria modulate membrane lipid fluidity by modifying their fatty acid composition. This maintains a physiologically optimal liquid (liquid-crystalline) membrane state in response to changing external conditions (6, 7). A decrease of membrane fluidity and the accompanying phase transition to a solid, gel-like state leads to impaired growth performance (8–10) by interfering with membrane-associated processes, such as electron transport in the respiration chain, membrane permeability, and substrate transport (5). In order to prevent the liquid-to-gel transition at low temperatures, lipids with lower melting temperatures (Tm) are incorporated into the membrane. The fluidity of biomembranes is mainly determined by the lipid acyl chains of the polar lipids (11).
The fatty acid profile modification of Listeria, as part of the adaptation at low temperatures, has been described in detail (8, 12–14). The cytoplasmic membrane of L. monocytogenes is characterized by a high proportion of the branched fatty acids 15:0 anteiso and 17:0 anteiso. These lipids account for at least 85% of all fatty acids (8, 12). In the case of temperature decrease, the 17:0 anteiso proportion decreases in favor of 15:0 anteiso fatty acids, which then account for >80% of the total fatty acids. By this change, the membrane fluidity is maintained at low temperatures due to the lower melting point of 15:0 anteiso (15). Several strains of L. monocytogenes that showed a less pronounced adaptation response of the fatty acid profiles were described previously (16). The dominance of anteiso-fatty acids is not a unique feature of the genus Listeria. There are several other bacterial genera that show fatty acid profiles dominated by 15:0 anteiso but that are not known to be psychrotolerant. This is the case for the genera Microbacterium (17), Virgibacillus (18), and Legionella (19), to mention just a few genera from different bacterial phyla. This indicates the presence of other adaptation mechanisms besides the substitution of fatty acid 15:0 anteiso for 17:0 anteiso. Mastronicolis et al. (13) detected for one L. monocytogenes strain a 30% (wt/wt) increase of neutral lipids after growth at low temperature and demonstrated the impact of these lipids on the phase transition temperature of the total lipid fraction. However, the compounds of the neutral lipid fraction were not identified in detail in the study. One of the neutral lipids of L. monocytogenes is menaquinone-7 (20). This lipid is a compound of the electron transport chain and an integral component of the cytoplasmic membrane. Although there is no information available about the influence of menaquinones on the phase transition temperature in bacterial membranes, there are some indications of fluidizing effects in artificial membranes. Ortiz et al. (21, 22) demonstrated that vitamin K1 decreased the phase transition temperature of artificial membranes, which was later confirmed by Asai (23). These data suggest that L. monocytogenes menaquinone-7 may also be involved in cold adaptation of the species.
For eukaryotic cell membranes, the sterols cholesterol and ergosterol increase membrane order with concurrent maintenance of lateral lipid mobility, which results in a liquid-ordered state of the membrane (24). Similar effects are known for the bacterial sterol-like hopanoids, which act as functional analogues of sterols in bacteria (25, 26). In this work, we tested the hypothesis that menaquinone also acts as a cholesterol-like analogue in L. monocytogenes. The methods used in this study, analysis of general polarization and anisotropy, allow the detection of changes in membrane order and lipid mobility, respectively. In accord with our hypothesis, we tested whether the menaquinone content increased, and possibly enhanced fluidity, at low temperatures. In earlier publications, functions of isoprenoid quinones other than electron transport in the respiratory chain were already presumed (27, 28). In this study, several isolates and reference strains were analyzed to consider strain-specific differences. Temperature-dependent changes in fatty acid composition and menaquinone content were analyzed, and the impacts of these changes on membrane fluidity and membrane order were measured.
RESULTS
Serovar assignment and resistance to temperature stress.
The tested L. monocytogenes strains were classified into two different serovar groups based on multiplex PCR. Strains DSM 20600T, FFL 1, FFL 11, Iso 11/13, 1B, and 3B were classified as group 1/2a or 3a isolates. The isolates ATCC 19115, FFH, FF 127, and FF 141 were assigned to serovar group 4b, 4d, or 4e. According to Doumith et al. (29), the dominating (and prevalent in food) serovars of these two groups are 1/2a and 4b, which correspond to the serovars of the two reference strains, as indicated by the two culture collections. The freeze-thaw cycles showed different impacts on the various L. monocytogenes strains (Fig. 1). All the food isolates showed no or minimal (up to log 0.4) reduction in viable-cell counts after three freeze-thaw cycles. On the other hand, both reference strains, DSM 20600T and ATCC 19115, showed greater reduction of viable-cell counts (log 1) even after the first freeze-thaw cycle. After two further cycles, viable-cell counts were reduced gradually up to 3 log units (Fig. 1).
FIG 1.

Logarithmic reduction of viable-cell counts of various L. monocytogenes strains after 1 (white), 2 (light gray), and 3 (dark gray) freeze-thaw cycles (24 h each). Means and standard deviations are shown.
Fatty acid profiles.
The fatty acid composition of each strain was analyzed for late-exponential-phase cells after growth at 37°C and 6°C. The dominating fatty acids of all the isolates and reference strains were 15:0 iso, 15:0 anteiso, and 17:0 anteiso (Table 1). The melting points of these fatty acids are 51.4, 24.1, and 37.1°C (15). The three branched-chain fatty acids represented at least 90% of the total fatty acids at both growth temperatures. The temperature-dependent modification of the fatty acid profiles revealed two distinct groups of isolates. Most isolates (FFL 1, FFL 11, 1B, 3B, and Iso 11/13) showed a pronounced change in fatty acid composition, resulting in a difference in the weighted-average melting temperature (ΔWAMT) of >6°C. These isolates were designated group A. The strains DSM 20600T, ATCC 19115, and FFH showed a lower ΔWAMT of <4°C. This was attributed to a less pronounced fatty acid adaptation for the latter strains. These isolates were designated group B strains in this study. For all the strains, the temperature adaptation was based on regulation of the acyl chain length of the fatty acids, predominantly the change of the 15:0 anteiso/17:0 anteiso ratio. For group B isolates, this change was clearly less pronounced (Table 1). Isolates FF 127 and FF 141 showed an intermediate fatty acid adaptation, with a ΔWAMT of about 5°C.
TABLE 1.
Fatty acid compositions, WAMT, and menaquinone concentrations of L. monocytogenes strains in relation to growth temperature
| Parameter | Value for straina: |
|||||||||||||||||||
|---|---|---|---|---|---|---|---|---|---|---|---|---|---|---|---|---|---|---|---|---|
| Iso 11/13 |
1B |
3B |
FFL 11 |
FFL 1 |
FF 127 |
FF 141 |
FFH |
ATCC 19115 |
DSM 20600T |
|||||||||||
| 6°C | 37°C | 6°C | 37°C | 6°C | 37°C | 6°C | 37°C | 6°C | 37°C | 6°C | 37°C | 6°C | 37°C | 6°C | 37°C | 6°C | 37°C | 6°C | 37°C | |
| Fatty acid composition (%) | ||||||||||||||||||||
| 14:0 iso | 0.7 ± 0.1 | 0.4 ± 0.1 | 0.9 ± 0.3 | 0.2 ± 0.0 | 0.7 ± 0.1 | ND | 0.7 ± 0.3 | 0.8 ± 0.1 | 0.7 ± 0.1 | 0.3 ± 0.1 | 0.6 ± 0.0 | 0.2 ± 0.0 | 0.6 ± 0.2 | 0.2 ± 0.0 | 0.9 ± 0.1 | ND | 0.7 ± 0.1 | ND | 2.1 ± 0.6 | ND |
| 14:0 | 0.4 ± 0.1 | 0.3 ± 0.1 | 0.3 ± 0.1 | 0.1 ± 0.0 | 0.2 ± 0.0 | ND | 0.1 ± 0.1 | ND | 0.2 ± 0.0 | ND | 1.4 ± 0.0 | ND | 1.3 ± 0.3 | ND | 0.1 ± 0.1 | ND | 1.3 ± 0.2 | ND | 1.0 ± 0.4 | ND |
| 15:0 iso | 4.7 ± 0.8 | 7.1 ± 1.3 | 4.6 ± 0.8 | 6.5 ± 0.2 | 3.9 ± 0.2 | 5.7 ± 0.7 | 3.4 ± 1.1 | 6.2 ± 1.9 | 4.3 ± 0.3 | 5.9 ± 0.5 | 6.3 ± 0.1 | 7.7 ± 0.3 | 7.3 ± 1.1 | 7.7 ± 0.6 | 11.4 ± 2.0 | 6.5 ± 0.5 | 7.6 ± 0.4 | 5.0 ± 0.8 | 10.5 ± 1.1 | 2.2 ± 0.2 |
| 15:0 anteiso | 90.1 ± 2.9 | 40.9 ± 1.2 | 92.9 ± 1.7 | 46.9 ± 1.9 | 94.5 ± 0.4 | 49.1 ± 2.2 | 93.7 ± 2.8 | 49.8 ± 6.8 | 92.1 ± 0.5 | 49.4 ± 1.5 | 84.3 ± 0.2 | 50.1 ± 0.6 | 85.3 ± 1.1 | 52.0 ± 3.1 | 83.9 ± 0.6 | 59.4 ± 10.1 | 78.6 ± 5.4 | 58.3 ± 7.1 | 79.2 ± 0.3 | 70.8 ± 7.3 |
| 16:0 iso | 0.4 ± 0.2 | 3.4 ± 0.8 | 0.2 ± 0.0 | 3.0 ± 0.3 | 0.2 ± 0.0 | 2.7 ± 0.6 | 0.3 ± 0.0 | 3.4 ± 1.4 | 0.3 ± 0.0 | 3.1 ± 0.2 | 0.4 ± 0.0 | 2.9 ± 0.2 | 0.1 ± 0.0 | 2.7 ± 0.7 | 0.3 ± 0.1 | 1.8 ± 0.6 | 0.5 ± 0.2 | 0.6 ± 0.2 | 0.9 ± 0.1 | 0.8 ± 0.0 |
| 16:0 | 0.2 ± 0.0 | 2.0 ± 0.6 | ND | 1.3 ± 0.1 | ND | 0.9 ± 0.3 | ND | 1.4 ± 0.8 | ND | 1.2 ± 0.06 | 0.4 ± 0.1 | 1.2 ± 0.2 | 0.2 ± 0.1 | 0.8 ± 0.2 | ND | 0.6 ± 0.1 | 0.7 ± 0.3 | 0.4 ± 0.1 | 0.2 ± 0.0 | 0.3 ± 0.0 |
| 17:0 iso | ND | 3.3 ± 0.5 | ND | 2.3 ± 0.4 | ND | 1.5 ± 0.6 | ND | 1.7 ± 1.2 | ND | 1.5 ± 0.1 | ND | 1.9 ± 0.1 | ND | 1.6 ± 0.5 | ND | 1.2 ± 0.4 | 0.2 ± 0.1 | 0.9 ± 0.2 | 0.1 ± 0.0 | ND |
| 17:0 anteiso | 3.5 ± 1.9 | 42.6 ± 3.0 | 1.0 ± 0.4 | 39.0 ± 1.0 | 0.7 ± 0.2 | 39.8 ± 1.3 | 1.9 ± 2.1 | 36.1 ± 1.3 | 2.5 ± 0.5 | 38.4 ± 1.7 | 6.8 ± 0.2 | 36.2 ± 0.8 | 5.6 ± 0.9 | 35.2 ± 1.1 | 2.9 ± 1.4 | 31.2 ± 8.5 | 10.0 ± 4.6 | 35.0 ± 7.2 | 5.6 ± 0.3 | 26.6 ± 6.5 |
| WAMT (°C) | 26.4 | 35.2 | 25.9 | 33.3 | 25.6 | 32.7 | 25.7 | 32.8 | 25.9 | 32.9 | 27.7 | 33.3 | 27.6 | 32.8 | 27.9 | 31.4 | 28.5 | 30.8 | 28.1 | 29.9 |
| ΔWAMT (K) | 8.8 | 7.4 | 7.1 | 7.1 | 7.0 | 5.6 | 5.2 | 3.5 | 2.3 | 1.8 | ||||||||||
| Menaquinone concn (nmol/g cell wet wt) | 71 ± 7 | 108 ± 6 | 72 ± 7 | 91 ± 10 | 71 ± 6 | 88 ± 9 | 80 ± 4 | 92 ± 9 | 80 ± 5 | 94 ± 9 | 129 ± 3 | 162 ± 11 | 130 ± 12 | 169 ± 17 | 168 ± 6 | 117 ± 6 | 148 ± 14 | 123 ± 7 | 203 ± 7 | 156 ± 13 |
Values at the indicated growth temperatures ± standard deviations. Temperature adaptations are presented as WAMT of the profiles. ND, not detected.
Isoprenoid quinone content.
For all L. monocytogenes strains tested, we detected quinone MK-7 exclusively. Other minor quinones, like MK-6 and MK-5, which had been described for L. monocytogenes (20), were not detected. The L. monocytogenes strains FFL 1, FFL 11, Iso 11/13, 1B, and 3B showed a menaquinone-7 content of approximately 100 nmol/gwet weight at 37°C growth temperature. Strains FF 127 and FF 141 showed a higher menaquinone-7 content of about 150 nmol/gwet weight at 37°C. After cultivation at 6°C, all of these strains showed decreases in the menaquinone-7 concentrations in the range of 15 to 30%. Even though the three strains DSM 20600T, ATCC 19115, and FFH showed similar menaquinone-7 levels of ∼150 nmol/gwet weight at 37°C, the response to low growth temperature was significantly different. These three strains showed a clear increase in the menaquinone-7 concentration at 6°C growth temperature. The menaquinone-7 content increased by 33% for strain DSM 20600T, by 20% for strain ATCC 19115, and by 60% for strain FFH. This deviating reaction of the strains corresponded to the differentiation in groups A and B based on the temperature-dependent fatty acid modifications. The isolates of group A showed a decrease in the menaquinone concentration with lower growth temperature, whereas strains of group B showed the opposite reaction. A correlation analysis demonstrated a significant (r = −0.99; P < 0.01) relation between the extent of fatty acid profile adaptation, expressed as ΔWAMT, and the menaquinone content under low-temperature growth conditions (Fig. 2).
FIG 2.

Correlation of menaquinone-7 content after growth at 6°C and differences in WAMT at both growth temperatures. The line represents a linear fit of the data. Pearson product-moment correlation; r = −0.99; P < 0.01. Means and standard deviations are shown.
Membrane fluidity.
Laurdan generalized-polarization (GP) values were measured for all the strains in order to determine membrane rigidity at low growth temperatures. The data shown in Fig. 3 indicate a clear difference between strains with high quinone content and strains with low quinone content. Strains FFL 1, FFL 11, 1B, 3B, and Iso 11/13 (Fig. 3, black lines) showed an almost linear relationship between GP values, ranging from 0.5 to 0.0, and temperature, ranging from 6°C to 60°C. Strains DSM 20600T, ATCC 19115, and FFH, with high quinone contents (red lines), showed distinctly lower slopes, especially at temperatures above 30°C, than all the other isolates. The GP values for these strains decreased on average from 0.52 to 0.3. This indicates a higher membrane order in the high-quinone-content strains DSM 20600T, ATCC 19115, and FFH in the temperature range of 30 to 60°C. For strains FF 127 and FF 141 (green lines), intermediate reactions were found. Accordingly, we could demonstrate a significant negative correlation (r = −0.94; P < 0.01) between the menaquinone-7 content and the change in the GP value over the measured temperature range (see Fig. 5A).
FIG 3.

Laurdan GP values of all L. monocytogenes strains tested. Strains with high (red), intermediate (green), and low (black) quinone content are presented in different colors. The data represent mean values and standard deviations (n = 3).
FIG 5.

Correlation of menaquinone-7 content after growth at 6°C with the differences in Laurdan GP values at 60° and 6°C (A) and with the differences in whole-cell anisotropy at 50°C and 10°C (B). The lines represent a linear fit of the data. Pearson product-moment correlation; r = −0.94, P < 0.01 (A) and r = −0.95, P < 0.01 (B). Means and standard deviations are shown.
The lateral diffusion or membrane fluidity was analyzed by the fluorescence anisotropy of TMA-DPH [1-(4-trimethylammoniumphenyl)-6-phenyl-1,3,5-hexatriene p-toluenesulfonate] and revealed a similar anisotropy temperature relation for all the strains with low quinone content at a growth temperature of 6°C (strains FFL 1, FFL 11, 1B, 3B, and Iso 11/13) (Fig. 4). All of these strains showed a negative correlation between anisotropy and temperature. Anisotropy decreased from about 0.26 at 10°C to about 0.20 at 50°C. Only for strain Iso 11/13 did anisotropy approximate a constant level above 30°C, which indicated a complete membrane transition to the liquid state (Fig. 4B). Strains of group B, with high menaquinone-7 content after growth at 6°C, showed a more constant membrane fluidity with less impact of temperature. This indicated higher membrane fluidity at low temperature than strains with low menaquinone-7 content. This effect was mostly expressed in strains DSM 20600T and FFH. The two strains showed almost constant membrane fluidity over the temperature range analyzed (Fig. 4). Both strains showed significantly higher membrane fluidity than the other strains at low temperatures. At higher temperatures, anisotropy was stabilized, and thus, fluidity was lower than for strains with low menaquinone-7 contents. The data shown in Fig. 5B demonstrate significant negative correlation (r = −0.95; P < 0.01) between change of anisotropy and menaquinone content for strains grown at low temperature. The data shown in Fig. 5 also confirmed the intermediate response of strains FF 127 and FF 141 for the GP and anisotropy analyses.
FIG 4.

(A) TMA-DPH values of L. monocytogenes DSM 20600T, ATCC 19115, FFL 11, 1B, and 3B (48 mM phosphate buffer, pH 7.4) at 6°C growth temperature. (B) TMA-DPH values of L. monocytogenes FFL 1, Iso 11/13, FFH, FF 127, and FF 141 (48 mM phosphate buffer, pH 7.4) at 6°C growth temperature. Strains with high (red), intermediate (green), and low (black) quinone content are presented in different colors. The isolates were divided into two panels for clarity. The data represent mean values and standard deviations (n = 3).
Menaquinone suppression test.
To reveal the impact of the menaquinone concentration on membrane fluidity, we reduced the concentration by feedback inhibition, as proposed by Tsukamoto et al. (30). The feedback inhibition of menaquinone synthesis was initiated by supplementation with three aromatic amino acids. The data shown in Fig. 6 display the reduction of the menaquinone-7 content in L. monocytogenes FFH and DSM 20600T at growth temperatures of 6°C and 37°C. As expected, the menaquinone-7 content decreased by about 30 to 40% in both strains after aromatic amino acid supplementation at both growth temperatures. As negative controls, the nonaromatic amino acids l-alanine, l-cysteine, and l-serine were supplemented. These amino acids have polarities similar to those of l-tyrosine, l-tryptophan, and l-phenylalanine. No decrease in the menaquinone-7 concentration could be found for the negative controls.
FIG 6.
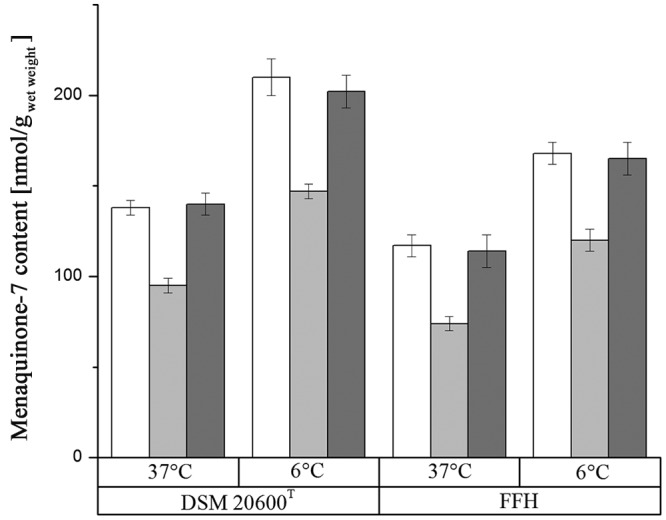
Effect of aromatic amino acid supplementation on total menaquinone-7 content in L. monocytogenes strains FFH and DSM 20600T: white, without supplementation; light gray, with 180 mg/liter (each) l-phenylalanine, l-tryptophan, and l-tyrosine; dark gray, with 180 mg/liter (each) l-alanine, l-cysteine, and l-serine. Means and standard deviations are shown.
The decreased content of menaquinone-7 showed an impact on membrane fluidity as measured by TMA-DPH anisotropy. The data provided in Fig. 7 illustrate the impact of the menaquinone content on lipid mobility as a function of temperature. In both strains, the decreased menaquinone level resulted in lower membrane fluidity at lower temperatures (<20°C), whereas higher membrane fluidity could be observed at higher temperatures (>20°C). This effect occurred at both 6°C and 37°C growth temperatures. For unsupplemented controls, and also for controls supplemented with nonaromatic amino acids, no intensifying effect on membrane fluidity was found. These data indicate that the change in TMA-DPH anisotropy can be attributed to the change in the menaquinone content. There was no change in the fatty acid profile and the fatty acid content when aromatic amino acids were added (data not shown). The effect of naphthoquinones on membrane fluidity could be confirmed in an artificial system using dipalmitoylphosphatidylcholine (DPPC) vesicles and different amounts of vitamin K1 (Fig. 8). Supplementation with small amounts of vitamin K1 (1%) led to decreased membrane fluidity above the Tm of the DPPC vesicles. However, in this system, only a small impact of vitamin K1 on membrane fluidity below the Tm could be demonstrated.
FIG 7.

Effects of aromatic amino acid supplementation on membrane fluidity measured with TMA-DPH anisotropy (150 mM KCl solution, pH 7.0) in L. monocytogenes strains FFH (A and B) and DSM 20600T (C and D) grown at 6°C (A and C) and 37°C (B and D). Solid squares, without aromatic amino acids; solid triangles, with 180 mg/liter (each) l-phenylalanine, l-tryptophan, and l-tyrosine; open triangles, with 180 mg/liter (each) l-alanine, l-cysteine, and l-serine. Means and standard deviations are shown.
FIG 8.

Effect of vitamin K1 on the temperature dependence of TMA-DPH anisotropy in DPPC MLV. Squares, 100% DPPC; solid triangles, 99% DPPC plus 1% vitamin K1; open triangles, 90% DPPC plus 10% vitamin K1. Means and standard deviations are shown.
DISCUSSION
Within the analyzed strains, we could detect significant differences concerning adaptation of the fatty acid profile to low growth temperature. The extent of fatty acid profile adaptation was correlated with the menaquinone content and membrane fluidity. The analyzed L. monocytogenes strains showed a temperature-dependent response of their fatty acid profiles (Table 1 and Fig. 2), which is in accord with previous reports (8, 12, 13). However, the extent of the fatty acid profile modification showed a clear difference between several isolates, among which two distinct groups could be distinguished. In particular, the three strains DSM 20600T, ATCC 19115, and FFH showed less pronounced fatty acid shifts at lower growth temperatures than the remaining strains, FFL 1, FFL 11, 1B, 3B, and Iso 11/13. This pointed to other mechanisms with effects on membrane fluidity. In this study, the menaquinone-7 content was identified as an additional modulator of membrane fluidity. The content of menaquinone-7 was correlated with the extent of the fatty acid profile adaptation (Fig. 2). For the quantification of the adaptive response of the fatty acid profiles, we calculated a virtual melting temperature of the fatty acid profile by considering the melting temperature of each fatty acid and the portion of that lipid in the profile. This is a more appropriate indicator of the adaptive response than the ratio of selected fatty acids, e.g., the ratio of iso and anteiso compounds. This indicator integrates all adaptive responses that are changes in the anteiso/iso ratio and reduction of the fatty acid chain length. Both are known to contribute to the adaptive response of L. monocytogenes (13, 16, 31).
The polar head groups of the membrane lipids were not examined in this study because their influence on thermal membrane properties was assumed to be small (5, 32). In accord with this, previous studies demonstrated that the polar lipid composition of L. monocytogenes did not change at low temperatures (33). This is in accord with the accepted primary function of polar head groups, which is support of membrane protein function (34–36).
Congruently with the fatty acid adaptive responses of groups A and B, the strains could be differentiated into the same groups based on their quinone contents. The isolates FFL 1, FFL 11, 1B, 3B, and Iso 11/13 showed the lowest menaquinone-7 concentrations at both growth temperatures. The three strains DSM 20600T, ATCC 19115, and FFH showed 2- to 3-fold increases in menaquinone-7 content at the 6°C growth temperature compared to 37°C. This is remarkable, because it did not correspond to the reduced growth rates at low temperatures, which decreased by 85% for all the strains (data not shown). Lower growth rates and, according to the Arrhenius equation, reduced metabolic activity should constitute a lower demand for respiratory electron carriers. The opposite responses of the three strains indicate another function of menaquinones in membrane fluidity adjustment, apart from being an electron carrier. In this context, it should be mentioned that the menaquinone pool is available in excess for the purpose of electron transport (28). We could demonstrate that strains with increased menaquinone-7 contents at 6°C also showed reduced fatty acid shifts (Table 1 and Fig. 2). This becomes particularly clear if the theoretical melting temperatures of the various fatty acid compositions (WAMT [Table 1]) are considered. In strains DSM 20600T, ATCC 19115, and FFH, the differences of 2 to 3 K between the two growth temperatures were one-half to one-third of the differences found for the other strains. This suggests that membrane fluidity may be stabilized by higher concentrations of menaquinone, so that the adaptation via the fatty acid profile adaptation can be reduced.
Mastronicolis et al. (12) showed that cold-shocked stationary-phase cultures did not show any fatty acid adaptation in the first 3 days. Cultures increased their proportion of neutral lipids only by about 30%. Isoprenoid quinones are part of the neutral lipid fraction. However, Mastronicolis et al. (12) did not characterize these lipid fractions in more detail. The increase in the quinone concentration indicates a further function of isoprenoid quinones, which is improvement of membrane fluidity in a fatty acid-independent way. This fatty acid-independent adaptive response may represent a growth advantage in nutrient-limited environments. The synthesis of lipids is energy intensive, especially synthesis of the acyl chains (5). In L. monocytogenes, the fatty acid profile alteration occurs only by de novo synthesis of the branched fatty acids and not by modification of the existing lipids (8).
The data presented in Fig. 4A and B illustrate the anisotropy progression of the strains in a temperature range of 6 to 50°C. No strain showed the two typical plateaus that indicate the final states of biomembranes: the gel-like solid state (high anisotropy) or the liquid-crystalline fluid state (low anisotropy). A linear relationship between anisotropy and temperature was usually seen over the entire temperature range. This linear range usually describes the phase transition of the membrane (37). For an artificial membrane system, the well-defined transition phase is shown in Fig. 8. This indicates that the phase transition in all tested L. monocytogenes strains was highly broadened, and a fluid membrane state was provided over a wider temperature range. The anisotropy data showed that a higher menaquinone-7 content had a flattening effect on the anisotropy temperature relationship, so that the phase transition had been continuously broadened. The menaquinone-7 content correlated strongly with the anisotropy slope for all analyzed strains. As a consequence of this flattening, strains with high menaquinone-7 content also had markedly higher membrane fluidity at low temperatures. This effect was obvious (Fig. 4A and B) for strains DSM 20600T and FFH. Strains with lower quinone content, such as FFL 1, showed an almost linear curve, and the fluidity steadily increased with temperature. For strains FFH and DSM 20600T, the anisotropy did not change significantly over the temperature range. From 10°C, the membrane fluidity was almost constant over the entire temperature range. As a result, the fluidity for strain DSM 20600T was higher at low temperatures than for strain FFL 1 and lower at higher temperatures than the membrane fluidity of strain FFL 1. For none of the strains could the complete phase transition to the gel state be presented within the temperature range analyzed.
Another detail of membrane characteristics was revealed by Laurdan GP measurement (Fig. 3). There is good evidence that GP values represent membrane order rather than membrane fluidity (37). For all three strains of group B, low anisotropy values revealed higher membrane fluidity at 6 and 10°C than for strains of group A (Fig. 4A and B). In contrast, the membrane order for isolates of group B was similar to that of group A at low temperatures and was more constant than for group A strains at higher temperatures, from 30°C to 60°C (Fig. 3). This is in accord with earlier reports by Harris et al. (37) and Sáenz et al. (25, 26), who found that membranes are strongly ordered and condensed by storage of lipophilic substances, such as cholesterol and hopanoids, while maintaining lateral mobility. The work presented here suggests a similar effect for isoprenoid quinones, as well.
We did not observe a distinct phase transition between the solid gel-like state and the fluid liquid-crystalline state. Thus, in L. monocytogenes, a secondary membrane modification mechanism appears to be present, which caused an optimized membrane fluidity by broadening the phase transition. This could also explain why L. monocytogenes is capable of growing over an exceptionally large temperature range, from −2°C to 50°C (1, 4). The increased menaquinone content at low temperatures suggests that this effect is caused by this lipid. The fatty acid data also support this hypothesis. The WAMT values indicated a less pronounced adjustment of fatty acids to low growth temperatures if menaquinone concentrations are high (Fig. 2).
The different extents of fatty acid profile adaptation of the isolates were not correlated with an increased susceptibility to stressors, like freeze-thaw cycles. All the isolates from food showed similarly high resistance to freeze-thaw cycles independent of their membrane adaptation response to low temperatures (Fig. 1). In contrast, the two strains from culture collections, DSM 20600T and ATCC 19115, showed clearly higher log unit reductions in viable-cell counts after up to three freeze-thaw cycles (Fig. 1). Both reference strains were isolated decades ago from mammals. Different isolation sources, as well as long deposition histories in culture collections, may be the cause of this increased susceptibility.
To confirm the impact of the menaquinone content on membrane fluidity regulation, we modified the quinone contents in the L. monocytogenes strains. The first approaches to increase isoprenoid quinone content, by supplementation of the cultures with vitamin K1, were not successful because various emulsifiers used for vitamin K1 solubilization also affected membrane fluidity. An alternative approach was aimed at suppressing menaquinone synthesis by supplementation with three aromatic amino acids. This approach was applied by Tsukamoto et al. (30) for reduction of the menaquinone content in Bacillus subtilis. The aromatic amino acids caused product inhibition of the 3-deoxyarabinoheptulosanate-7-phosphate synthase in the shikimate pathway. The pathway is also involved in quinone synthesis. Based on this inhibition approach, we were able to reduce the menaquinone contents of two L. monocytogenes strains in group B (Fig. 6). This reduction resulted in a steeper phase transition (Fig. 7A to D) and therefore reduced the range of optimum membrane fluidity to a smaller temperature range. The anisotropy curves of menaquinone-reduced isolates approximated those of group A isolates. This confirmed the involvement of the menaquinone pool of the bacterial cell in membrane fluidity modulation.
We were also able to confirm the impact of menaquinone on membrane phase transition in a defined artificial system by mixing DPPC multilamellar vesicles (MLVs) with 1 and 10 mol% vitamin K1 (Fig. 8). In addition to the broadening of the phase transition, we also observed decreased phase transition temperatures with increasing vitamin K1 content. Similar effects were shown previously for different lipid vesicles mixed with ubiquinone-3 (38), vitamin K1 (22, 23), and cholesterol (37). Therefore, we could demonstrate an effect of isoprenoid quinones on artificial lipid vesicles similar to that shown for whole cells of L. monocytogenes. However, in this artificial system, the broadening effect in DPPC MLVs was much more pronounced at temperatures above the Tm.
To our knowledge, this work demonstrates for the first time the involvement of isoprenoid quinones in membrane fluidity adaptation. For organisms with a capacity to adapt to a broad growth temperature range, like L. monocytogenes, this is a promising avenue for studying and understanding the underlying mechanisms of this exceptional capability.
MATERIALS AND METHODS
Strains, culture media, and cultivation.
In this work, a total of 10 different L. monocytogenes strains were examined. Eight strains, FFL 1, FFL 11, 1B, 3B, Iso11/13, FFH, FF 127, and FF 141, were isolated from different chilled foods and identified by fatty acid analysis and 16S rRNA gene sequencing during food analyses in the last few years. All the strains were isolated from different food samples over a period of 8 years, and unless otherwise noted, the strains were found in Germany. Strain FF 127 was isolated from precut smoked salmon in vacuum packing immediately after production in Austria in 2006. Strain FF 141 was found in 2007 in precut vacuum-packed smoked salmon, which was produced in Poland and then transported frozen to Austria. In 2011, strain FFH was detected during an analysis of minced meat. Strains FFL 1 and FFL 11 were isolated in 2012 from Irish smoked organic salmon and Scottish smoked salmon, respectively, obtained from a food retailer. The strains Iso11/13, 1B, and 3B were isolated from minced meat in 2013 and 2014. As reference strains, the type strain L. monocytogenes DSM 20600T and ATCC 19115 were included in the study.
L. monocytogenes strains were grown aerobically in CASO-Bouillon (Merck 105459), composed of peptone from casein (17.0 g/liter), peptone from soy meal (3.0 g/liter), d-(+)-glucose (2.5 g/liter), sodium chloride (5.0 g/liter), and dipotassium hydrogen phosphate (2.5 g/liter) and supplemented with yeast extract (6.0 g/liter). For menaquinone-7 suppression tests, the bouillon was supplemented with a mixture of three aromatic amino acids: phenylalanine, tyrosine, and tryptophan (180 mg/liter each) (30). The nonaromatic amino acids l-alanine, l-cysteine, and l-serine were used as controls. The pH values of the test media were not affected by these supplementations. Cultures were prepared in triplicate, inoculated with 1% (vol/vol) overnight culture, and incubated at 37°C and 6°C until late exponential phase (A625 = 0.8 to 1). Cell densities were measured at 625 nm with a UV-visible (Vis) spectrophotometer (Genesys 10uv scanning; Thermo Fisher Scientific, Waltham, MA). Cultures were harvested by centrifugation (12,860 × g for 10 min) at the corresponding growth temperatures and washed twice with pretempered 137 mM phosphate-buffered saline (PBS), pH 7.4. Afterward, the cells were used for fatty acid analyses, menaquinone-7 content determination, and membrane fluidity measurements. Cell colonies were cultivated on Caso agar (Merck; 105458) supplemented with yeast extract (6.0 g/liter) at 30°C.
L. monocytogenes serovar differentiation.
The isolates and reference strains were assigned to serovar groups by multiplex PCR according to the method of Doumith et al. (29). For template DNA, up to 5 colonies were suspended in 100 μl distilled water (dH2O) and incubated at 95°C for 20 min. After centrifugation (20,820 × g at 4°C), 2 μl of the supernatant was used for PCR. After amplification, 10 μl of the reaction mixture was mixed with 6× loading buffer and separated on a 2% agarose gel in Tris-acetate-EDTA (TAE) buffer. The gels were stained with Gel Red (Biotium 41001) for 10 to 20 min.
Temperature stress tests.
Each strain was subjected to three freeze-thaw cycles in order to test its resistance to low-temperature stress. Aliquots of three tubes with 2 ml cell suspension for each strain grown at 6°C were frozen at −20°C. After 24, 48, and 72 h, the cells were thawed for 10 min at room temperature, and the viable-cell count was determined. The remaining sample volume was refrozen for subsequent freeze-thaw cycles.
Fatty acid analysis.
Approximately 50 to 100 mg of harvested and washed cell pellets was used for fatty acid analysis. Fatty acids were extracted by methanolysis as described by Sasser (39) and identified by gas chromatography-mass spectrometry (GC-MS) with a gas chromatograph (model 7890A; Agilent Technologies Germany GmbH, Waldbronn, Germany) equipped with a 5% phenylmethyl silicone capillary column and a mass spectrometer (model 5975C; Agilent Technologies Germany GmbH), as previously described by Lipski and Altendorf (40). Fatty acids were analyzed with ChemStation software (Agilent Technologies Germany GmbH) and identified by their retention times and mass spectra.
The adaptive response of the fatty acid composition to low temperature was indicated as the WAMT of the detected fatty acids. This parameter integrates quantitative changes of all membrane fatty acids and considers the individual melting temperature of each fatty acid. The WAMT is not identical to the real melting temperature of the cytoplasmic membrane, which also depends on the total polar lipid structure. The WAMT was calculated using the following equation: WAMT = percentage (FA1) × Tm (FA1) + percentage (FA2) × Tm (FA2) + … + percentage (FAn) × Tm (FAn), where FA1 to FAn are all the fatty acids present in the fatty acid profile, percentage (FA1) is the percentage of fatty acid no. 1, and Tm (FA1) is the melting temperature of that fatty acid. The melting temperatures of all the fatty acids were taken from Knothe and Dunn (15).
Isoprenoid quinone analysis.
Washed cell pellets were transferred onto filter paper (Schleicher & Schuell GmbH, Dassel, Germany), dried at room temperature for 10 min to remove excess water, and weighed. Quinone extraction was performed using a modified solid-phase extraction method, as described by Hu et al. (41). Pellets with 20 to 100 mg cell wet weight were suspended in 3 ml 48 mM K2HPO4 (pH 7.4) using 50-ml hydrolysis tubes. Nine milliliters of methanol and 5 ml chloroform containing an internal vitamin K1 standard (Sigma-Aldrich; 95271; 6.55 nmol) were added to the suspended cells and shaken for 30 min. Five milliliters of double-distilled water (ddH2O) and 5 ml chloroform were added and centrifuged at 1,160 × g for 5 min for phase separation. Chloroform extraction was repeated twice, and the organic phases were pooled and evaporated to dryness using a rotary vacuum evaporator (10,000 Pa; 38°C; IKA Werke GmbH & Co. KG, Staufen, Germany). The residues were dissolved in 5 ml hexane, concentrated to 1 ml, and purified using solid-phase extraction. The remaining steps were performed according to the method of Hu et al. (41). The quinone extracts were analyzed on an Agilent 1260 series high-performance liquid chromatography (HPLC) instrument with a Quat Pump, an auto sampler, a diode array detector, and a thermostated column compartment. The HPLC flow rate was 1 ml/min. As the mobile phase, methanol-isopropyl ether (9:2 [vol/vol]) were used. Compounds were separated on a reversed-phase column (ODS Hypersile RP18; Thermo Fisher, USA) isothermal at 30°C and detected at 270 nm and 275 nm. Quinones were identified by their absorption spectra and retention times. Reference quinones were taken from type strains with known quinone patterns. The quinone concentration was calculated with an internal vitamin K1 standard.
Membrane fluidity analyses by general polarization and anisotropy.
Steady-state fluorescence measurements were performed on an LS 55 spectrofluorometer (PerkinElmer LAS GmbH, Rodgau, Germany) equipped with a pulsed xenon lamp, excitation and emission monochromators, and polarizing filters. The sample temperature was regulated with a Peltier element (PTP-1; PerkinElmer LAS GmbH, Rodgau, Germany). Two different probes were used to measure different physical properties of biomembranes. Laurdan GP was used to determine membrane order and TMA-DPH anisotropy to measure motility of the lipid molecules (37).
For Laurdan measurements, washed cells were suspended in 48 mM K2HPO4 (pH 7.4) buffer and diluted to an optical density at 625 nm (OD625) of 0.2. According to the method of Molina-Höppner et al. (42), Laurdan stock solution was prepared in ethanol at 2 mM and stored in the dark at 4°C. Staining was performed at a concentration of 20 μM for 30 min at 30°C in the dark. Labeled cells were washed twice with particle-free 6°C precooled K2HPO4 buffer by centrifugation at 2,060 × g at 6°C for 10 min. Nonstained cells were used to determine blank values. Two milliliters of suspension was transferred to a 3,500-μl quartz cuvette (Hellma GmbH, Müllheim, Germany). Emission spectra (slit, 3.0 nm) were recorded from 380 nm to 600 nm following excitation (slit, 10.0 nm) at 360 nm at the indicated temperatures. GP values were calculated using emission values (I) at 435 nm and 500 nm (37) as follows: GP = (I435 − I500)/(I435 + I500).
TMA-DPH staining was done analogously to Laurdan staining and as previously described by Usui et al. (43) and Abe and Hiraki (44). Anisotropy measurements of amino acid-supplemented cells were done in KCl solution (pH 7.0) instead of phosphate buffer. TMA-DPH stock solution was prepared in dimethyl sulfoxide (DMSO) at a concentration of 400 μM. The cells were stained with 0.5 μM TMA-DPH for 10 min at 30°C in the dark and washed twice. The excitation and emission wavelengths were 355 nm and 425 nm, respectively. Anisotropy values were calculated from polarized intensities using the following equation: r = (IVV − GIVH)/(IVV + 2GIVH), where I is the fluorescence intensity from which blank values from nonlabeled cells were subtracted. G stands for G factor, calculated as the ratio IHV/IHH. H (horizontal) und V (vertical) indicate the polarizer positions for the excited and the emitted light. Each data point was calculated from 10 to 20 single measurements. The data are shown as means with standard deviations from independent biological triplicates.
The fluidizing effect of naphthoquinones on biomembranes was confirmed in defined MLVs with increasing quinone supplementation. Vesicles were formed according to the protocol of Harris et al. (37). DPPC was purchased from Avanti Polar Lipids (850355; Alabaster, AL) and TMA-DPH and vitamin K1 from Sigma-Aldrich. MLVs were assembled without vitamin K1 supplementation and with 1 and 10% vitamin K1 supplementation.
Statistical evaluation.
Mean values of triple biological replicates were calculated for all the experiments. Normal distribution of the data was confirmed by the Shapiro-Wilk test. Correlations were analyzed by the Pearson product-moment correlation test.
ACKNOWLEDGMENTS
We thank Roland Winter and Nelli Erwin (TU Dortmund) for introduction to TMA-DPH-dependent fluorescence anisotropy measurements. We are also grateful to Eva Meyer and Bettina Becker for technical support.
The research was funded by the Deutsche Forschungsgemeinschaft (DFG project LI 1624/8-1).
REFERENCES
- 1.Farber JM, Peterkin PI. 1991. Listeria monocytogenes, a food-borne pathogen. Microbiol Rev 55:476–511. [DOI] [PMC free article] [PubMed] [Google Scholar]
- 2.Hernandez-Milian A, Payeras-Cifre A. 2014. What is new in listeriosis? Biomed Res Int 2014:358051. doi: 10.1155/2014/358051. [DOI] [PMC free article] [PubMed] [Google Scholar]
- 3.Angelidis AS, Smith LT, Hoffman LM, Smith GM. 2002. Identification of OpuC as a chill-activated and osmotically activated carnitine transporter in Listeria monocytogenes. Appl Environ Microbiol 68:2644–2650. doi: 10.1128/AEM.68.6.2644-2650.2002. [DOI] [PMC free article] [PubMed] [Google Scholar]
- 4.Ko R, Smith LT, Smith GM. 1994. Glycine betaine confers enhanced osmotolerance and cryotolerance on Listeria monocytogenes. J Bacteriol 176:426–431. doi: 10.1128/jb.176.2.426-431.1994. [DOI] [PMC free article] [PubMed] [Google Scholar]
- 5.Zhang YM, Rock CO. 2008. Membrane lipid homeostasis in bacteria. Nat Rev Microbiol 6:222–233. doi: 10.1038/nrmicro1839. [DOI] [PubMed] [Google Scholar]
- 6.Suutari M, Laakso S. 1994. Microbial fatty acids and thermal adaptation. Crit Rev Microbiol 20:285–328. doi: 10.3109/10408419409113560. [DOI] [PubMed] [Google Scholar]
- 7.Gounot AM, Russell NJ. 1999. Physiology of cold-adapted microorganisms, p 33–55. In Margesin R, Schinner F (ed), Cold-adapted organisms. Springer-Verlag, Berlin, Germany. [Google Scholar]
- 8.Annous BA, Becker LA, Bayles DO, Labeda DP, Wilkinson BJ. 1997. Critical role of anteiso-C15:0 fatty acid in the growth of Listeria monocytogenes at low temperatures. Appl Environ Microbiol 63:3887–3894. [DOI] [PMC free article] [PubMed] [Google Scholar]
- 9.Jones SL, Drouin P, Wilkinson BJ, Morse PD. 2002. Correlation of long-range membrane order with temperature-dependent growth characteristics of parent and a cold-sensitive, branched-chain-fatty-acid-deficient mutant of Listeria monocytogenes. Arch Microbiol 177:217–222. doi: 10.1007/s00203-001-0380-4. [DOI] [PubMed] [Google Scholar]
- 10.Chihib NE, Ribeiro da Silva M, Delattre G, Laroche M, Federighi M. 2003. Different cellular fatty acid pattern behaviours of two strains of Listeria monocytogenes Scott A and CNL 895807 under different temperature and salinity conditions. FEMS Microbiol Lett 218:155–160. doi: 10.1111/j.1574-6968.2003.tb11512.x. [DOI] [PubMed] [Google Scholar]
- 11.Russell NJ. 1984. Mechanisms of thermal adaptation in bacteria: blueprints for survival. Trends Biochem Sci 9:108–112. doi: 10.1016/0968-0004(84)90106-3. [DOI] [Google Scholar]
- 12.Mastronicolis SK, German JB, Megoulas N, Petrou E, Foka P, Smith GM. 1998. Influence of cold shock on the fatty-acid composition of different lipid classes of the food-borne pathogen Listeria monocytogenes. Food Microbiol 15:299–306. doi: 10.1006/fmic.1997.0170. [DOI] [Google Scholar]
- 13.Mastronicolis SK, Boura A, Karaliota A, Magiatis P, Arvanitis N, Litos C, Tsakirakis A, Paraskevas P, Moustaka H, Heropoulos G. 2006. Effect of cold temperature on the composition of different lipid classes of the foodborne pathogen Listeria monocytogenes: focus on neutral lipids. Food Microbiol 23:184–194. doi: 10.1016/j.fm.2005.03.001. [DOI] [PubMed] [Google Scholar]
- 14.Tatituri RV, Wolf BJ, Brenner MB, Turk J, Hsu FF. 2015. Characterization of polar lipids of Listeria monocytogenes by HCD and low-energy CAD linear ion-trap mass spectrometry with electrospray ionization. Anal Bioanal Chem 407:2519–2528. doi: 10.1007/s00216-015-8480-1. [DOI] [PMC free article] [PubMed] [Google Scholar]
- 15.Knothe G, Dunn RO. 2009. A comprehensive evaluation of the melting points of fatty acids and esters determined by differential scanning calorimetry. J Am Oil Chem Soc 86:843–856. doi: 10.1007/s11746-009-1423-2. [DOI] [Google Scholar]
- 16.Neunlist MR, Federighi M, Laroche M, Sohier D, Delattre G, Jacquet C, Chihib NE. 2005. Cellular lipid fatty acid pattern heterogeneity between reference and recent food isolates of Listeria monocytogenes as a response to cold stress. Antonie van Leeuwenhoek 88:199–206. doi: 10.1007/s10482-005-5412-7. [DOI] [PubMed] [Google Scholar]
- 17.Suzuki KI, Hamada M. 2012. Genus I. Microbacterium. Orla-Jensen 1919, 179AL emend. Takeuchi and Hatano. 1998b, 744VP, p 814–852. In Goodfellow M, K̈amfer P, Busse H-J, Trujillo ME, Suzuki K-I, Ludwig W, Whitman WB (ed), Bergey's manual of systematic bacteriology, 2nd ed, vol 5 Springer, New York, NY. [Google Scholar]
- 18.Heyrman J, De Vos P, Logan N. 2009. Genus XIX. Virgibacillus. Heyndrickx, Lebbe, Kersters, De Vos, Forsyth and Logan 1998, 104VP emend. Wainø, Tindall, Schumann and Ingvorsen 1999, 830 emend. Heyrman, Logan, Busse, Balcaen, Lebbe, Rodríguez-Díaz, Swings and De Vos 2003b, 510, p 193–228. In De Vos P, Garrity GM, Jones D, Krieg NR, Ludwig W, Rainey FA, Schleifer KH, Whitman WB (ed), Bergey's manual of systematic bacteriology, 2nd ed, vol 3 Springer, New York, NY. [Google Scholar]
- 19.Winn WC. 2005. Genus I. Legionella. Brenner, Steigerwalt and McDade 1979, 658AL, p 212–236. In Brenner DJ, Krieg NR, Staley JT (ed), Bergey′s manual of systematic bacteriology, 2nd ed, vol 2 Springer, New York, NY. [Google Scholar]
- 20.Collins MD, Jones D, Goodfellow M, Minnikin DE. 1979. Isoprenoid quinone composition as a guide to the classification of Listeria, Brochothrix, Erysipelothrix and Caryophanon. J Gen Microbiol 111:453–457. doi: 10.1099/00221287-111-2-453. [DOI] [PubMed] [Google Scholar]
- 21.Ortiz A, Villalaín J, Gómez-Fernández JC. 1986. The interaction of vitamin K1 with phospholipid vesicles. Biochem Biophys Acta 863:185–192. doi: 10.1016/0005-2736(86)90258-0. [DOI] [PubMed] [Google Scholar]
- 22.Ortiz A, Aranda FJ. 1999. The influence of vitamin K1 on the structure and phase behaviour of model membrane systems. Biochem Biophys Acta 1418:206–220. doi: 10.1016/S0005-2736(99)00034-6. [DOI] [PubMed] [Google Scholar]
- 23.Asai Y. 2000. The interaction of vitamin K1 with phospholipid membranes. Colloid Surface A 163:265–270. doi: 10.1016/S0927-7757(99)00317-9. [DOI] [Google Scholar]
- 24.Van Meer G, Voelker DR, Feigenson GW. 2008. Membrane lipids: where they are and how they behave. Nat Rev Mol Cell Biol 9:112–124. doi: 10.1038/nrm2330. [DOI] [PMC free article] [PubMed] [Google Scholar]
- 25.Sáenz JP, Sezgin E, Schwille P, Simons K. 2012. Functional convergence of hopanoids and sterols in membrane ordering. Proc Natl Acad Sci U S A 109:14236–14240. doi: 10.1073/pnas.1212141109. [DOI] [PMC free article] [PubMed] [Google Scholar]
- 26.Sáenz JP, Grosser D, Bradley AS, Lagny TJ, Lavrynenko O, Broda M, Simons K. 2015. Hopanoids as functional analogues of cholesterol in bacterial membranes. Proc Natl Acad Sci U S A 112:11971–11976. doi: 10.1073/pnas.1515607112. [DOI] [PMC free article] [PubMed] [Google Scholar]
- 27.Søballe B, Poole RK. 1999. Microbial ubiquinones: multiple roles in respiration, gene regulation and oxidative stress management. Microbiology 145:1817–1830. doi: 10.1099/13500872-145-8-1817. [DOI] [PubMed] [Google Scholar]
- 28.Hammond RK, White DC. 1970. Inhibition of vitamin K2 and carotenoid synthesis in Staphylococcus aureus by diphenylamine. J Bacteriol 103:611–615. [DOI] [PMC free article] [PubMed] [Google Scholar]
- 29.Doumith M, Buchrieser C, Glaser P, Jacquet C, Martin P. 2004. Differentiation of the major Listeria monocytogenes serovars by multiplex PCR. J Clin Microbiol 42:3819–3822. doi: 10.1128/JCM.42.8.3819-3822.2004. [DOI] [PMC free article] [PubMed] [Google Scholar]
- 30.Tsukamoto Y, Kasai M, Kakuda H. 2001. Construction of a Bacillus subtilis (natto) with high productivity of vitamin K2 (menaquinone-7) by analog resistance. Biosci Biotechnol Biochem 65:2007–2015. doi: 10.1271/bbb.65.2007. [DOI] [PubMed] [Google Scholar]
- 31.Miladi H, Bakhrouf A, Ammar E. 2013. Cellular lipid fatty acid profiles of reference and food isolates Listeria monocytogenes as a response to refrigeration and freezing stress. J Food Biochem 37:136–143. doi: 10.1111/j.1745-4514.2011.00607.x. [DOI] [Google Scholar]
- 32.Russell NJ. 1989. Functions of lipids: structural roles and membrane functions, p 279–365. In Ratledge C, Wilkinson SG (ed), Microbial lipids, vol 2 Academic Press, London, United Kingdom. [Google Scholar]
- 33.Verheul A, Russell NJ, Hof RVT, Rombouts FM, Abee T. 1997. Modifications of membrane phospholipid composition in nisin-resistant Listeria monocytogenes Scott A. Appl Environ Microbiol 63:3451–3457. [DOI] [PMC free article] [PubMed] [Google Scholar]
- 34.Tsatskis Y, Khambati J, Dobson M, Bogdanov M, Dowhan W, Wood JM. 2005. The osmotic activation of transporter ProP is tuned by both its C-terminal coiled-coil and osmotically induced changes in phospholipid composition. J Biol Chem 280:41387–41394. doi: 10.1074/jbc.M508362200. [DOI] [PubMed] [Google Scholar]
- 35.Zhang W, Campbell HA, King SC, Dowhan W. 2005. Phospholipids as determinants of membrane protein topology phosphatidylethanolamine is required for the proper topological organization of the γ-aminobutyric acid permease (GabP) of Escherichia coli. J Biol Chem 280:26032–26038. doi: 10.1074/jbc.M504929200. [DOI] [PubMed] [Google Scholar]
- 36.Xie J, Bogdanov M, Heacock P, Dowhan W. 2006. Phosphatidylethanolamine and monoglucosyldiacylglycerol are interchangeable in supporting topogenesis and function of the polytopic membrane protein lactose permease. J Biol Chem 281:19172–19178. doi: 10.1074/jbc.M602565200. [DOI] [PMC free article] [PubMed] [Google Scholar]
- 37.Harris FM, Best KB, Bell JD. 2002. Use of laurdan fluorescence intensity and polarization to distinguish between changes in membrane fluidity and phospholipid order. Biochem Biophys Acta 1565:123–128. doi: 10.1016/S0005-2736(02)00514-X. [DOI] [PubMed] [Google Scholar]
- 38.Asai Y, Watanabe S. 1999. The interaction of ubiquinone-3 with phospholipid membranes. FEBS Lett 446:169–172. doi: 10.1016/S0014-5793(99)00203-3. [DOI] [PubMed] [Google Scholar]
- 39.Sasser M. 1990. Identification of bacteria through fatty acid analysis, p 199–204. In Klement Z, Rudolph K, Sands DC (ed), Methods in phytobacteriology. Akadémiai Kiadó, Budapest, Hungary. [Google Scholar]
- 40.Lipski A, Altendorf K. 1997. Identification of heterotrophic bacteria isolated from ammonia-supplied experimental biofilters. Syst Appl Microbiol 20:448–457. doi: 10.1016/S0723-2020(97)80014-8. [DOI] [Google Scholar]
- 41.Hu HY, Fujie K, Urano K. 1999. Development of a novel solid phase extraction method for the analysis of bacterial quinones in activated sludge with a higher reliability. J Biosci Bioeng 87:378–382. doi: 10.1016/S1389-1723(99)80049-8. [DOI] [PubMed] [Google Scholar]
- 42.Molina-Höppner A, Doster W, Vogel RF, Gänzle MG. 2004. Protective effect of sucrose and sodium chloride for Lactococcus lactis during sublethal and lethal high-pressure treatments. Appl Environ Microbiol 70:2013–2020. doi: 10.1128/AEM.70.4.2013-2020.2004. [DOI] [PMC free article] [PubMed] [Google Scholar]
- 43.Usui K, Hiraki T, Kawamoto J, Kurihara T, Nogi Y, Kato C, Abe F. 2012. Eicosapentaenoic acid plays a role in stabilizing dynamic membrane structure in the deep-sea piezophile Shewanella violacea: a study employing high-pressure time-resolved fluorescence anisotropy measurement. Biochem Biophys Acta 1818:574–583. doi: 10.1016/j.bbamem.2011.10.010. [DOI] [PubMed] [Google Scholar]
- 44.Abe F, Hiraki T. 2009. Mechanistic role of ergosterol in membrane rigidity and cycloheximide resistance in Saccharomyces cerevisiae. Biochem Biophys Acta 1788:743–752. doi: 10.1016/j.bbamem.2008.12.002. [DOI] [PubMed] [Google Scholar]