Abstract
The purpose of the present study was to screen for differentially expressed proteins in the cerebrospinal fluid (CSF) of patients with Guillain-Barré syndrome (GBS). The identification of differentially expressed protein can provide new targets for understanding the pathogenic mechanism, early clinical diagnosis, prognosis and for measuring the effectiveness of interventions. We enrolled 50 GBS patients and 50 meningitis patients (control group) to compare protein expression in CSF. The GBS cases included 28 cases of acute inflammatory demyelinating polyneuropathy (AIDP) and 22 cases of acute motor axonal neuropathy (AMAN). We then performed two-dimensional differential in-gel electrophoresis combined with matrix-assisted laser desorption/ionization time-of-flight mass spectrometry to identify the differentially expressed proteins. The expression levels were validated by ELISA, and their accuracy, sensitivity, and specificity in GBS diagnosis were analyzed by the receiver operating characteristic curve. Three differentially expressed proteins were identified, including the upregulated haptoglobin (Hp) and heat shock protein 70 (Hsp70), and downregulated cystatin C. There were no significant differences between the AIDP and AMAN patients in the positive rates and quantitative expression levels of the three differentially expressed proteins. The accuracy of Hp in the diagnosis of GBS was 0.835, sensitivity was 86.7%, and specificity was 88.2%. The accuracy of cystatin C in the diagnosis of GBS was 0.827, sensitivity was 85.5%, and specificity was 89.7%. The accuracy of Hsp70 in the diagnosis of GBS was 0.841, its sensitivity was 87.8%, and its specificity was 92.3%. Hp and Hsp70 are significantly increased, and cystatin C is downregulated in CSF of GBS patients, which provides important biomarkers for early GBS diagnosis, although these proteins cannot distinguish AIDP and AMAN.
Keywords: Guillain-Barré syndrome, haptoglobin, heat shock protein 70, cystatin C
Introduction
The typical pathologic changes of Guillain-Barré syndrome (GBS) include local lymphocyte and macrophage infiltration, and nerve fiber demyelination. Its clinical manifestations include flaccid limb paralysis, facial paralysis, peripheral sensory disturbances and hyporeflexia in legs. Most studies argue that GBS is closely related to viral infections, inflammatory response, and autoimmune dysfunction (1,2). GBS is commonly seen in middle-aged and older people, and it is characterized by sudden onset and rapid progression. The clinical treatment includes antiviral drugs, γ-globulin, and glucocorticoids for the inflammation. The effective rate is about 60–85%, but the disability and fatality rates are high (3). Proteins are elevated in the cerebrospinal fluid (CSF) in the early phase with long peak duration, which is related to disease occurrence, development, treatment and prognosis (4). About 40–65% patients can be diagnosed due to the typical protein-cell separation (5) and early diagnosis is critical for effective treatment. However, there is still a lack of characteristic protein markers for GBS. With the application of differential research methods of proteomics, protein markers with a higher sensitivity and specificity have been identified for a variety of autoimmune diseases, such as nephritis, nephropathy, and systemic lupus erythematosus among others (6,7). Based on this, we applied proteomics to identify differentially expressed proteins in CSF of GBS patients. These new biomarkers will provide new targets for the pathogenic mechanism, early clinical diagnosis, intervention, and prognosis evaluation of the disease.
Subjects and methods
Study subjects
We recruited 50 patients diagnosed with GBS for the first time in the Second Hospital of Hebei Medical University from January 2015 to October 2016. The group included 28 cases of acute inflammatory demyelinating polyneuropathy (AIDP) and 22 of acute motor axonal neuropathy (AMAN). We also recruited 50 patients with acute meningitis as control group. Among the AIDP patients, 15 were male and 13 female, with an average age of 42.3±10.5 years and an average onset time of 11.6±4.5 h. Among the AMAN patients, 12 were male and 10 female, with an average age of 44.5±12.3 years and an average onset time of 12.3±5.5 h. The control group included 22 cases of viral meningitis, 10 of tuberculous meningitis, and 18 of bacterial meningitis. There were no significant differences in sex, age, and onset time between the two groups (P>0.05). This study was approved by the Ethics Committee of Tangshan Gongren Hospital (Hebei, China). Signed written informed consents were obtained from the patients and/or guardians.
Methods
GBS and meningitis were treated according to the standard medical guidelines. Peripheral venous blood and CSF specimens were collected and submitted for inspection 12 h after admission. Two-dimensional differential in-gel electrophoresis (2D DIGE) combined with matrix-assisted laser desorption/ionization time-of-flight mass spectro-metry (MALDI-TOF MS) and high-throughput methods in proteomics were used to screen the differentially expressed characteristic proteins in one CSF specimen. Protein expression levels in the other CSF specimen were detected by ELISA according to the screening results. The accuracy, sensitivity, and specificity of diagnosing GBS were analyzed by the receiver operating characteristic (ROC) curve. Kits were purchased from Beyotime Biotechnology (Jiangsu, China), and the procedures were in strict accordance with the manufacturer's instructions.
Sample preparation for proteomics analysis
Protein extraction was performed in 5 ml 100% ice acetone and 1 ml CSF. Acetone and CSF were mixed uniformly at a ratio of 5:1 and then precipitated overnight at −40°C, followed by centrifugation for 15 min at 4°C and drying at 37°C. Clean-up kit (Beijing Zhongshan Golden Bridge Biotechnology Co., Ltd., Beijing, China) was used to remove the salt and impurities from the samples, and 2-D Quant protein quantification kit (Sigma-Aldrich, St. Louis, MO, USA) was used for protein quantification.
Fluorescence labeling
NaOH solution (50 mM) was used to adjust the pH of the samples to 8.5–9.0. Six samples were taken from the GBS and the control groups. A total of 50 µg of each sample was added to a centrifuge tube. One sample from the GBS and the control groups were labeled using 1 µl CyDye (Cy3 and Cy5; R&D Systems, Minneapolis, MN, USA). A total of 25 µl of each sample in the 12 centrifuge tubes was added to another centrifuge tube and 6 µl Cy2 (R&D Systems) were added to create the internal standard. After all the samples were incubated at 4°C for 25 min in the dark, 1 ml (6 µl internal standard) of a 10 mM lysine solution was added to each sample and incubated at 4°C for 10 min.
2D DIGE
The 6 fluorescence-labeled samples were mixed uniformly and an appropriate amount of hydration solution (8 M urea + 2% cholamidopropyl propane sulphonate + 0.6% dithiothreitol (DTT) + 0.5% IPG buffer + 0.002% bromophenol blue) were added for a total volume of 450 µl. Samples were mixed uniformly and centrifuged at 25,000 × g for 10 min. The samples were dripped continuously from acidic side to alkaline side, and 24 cm IPG (pH 4–7) adhesive tape was used, the tape number was recorded and put into the glue groove face downward. The liquid was distributed between the two electrodes in the glue groove, covering the electrodes. A total of 1.4 ml cover oil (Dry Strip Cover Fluid) was added above the adhesive tape, connected to the electrophoresis apparatus, and hydration and isoelectric focusing were performed at 20°C at 50 µA current (30 V for 6 h, 500 V for 1 h, 1,000 V for 3 h, 8,000 V for 3 h, and 500 V for 4 h).
Equilibration: The IPG adhesive tape was equilibrated for 15 min in equilibration liquid I containing 1% DTT (50 mM Tris + 6 M urea + 30% glycerol + 2% SDS + bromophenol blue) and equilibration liquid II containing 4% iodoacetamide.
Vertical electrophoresis (24 cm): Polyacrylamide gel was prepared and poured into the glass clearance using sample injector along the edge of installed mold. The top edge of the gel was sealed using water-saturated n-butanol, followed by polymerization for 3 h. The balanced IPG adhesive tape was put into the glass clearance, covered by 1 ml 0.5% agarose, and then subjected to constant-current 40 mA electrophoresis for 30 min in an Ettan DALTsix electrophoresis system (Invitrogen, Carlsbad, CA, USA), followed by constant-power (9 W) electrophoresis overnight.
Gel image scanning and analysis
Cy3, Cy5, and Cy2 imaging scans was performed in fluorescence mode using Typhoon 9400 laser scanner (Media Cybernetics, Rockville, MD, USA). We used DeCyder automated software (Applied Biosystems, City Foster, CA, USA) for the analysis. The gel with the maximum number of protein points was automatically recognized as the master gel, and the increase or decrease of protein content for 20% was considered to be different.
Preparation of gel electrophoresis and staining
A total of 800 µg protein were used from each group to prepare gel electrophoresis as described above. The molecular weight marker was placed on the lateral side of the acidic end of adhesive tape. After the electrophoresis, the gel was fixed in 20% TCA for 1 h, followed by Coomassie Brilliant Blue staining for 2 h, repeated discoloration with 10% acetic acid and washed in distilled water twice.
Mass spectrum identification of differentially expressed points
An Ettan Picker was used to collect the protein spots corresponding to the differentially expressed proteins, and placed in a 96-well plate. A total of 100 µl solution of 50% methanol and 50 µl 50 mM NH4HCO3 was used to soak the gel, and incubated on the shaker for 40 min. Then the gel was immersed by 100% acetonitrile (200 µl per well) for 10 min, and 10 µl 20 ng/µl trypsin was added, followed by digestion at 37°C for 2 h. A total of 60 µl solution of 50% ACN and 0.1% TFA were used for extraction of peptide fragment twice. Sample application: Eptan spotter was used to absorb 0.3 µl peptide sample and mix with the same volume of matrix for target. Protein peptide mass fingerprinting analysis was performed using MALDI-TOF MS device (Bio-Rad Laboratories, Inc., Hercules, CA, USA).
Statistical analysis
SPSS 20.0 software (IBM SPSS, Armonk, NY, USA) was used for statistical analysis. Measurement data are presented as mean ± standard deviation, and independent sample t-test was used for intergroup comparison. Data are presented as the number of cases or percentage (%), and Chi-square test was used for intergroup comparison. P<0.05 was considered to indicate a statistically significant difference.
Results
Proteomic analysis of CSF proteins in GBS
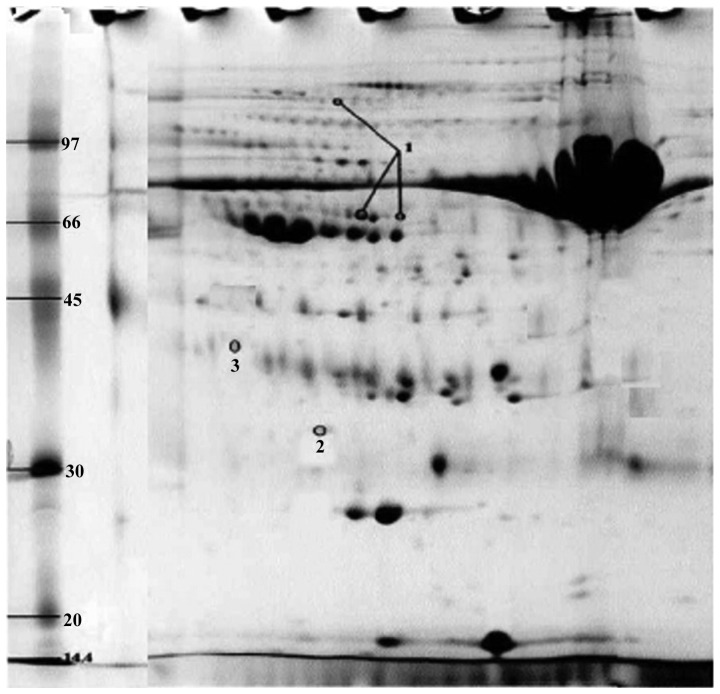
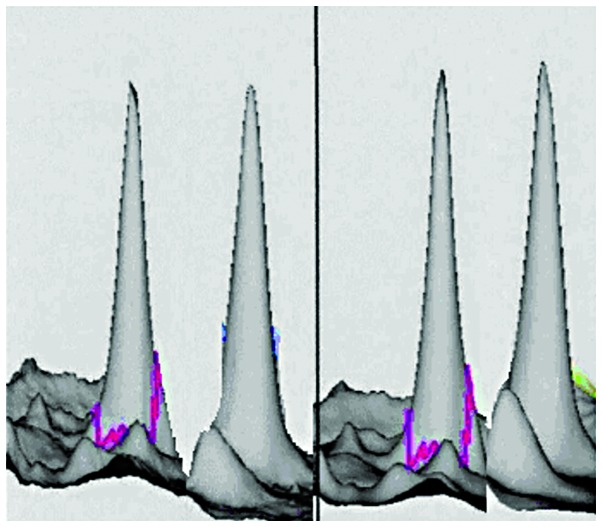
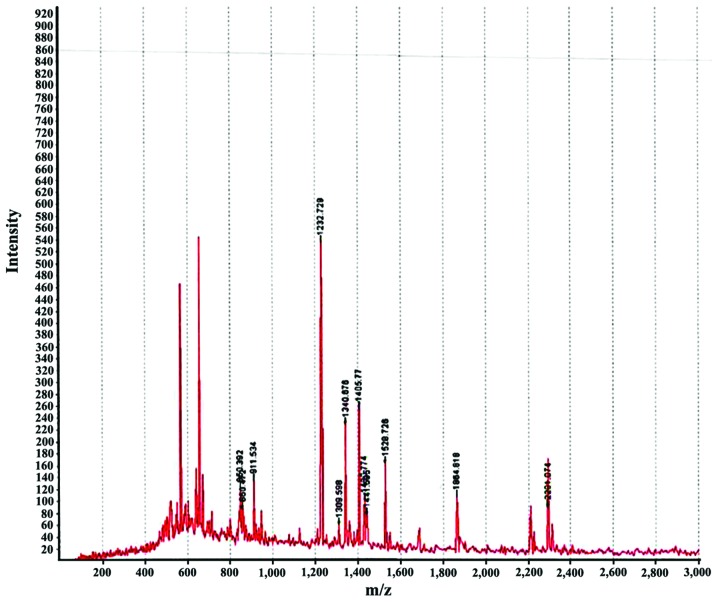
We performed 2D DIGE with CSF samples from GBS and control groups. Software analysis showed 36 differentially expressed protein spots in the GBS group: 20 proteins were upregulated and 16 proteins were downregulated. Of the differentially expressed proteins, we identified the spots corresponding to the most upregulated and downregulated proteins. The most upregulated protein was identified as haptoglobin (Hp) by mass spectrometry (Figs. 1 and 3). Hp was upregulated 1.66 times in GBS (P<0.001). The most downregulated spot was identified by mass spectrometry as cystatin C (Figs. 2 and 3), which was downregulated 1.05 times in GBS (P<0.001). Peptide mass fingerprinting of the differential protein spot 1 identified as the Hp by mass spectrometry with a sequence coverage rate of 34.6% and an expected value of 0.000 (Fig. 4).
Figure 1.
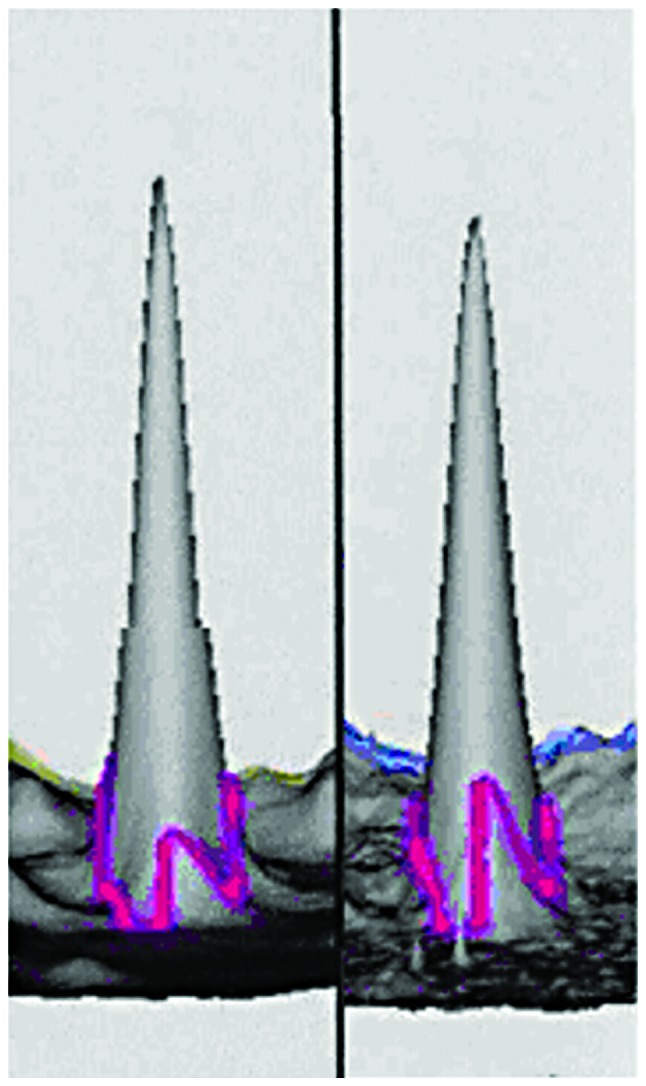
3D reconstructed image of haptoglobin in the GBS (left) and control (right) groups. The spot was upregulated in GBS 1.66 times compared to the control group (P<0.001). GBS, Guillain-Barré syndrome.
Figure 3.
2D staining image of protein in CSF in GBS group, marked as the differentially expressed protein spots. CSF, cerebrospinal fluid; GBS, Guillain-Barré syndrome.
Figure 2.
3D reconstructed image of cystatin C in the GBS (left) and control (right) groups. The spot was downregulated 1.05 times in GBS compared to the control group (P<0.001). GBS, Guillain-Barré syndrome.
Figure 4.
Peptide mass fingerprinting of haptoglobin with a sequence coverage rate of 34.6% and an expected value of 0.000.
We searched the NCBI database using ProFound software to identify the proteins. Four protein spots were accurately identified as three proteins (Fig. 3): Hp and heat shock protein 70 (Hsp70) (point 3, upregulated for 1.58 times) were upregulated and cystatin C was downregulated. Point 1 was identified as the same protein, which might be related to the protein fragments formed after protein degradation or phosphorylation modification after protein translation. MALDI-TOF MS results of differential proteins in CSF in GBS group are shown in Table I.
Table I.
MALDI-TOF MS identification of differential proteins in CSF in GBS group.
| Protein | NCBI database | Protein name | Expected value | Isoelectric point (PI) | Molecular weight (kDa) | GBS/control group | Sequence coverage rate (%) |
|---|---|---|---|---|---|---|---|
| 1 | gil 2356245 | Haptoglobin | 0.000 | 5.8 | 35.62 | 1.66 | 34.6 |
| 2 | gil 5264243 | Cystatin C | 0.012 | 5.6 | 35.27 | −1.05 | 31.2 |
| 3 | gil 648597 | Heat shock | 0.006 | 6.0 | 34.52 | 1.58 | 26.9 |
| protein 70 |
MALDI-TOF MS, matrix-assisted laser desorption/ionization time-of-flight mass spectrometry; CSF, cerebrospinal fluid; GBS, Guillain-Barré syndrome.
Expression analysis of differential proteins in the GBS subgroups
We found no differences in the comparison of positive rates and quantitative expression levels of three differentially expressed proteins detected in AIDP and AMAN patients (P>0.05; Table II).
Table II.
Expression analysis of differential proteins in the GBS subgroups.
| Haptoglobin | Cystatin C | Heat shock protein 70 | ||||
|---|---|---|---|---|---|---|
| Items | Positive rate | Expression level (µg/l) | Positive rate | Expression level (µg/l) | Positive rate | Expression level (µg/l) |
| AIDP (n=28) | 20 (71.4) | 123.6±53.2 | 18 (64.3) | 85.5±23.4 | 16 (57.1) | 214.5±68.7 |
| AMAN (n=22) | 16 (72.7) | 132.4±61.5 | 15 (68.2) | 76.7±15.9 | 13 (59.1) | 223.6±75.8 |
| t/χ2 | 0.010 | 0.426 | 0.083 | 0.396 | 0.019 | 0.321 |
| P-value | 0.919 | 0.535 | 0.773 | 0.698 | 0.890 | 0.752 |
GBS, Guillain-Barré syndrome; AIDP, acute inflammatory demyelinating polyneuropathy; AMAN, acute motor axonal neuropathy.
ROC analysis of differential proteins in the diagnosis of GBS
Expression levels of Hp, cystatin C, and Hsp70 were taken as the diagnostic indicators of GBS, and included into the ROC analysis (Table III; Fig. 5).
Table III.
ROC analysis of differential proteins in the diagnosis of GBS.
| Indicator | Accuracy (AUC) | 95% CI | P-value | Sensitivity | Specificity | Critical value (µg/l) |
|---|---|---|---|---|---|---|
| Haptoglobin | 0.835 | 0.807–0.896 | 0.015 | 86.7 | 88.2 | 66.5 |
| Cystatin C | 0.827 | 0.805–0.912 | 0.022 | 85.5 | 89.7 | 32.3 |
| Heat shock protein 70 | 0.841 | 0.822–0.954 | 0.006 | 87.8 | 92.3 | 95.2 |
ROC, receiver operating characteristic; GBS, Guillain-Barré syndrome; AUC, area under the curve.
Figure 5.
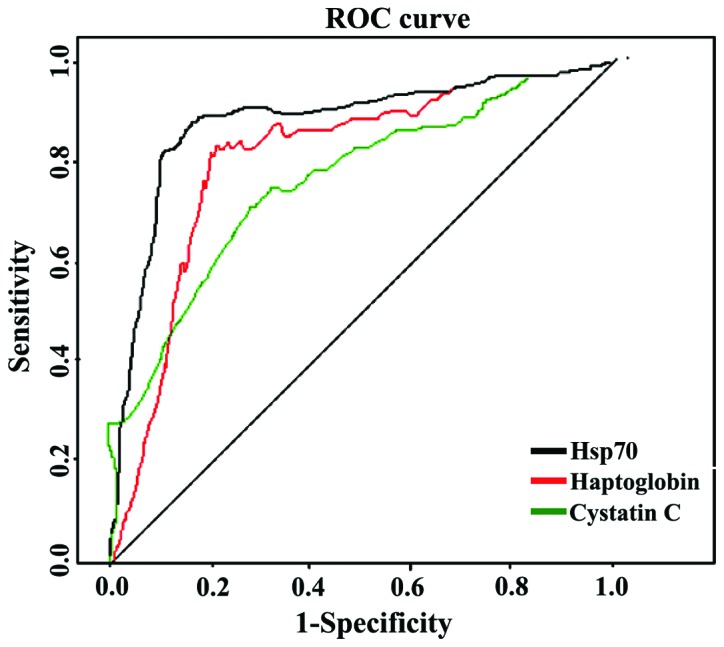
ROC analysis of differential proteins in the diagnosis of GBS. ROC, receiver operating characteristic; GBS, Guillain-Barré syndrome, Hsp70, heat shock protein 70.
Discussion
AIDP is a typical type of GBS, accounting for 50–70% (8). AMAN has different symptoms, including both motor and sensory disturbances, as well as more severe limb paralysis and little sensory nerve involvement, which has a high disability and fatality rate. AMAN is related to Campylobacter jejuni infection and it has no significant lymphocyte infiltration and normal myelin sheath (9). Proteomics can achieve the separation of all proteins in body fluids or tissues, and analyze the differences in expression levels and posttranslational modifications. Here, we showed three differentially expressed proteins in GBS patients: Hp and Hsp70 were upregulated, and cystatin C was downregulated. There were no significant differences in the comparisons of positive rates and expression levels between AIDP and AMAN patients, and the three differentially expressed proteins had a high accuracy, sensitivity, and specificity in the early diagnosis of GBS.
Hp is an acidic glycoprotein in serum α2 globulin, and its main function is to combine with free hemoglobin into a complex and participate in the re-use of iron. Hp, as an acute-phase protein that can participate in the anti-infection response, damaged tissue repair and stability of internal environment, and can also inhibit bacteria, reduce the synthesis of prostaglandin and regulate the immune function (10,11). The relation between Hp and GBS may be that Hp regulates Thl/Th2 balance by inhibiting phytohemagglutinin-mediated lymphocyte transformation pathway (12). Hsp70 is the most conserved repair protein in biological evolution. Hsp70 plays an important role in autoimmune diseases by participating in the dendritic cell antigen presentation and macrophage phagocytosis via molecular chaperone (13). Cystatin C is a non-glycosylated basic protein, mainly distributed in the extracellular fluid. The concentration of cystatin C was the highest in CSF and lowest in urine, which is involved in the regulation of endogenous or exogenous cysteine activity (14). Studies have shown that cystatin C is significantly reduced in amyloid angiopathy (15) and is closely associated with neurodegenerative diseases, such as vascular dementia and Alzheimer's disease (16). GBS cystatin C expression is significantly lower in GBS (17), which is consistent with the main symptoms of GBS, such as paralysis and sensory disturbances.
The innovations of this study are that the differentially expressed proteins were screened via proteomics analysis followed by analysis of expression differences in GBS. The accuracy, sensitivity, and specificity of Hp and cystatin C in the diagnosis of GBS were further verified to provide an important reference basis for early diagnosis, clinical intervention, and prognosis evaluation of GBS.
Competing interests
The authors declare that they have no competing interests.
References
- 1.Davidson AI, Halstead SK, Goodfellow JA, Chavada G, Mallik A, Overell J, Lunn MP, McConnachie A, van Doorn P, Willison HJ. Inhibition of complement in Guillain-Barré syndrome: The ICA-GBS study. J Peripher Nerv Syst. 2017;1:4–12. doi: 10.1111/jns.12194. [DOI] [PubMed] [Google Scholar]
- 2.Uncini A, Shahrizaila N, Kuwabara S. Zika virus infection and Guillain-Barré syndrome: A review focused on clinical and electrophysiological subtypes. J Neurol Neurosurg Psychiatry. 2017;88:266–271. doi: 10.1136/jnnp-2016-314310. [DOI] [PubMed] [Google Scholar]
- 3.Hughes RA, Brassington R, Gunn AA, van Doorn PA. Corticosteroids for Guillain-Barré syndrome. Cochrane Database Syst Rev. 2016;10:CD001446. doi: 10.1002/14651858.CD001446.pub5. [DOI] [PMC free article] [PubMed] [Google Scholar]
- 4.Ding Y, Han R, Jiang W, Xiao J, Liu H, Chen X, Li X, Hao J. Programmed death ligand 1 plays a neuroprotective role in experimental autoimmune neuritis by controlling peripheral nervous system inflammation of rats. J Immunol. 2016;197:3831–3840. doi: 10.4049/jimmunol.1601083. [DOI] [PubMed] [Google Scholar]
- 5.Halstead SK, Kalna G, Islam MB, Jahan I, Mohammad QD, Jacobs BC, Endtz HP, Islam Z, Willison HJ. Microarray screening of Guillain-Barré syndrome sera for antibodies to glycolipid complexes. Neurol Neuroimmunol Neuroinflamm. 2016;3:e284. doi: 10.1212/NXI.0000000000000284. [DOI] [PMC free article] [PubMed] [Google Scholar]
- 6.Heywood WE, Baud A, Bliss E, Sirka E, Schott JM, Zetterberg H, Galimberti D, Sebire NJ, Mills K. A high throughput, multiplexed and targeted proteomic CSF assay to quantify neurodegenerative biomarkers and apolipoprotein E isoforms status. J Vis Exp. 2016;116:1156–1157. doi: 10.3791/54541. [DOI] [PMC free article] [PubMed] [Google Scholar]
- 7.Štěpánová S, Kašička V. Analysis of proteins and peptides by electromigration methods in microchips. J Sep Sci. 2017;40:228–250. doi: 10.1002/jssc.201600962. [DOI] [PubMed] [Google Scholar]
- 8.Goldman AS, Schmalstieg EJ, Dreyer CF, Schmalstieg FC, Jr, Goldman DA. Franklin Delano Roosevelt's (FDR's) (1882–1945) 1921 neurological disease revisited; the most likely diagnosis remains Guillain-Barré syndrome. J Med Biogr. 2016;24:452–459. doi: 10.1177/0967772015605738. [DOI] [PubMed] [Google Scholar]
- 9.Papathanasiou A, Markakis I. Clinical heterogeneity of Guillain-Barré syndrome in the emergency department: Impact on clinical outcome. Case Rep Emerg Med. 2016;2016:4981274. doi: 10.1155/2016/4981274. [DOI] [PMC free article] [PubMed] [Google Scholar]
- 10.Zhang HL, Zhang XM, Mao XJ, Deng H, Li HF, Press R, Fredrikson S, Zhu J. Altered cerebrospinal fluid index of prealbumin, fibrinogen, and haptoglobin in patients with Guillain-Barré syndrome and chronic inflammatory demyelinating polyneuropathy. Acta Neurol Scand. 2012;125:129–135. doi: 10.1111/j.1600-0404.2011.01511.x. [DOI] [PubMed] [Google Scholar]
- 11.Chang KH, Lyu RK, Tseng MY, Ro LS, Wu YR, Chang HS, Hsu WC, Kuo HC, Huang CC, Chu CC, et al. Elevated haptoglobin level of cerebrospinal fluid in Guillain-Barré syndrome revealed by proteomics analysis. Proteomics Clin Appl. 2007;1:467–475. doi: 10.1002/prca.200600949. [DOI] [PubMed] [Google Scholar]
- 12.Jin T, Hu LS, Chang M, Wu J, Winblad B, Zhu J. Proteomic identification of potential protein markers in cerebrospinal fluid of GBS patients. Eur J Neurol. 2007;14:563–568. doi: 10.1111/j.1468-1331.2007.01761.x. [DOI] [PubMed] [Google Scholar]
- 13.Romi F, Helgeland G, Gilhus NE. Heat-shock proteins in clinical neurology. Eur Neurol. 2011;66:65–69. doi: 10.1159/000329373. [DOI] [PubMed] [Google Scholar]
- 14.Brettschneider J, Petzold A, Süssmuth S, Tumani H. Cere-brospinal fluid biomarkers in Guillain-Barré syndrome - where do we stand? J Neurol. 2009;256:3–12. doi: 10.1007/s00415-009-0097-x. [DOI] [PubMed] [Google Scholar]
- 15.Snorradottir AO, Isaksson HJ, Kaeser SA, Skodras AA, Olafsson E, Palsdottir A, Bragason BT. Deposition of collagen IV and aggrecan in leptomeningeal arteries of hereditary brain haemorrhage with amyloidosis. Brain Res. 2013;1535:106–114. doi: 10.1016/j.brainres.2013.08.029. [DOI] [PubMed] [Google Scholar]
- 16.Kaur G, Levy E. Cystatin C in Alzheimer's disease. Front Mol Neurosci. 2012;5:79. doi: 10.3389/fnmol.2012.00079. [DOI] [PMC free article] [PubMed] [Google Scholar]
- 17.Yang Y, Liu S, Qin Z, Cui Y, Qin Y, Bai S. Alteration of cystatin C levels in cerebrospinal fluid of patients with Guillain-Barré Syndrome by a proteomical approach. Mol Biol Rep. 2009;36:677–682. doi: 10.1007/s11033-008-9228-1. [DOI] [PubMed] [Google Scholar]


