Abstract
For more than 25 years, FlyBase (flybase.org) has served as an online database of biological information on the genus Drosophila, concentrating on the model organism D. melanogaster. Traditionally, FlyBase data have been organized and presented at a gene-by-gene level, which remains a useful perspective when the object of interest is a specific gene or gene product. However, in the modern era of a fully sequenced genome and an increasingly characterized proteome, it is often desirable to compile and analyze lists of genes related by a common function. This may be achieved in FlyBase by searching for genes annotated with relevant Gene Ontology (GO) terms and/or protein domain data. In addition, FlyBase provides preassembled lists of functionally related D. melanogaster genes within “Gene Group” reports. These are compiled manually from the published literature or expert databases and greatly facilitate access to, and analysis of, established gene sets. This chapter describes protocols to produce lists of functionally related genes in FlyBase using GO annotations, protein domain data and the Gene Groups resource, and provides guidance and advice for their further analysis and processing.
Keywords: FlyBase, Drosophila, D. melanogaster, database, functionally related genes, Gene Ontology, protein domain, gene group
1. Introduction
FlyBase gathers genetic, genomic, and functional information on Drosophila by manual curation of the research literature and computational incorporation of data from relevant sources [1, 2]. Data are partitioned into separate classes (e.g., gene, transcript, allele) to enable entity-specific searching and display, with much of the data being presented on individual gene reports on the website. While this approach has many benefits, it is often desirable to search for and view groups of genes whose products are related in some way, such as their known or predicted function. For example, a list of functionally related genes may provide the starting point for a genetic/molecular screen, or be the basis for in silico analyses using associated data (phenotypes, reagents, genomic data, etc.), or allow comparison with equivalent gene sets in other species. FlyBase provides three main ways to search for functionally related Drosophila genes: via Gene Ontology (GO) annotations, protein domain information, and our Gene Group resource.
The GO is a widely used controlled vocabulary aimed at labeling gene products with biological attributes [3]. It is divided into three aspects: “Molecular Function” describes the molecular activity being carried out—for example, protein kinase activity or ubiquitin-protein transferase activity; “Biological Process” describes the context in which the gene product acts—for example, protein ubiquitination or Wnt signaling pathway; and “Cellular Component” describes where it acts—either a subcellular region, such as the cytosol, or a macromolecular complex, such as the anaphase-promoting complex. The GO is arranged in a hierarchical structure, with more specific child terms nested under higher-level parent terms. For example, “protein kinase activity” is a child of “kinase activity.”
GO annotations may be added manually by a curator based either on experimental data in published research (e.g., direct assay, genetic interaction) or from predictions/assertions based on sequence, such as similarity to a characterized gene. Alternatively, GO annotations may be added computationally via automated [4] or curator-reviewed pipelines [5]. This combinatorial approach results in good coverage of GO annotation data over the D. melanogaster genome: 73% of sequence-localized genes and 88% of protein-coding genes have associated GO terms (FlyBase release FB2017_02).
The intimate relationship between structure and function can be exploited to find genes encoding proteins with particular functional attributes. For example, the BAR (Bin-Amphiphysin-Rvs)-domain is characteristic of proteins involved in promoting membrane curvature in intracellular trafficking, while proteins containing an RNA recognition motif (RRM) are associated with single-stranded RNA binding. Thus the possession of common motifs or domains can be used as a handle to search and retrieve protein-coding genes of shared function. In FlyBase, protein-coding genes are linked to UniProtKB accessions, and this relationship is used to associate these genes with domain data from InterPro [4]. InterPro aggregates data from many sources to produce integrated protein signatures classified as domains, families, repeats, and sites. (InterPro uses the “signature” to describe these collective terms, but in this text InterPro domain and signature should be considered interchangeable.) Thus, in contrast to GO data, protein domain annotations are derived entirely computationally and are applied to all protein-coding genes in an unbiased fashion. InterPro domains are associated with 82% of D. melanogaster protein-coding genes (FB2017_02).
Despite the strengths of using GO and/or protein domain annotations to identify functionally related genes, these approaches are not always straightforward or even appropriate. Take, for example, the seemingly simple query: “which genes encode the general transcription factors of D. melanogaster?” These genes are not defined by a single GO term; combinatorial queries using advanced tools may find candidates, but the accuracy of the results would depend on an in-depth knowledge of the GO and the subject area, and would be limited by annotation coverage. Similarly, a protein domain query is unsuited to this task as the individual subunits do not share a common sequence motif. Ultimately, many familiar functional grouping terms used within the scientific literature and research community fall beyond the scope of the GO and/or cannot be defined by protein domains.
The FlyBase “Gene Group” resource was established to fill this gap, allowing users to easily access lists of functionally related D. melanogaster genes [6]. Gene Groups are manually curated based on published research papers, reviews, and online databases. The resource includes genes whose products share a function based on their evolutionary history (gene families, e.g., actins, odorant receptors), contribution to a macromolecular complex (e.g., ribosome or proteasome subunits), or a common molecular function (e.g., deubiquitinases or tRNAs). Gene Groups are arranged in a hierarchical fashion to allow users to drill-down to specific subsets. For example, the “protein kinase” group is divided into 11 main subgroups, which are further sub-divided. In contrast to GO or protein domain data, there is no automated compilation pipeline for Gene Groups—this ensures their integrity and utility, though limits their number and genome coverage. The Gene Groups resource currently comprises over 612 groups (FB2017_02), covering over 21% of all sequence-localized genes and 24% of protein-coding genes. Many areas of biology have been covered in depth, such as intracellular transport, autophagy and cytoskeletal groups (Table 1).
Table 1. An overview of the Gene Groups in FlyBase release FB2017_02.
To provide a summary, the Gene Groups have been divided into major biological themes. The number of genes for each theme is shown, together with a small selection of example Gene Groups. Note, as some genes belong to more than one group, the number of genes for each theme does not represent the number of unique genes. There are 3789 unique genes within the Gene Group collection (FB2017_02).
| Themes | Number of Genes/Theme | Example Gene Groups |
|---|---|---|
|
| ||
| Gene Expression | 1227 | GENERAL TRANSCRIPTION FACTORS |
| RIBOSOMAL PROTEINS | ||
| SPLICEOSOMAL COMPLEXES | ||
| TRANSFER RNAS | ||
| TRANSLATION FACTORS | ||
|
| ||
| Post-Translational Modification | 919 | PROTEIN KINASES |
| PROTEIN PHOSOPHATASES | ||
| RING FINGER DOMAIN PROTEINS | ||
| UBIQUITINATION ENZYMES | ||
|
| ||
| Receptor & Receptor Signaling | 395 | CHEMORECEPTORS |
| G PROTEIN COUPLED RECEPTORS | ||
| NEUROPEPTIDES | ||
| ODORANT BINDING PROTEINS | ||
|
| ||
| Metabolism | 404 | GLUTATHIONE S-TRANSFERASES |
| OXIDATIVE PHOSPHORYLATION COMPLEXES | ||
| PROTEASOME SUBUNITS | ||
|
| ||
| Transmembrane Transport | 326 | ATP-BINDING CASSETTE TRANSPORTER-LIKE |
| ION CHANNELS | ||
| NUCLEAR PORE COMPLEX | ||
| VACUOLAR ATPASE SUBUNITS | ||
|
| ||
| Intracellular Transport | 217 | BLOC COMPLEXES |
| INTRACELLULAR TRANSPORT GROUPS | ||
| SNAREs | ||
| TETHERING FACTORS | ||
|
| ||
| Small GTPase Signaling | 201 | RAS GTPASE SUPERAMILY |
| RAS SUPERFAMILY GAPs | ||
| RAS SUPERFAMILY GEFs | ||
|
| ||
| Chromatin Organization | 191 | CHROMATIN MODIFYING COMPLEXES |
| CHROMATIN REMODELING COMPLEXES | ||
| POLYCOMB GROUP COMPLEXES | ||
| SMC COMPLEXES | ||
|
| ||
| Cytoskeletal | 180 | ACTINS |
| DYNEIN SUBUNITS | ||
| KINESINS | ||
| MYOSINS | ||
| TUBULINS | ||
|
| ||
| Cell-Cell Communication & Adhesion | 86 | BEAT, SIDE FAMILIES |
| CADHERINS | ||
| INTEGRINS | ||
|
| ||
| Apoptosis & Autophagy | 52 | AUTOPHAGY-RELATED COMPLEXES |
| AUTOPHAGY-RELATED GENES | ||
| CASPASES | ||
|
| ||
| Cell Cycle | 30 | ANAPHASE-PROMOTING COMPLEX |
| CHROMOSOMAL PASSENGER COMPLEX | ||
| ORIGIN RECOGNITION COMPLEX | ||
|
| ||
| Immunity | 30 | DROSOMYCINS |
| NIMROD GENES | ||
| PEPTIDOGLYCAN RECOGNITION PROTEINS | ||
|
| ||
| Other | 108 | HEAT SHOCK PROTEINS |
| TETRASPANINS | ||
In this chapter, we provide step-by-step protocols to find functionally related D. melanogaster genes in FlyBase using GO annotations, protein domain information and the Gene Groups resource. We also describe methods to build combinatorial queries in order to retrieve sets of genes satisfying multiple conditions, and to download gene lists for further analysis/processing. Finally, we discuss the relative merits of the three main approaches described herein, including guidance on which approach to use in different situations (see Notes 1–4).
2. Methods
2.1 Using the GO to Find Functionally Related Genes
A list of genes annotated with a particular GO term, or any of the children of that term, can be obtained via a Term Report page. Term Reports themselves can be queried/accessed by either of two FlyBase search tools: QuickSearch or Vocabularies. QuickSearch is located in the center of the FlyBase homepage and allows rapid querying of almost all data in FlyBase via a tabbed interface [7]. In each QuickSearch tab, a link to specific documentation is provided via the question mark icon. Additionally, YouTube video tutorials are available for many data types, including the GO. These can be accessed by clicking the YouTube icon, where present, after selecting the relevant QuickSearch tab. Vocabularies is a dedicated tool for browsing and searching all the controlled vocabularies used in FlyBase to annotate data with standardized terms [8]. Additional documentation is shown in the section at the foot of the Vocabularies page, which includes a link to a YouTube video tutorial.
2.1.1 Searching the GO Using QuickSearch
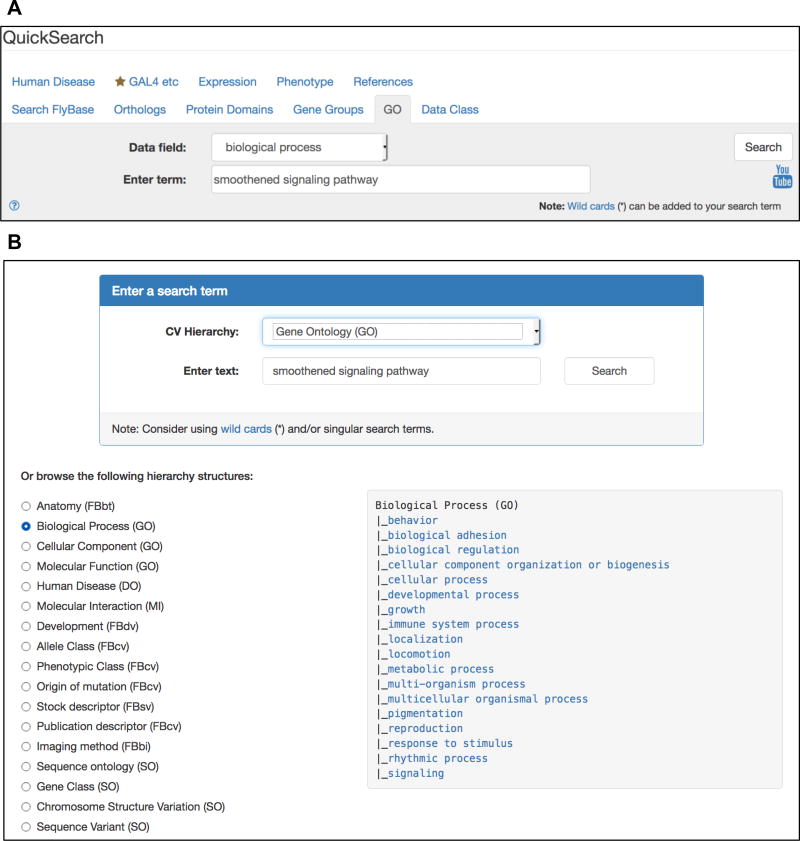
From the FlyBase homepage, click on the QuickSearch “GO” tab. Alternatively, from any FlyBase page, click on the “Tools” menu from the Navigation Bar (NavBar) and select “Query Tools and Portals,” then “QuickSearch.” Either route takes you to the “QuickSearch Search Page” (Fig. 1a).
From the “Data Field” drop-down menu select “all GO terms,” or chose “molecular function,” “biological process,” or “cellular component,” to restrict the search to a particular aspect of the GO. Type your query into the “Enter term” field. Valid entries are GO terms, synonyms (e.g., “smoothened signaling pathway,” “hedgehog signaling pathway”), or GO identifiers (e.g., “GO:0007224”). GO terms that match the entered text appear in a drop-down list when typing and can be clicked to populate the field. The search is case-insensitive and a wildcard (*) can be added to search for matches to partial terms.
Click the “Search” button or press “enter.” This takes you to a hit-list of “Matching CV terms” listing similar terms.
From this list, select a term by clicking on it—choosing a general, high-level term is a good starting point; more specific terms may be selected in subsequent steps. This takes you to a Term Report page for this GO term—see Subheading 2.1.3 for details.
Fig. 1.
(a) The Gene Ontology (GO) tab of the QuickSearch tool. (b) The Vocabularies tool page, which offers two search options: a search term box (top) and a browsing window to select top-level GO terms (bottom).
2.1.2 Searching the GO Using Vocabularies
From the FlyBase homepage, click on the “Vocabularies” icon located near the top of the page. Alternatively, from any FlyBase page, click on the “Tools” menu from the Navigation Bar (NavBar) and select “Query Tools and Portals,” then “Vocabularies.” Either route takes you to the “Vocabularies Search Page” (Fig. 1b).
-
Select “Gene Ontology (GO)” from the drop-down menu under “CV Hierarchy” to restrict the search to GO terms. Type your query into the “Enter text” field. Valid entries are GO terms/synonyms or GO identifiers. GO terms that match the entered text appear in a drop-down list when typing and can be clicked to populate the field. The search is case-insensitive and a wildcard (*) can be added to search for matches to partial terms.
(Alternatively, select an aspect of the GO from the “Or browse the following hierarchy structures” section. Selected top-level GO terms will be displayed in the right-hand panel (Fig. 1b). As in step 4, clicking on a GO term will open its Term Report.)
Click the “Search” button or press “enter.” This takes you to a hit-list of “Matching CV terms” listing similar terms.
Clicking on a GO term name opens its Term Report—see Subheading 2.1.3 for details.
2.1.3 Viewing GO Annotations in a Term Report and Hit-List
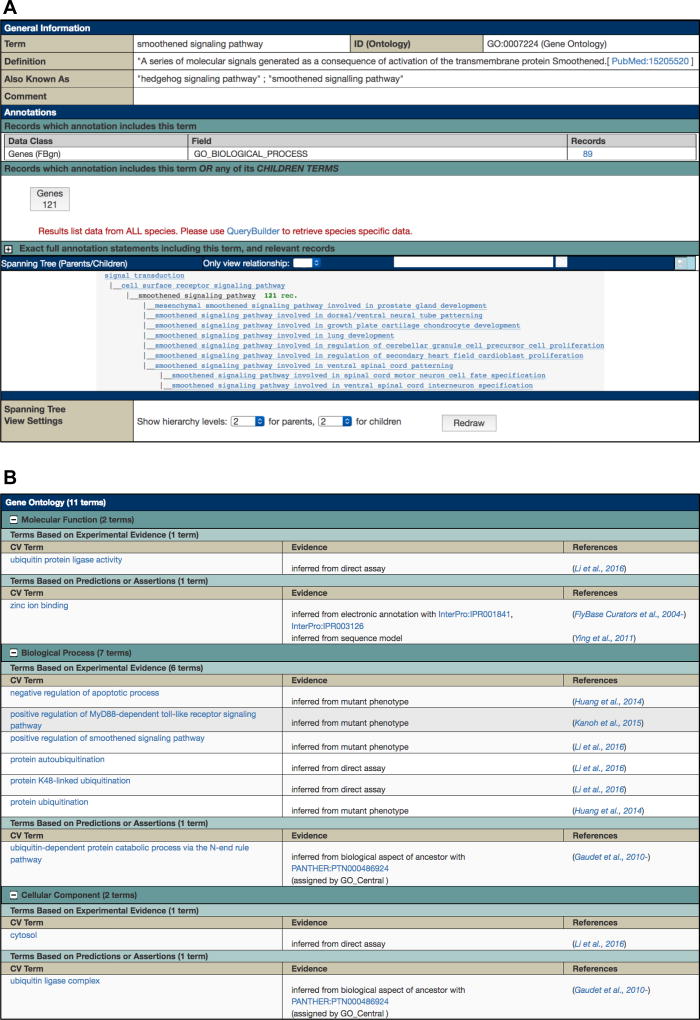
A Term Report (Fig. 2a) displays information and data associated with a controlled vocabulary term and is the destination page for GO queries via the QuickSearch or Vocabularies tools. The “General Information” section at the top contains the term name, ID, definition, and synonyms. Further down the report, the GO hierarchy is shown in a tree view, centered on the chosen term. The number of genes associated with each term and its children is displayed to the right-hand side of each term name. (Where no number is shown, there are no annotations to this term.) Below the tree, a “Spanning Tree View Settings” panel allows the user to adjust the number of levels shown for parents and children. Clicking on a term name within the tree generates the corresponding Term Report.
Fig. 2.
(a) A GO Term report, using the term “smoothened signaling pathway” as an example. (b) The GO section of a Gene report. The gene Ubr3 is shown here as an example.
The “Annotations” section of the Term Report shows two relevant numbers. The first, displayed in a table under the “Records” column, is the number of genes annotated with the exact GO term only. The second, shown in a prominent box, is the number of genes annotated with the GO term or its children, which is usually what is desired. Clicking on either number returns those genes in the form of a hit-list, representing the list of Drosophila genes that are related to each other by virtue of sharing a common GO annotation. FlyBase hit-lists can be sorted, analyzed or exported in several ways—see Subheadings 2.4 and 2.5.
Clicking on an individual gene in a hit-list takes the user to the corresponding Gene report. Here, all GO annotations associated with the specified gene are displayed within the “Gene Ontology (GO)” section (Fig. 2b). Clicking on a GO term within this section takes the user to the corresponding Term Report, thus providing an alternative route to generate a list of genes annotated with a particular GO term and its children.
2.2 Using Protein Domain Data to Find Functionally Related Genes
A list of D. melanogaster genes whose product(s) contain a specified protein domain (as defined by InterPro signatures) can be obtained by using the “Protein Domains” tab of the QuickSearch tool. Additional documentation may be obtained by clicking the question mark within the interface.
2.2.1 Searching Protein Domains Using QuickSearch
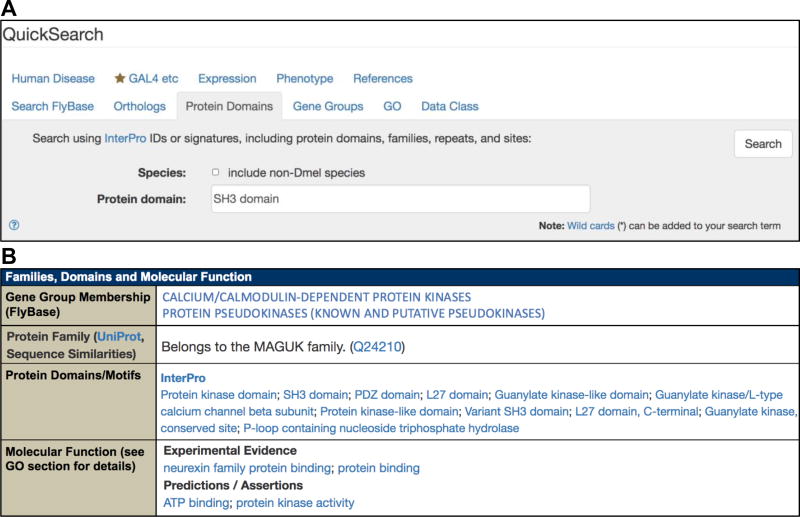
From the FlyBase homepage, click on the QuickSearch “Protein Domains” tab (Fig. 3a). Leave the ‘Species’ box unchecked to restrict the query to D. melanogaster.
Type your query into the search box. Valid entries are InterPro terms (e.g., “SH3 domain” or “WD40 repeat”) or InterPro identifiers (e.g., IPR001452). InterPro signatures that match the entered text appear in a drop-down list when typing and can be clicked to populate the field. The search is case-insensitive and a wildcard (*) can be added to search for matches to partial terms.
Click the “Search” button or press “enter.” Genes that match the query are displayed in a hit-list, representing the list of D. melanogaster genes that are related to each other by virtue of sharing a common protein domain. FlyBase hit-lists can be sorted, analyzed or exported in several ways—see Subheadings 2.4 and 2.5.
Clicking on an individual gene in a hit-list takes the user to the corresponding Gene report. Here all InterPro signatures associated with the gene are displayed in the “Protein Domains/ Motifs” subsection of the “Families, Domains and Molecular Function” section (Fig. 3b), as well as the “Polypeptide Data” subsection of the “Gene Model and Products” section (not shown). Clicking on a signature term takes the user to the corresponding page at InterPro, which contains detailed information on the domain.
Fig. 3.
(a) The Protein Domains tab of the QuickSearch tool. (b) The “Families and Domains and Molecular Function” section of a Gene report, which includes information on protein domains and Gene Group membership. The gene CASK is shown as an example.
2.3 Using Gene Groups to Find Functionally Related genes
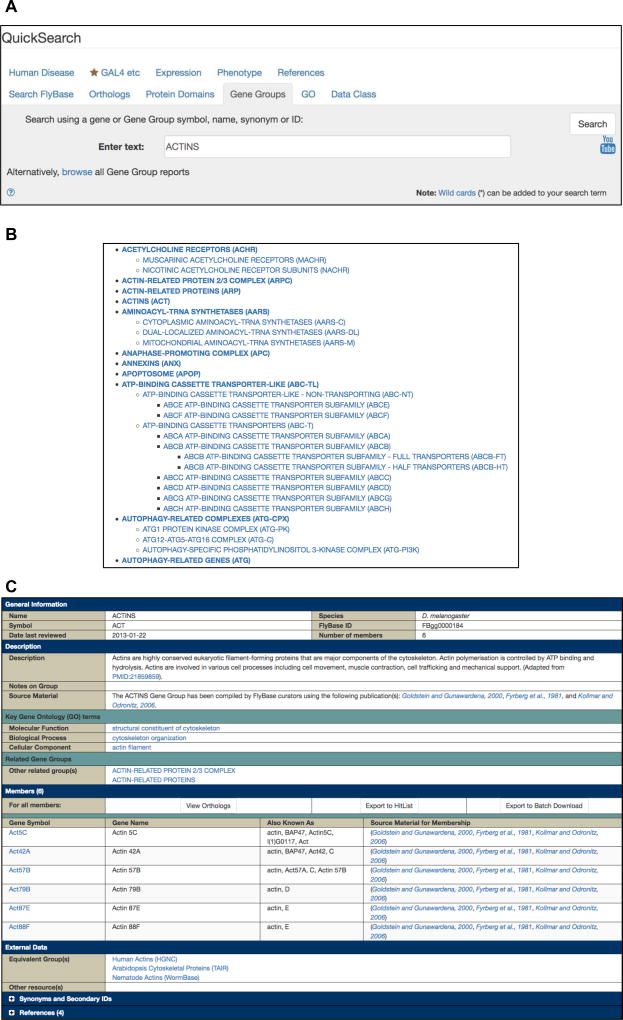
A list of D. melanogaster genes contained within a manually curated Gene Group can be obtained by using the “Gene Groups” tab of the QuickSearch tool (Fig. 4a). The “browse” link can be used to view all current Gene Groups as a nested hierarchy, where a specific group can be selected by clicking on it (Fig. 4b). Alternatively, Gene Groups may be queried using the protocol described below. Additional documentation may be obtained by clicking the question mark or the YouTube icon within the interface. Note that the gene lists available via the Gene Groups resource are “ready-to-use” and presented within dedicated report pages, and as such differ from gene lists resulting from GO or protein domain searches that are generated “on-the-fly” from gene-associated annotation data.
Fig. 4.
(a) The Gene Groups tab of the QuickSearch tool. (b) Gene Groups are available as a browsable list. Groups are displayed as a nested hierarchy, with the top-level groups arranged in alphabetical order. The top section of the list is shown from ACETYLCHOLINE RECEPTORS to AUTOPHAGY-RELATED GENES. (c) A Gene Group report, using the ACTINS Gene Group as an example.
2.3.1 Searching Gene Groups Using QuickSearch
From the FlyBase homepage, click on the QuickSearch “Gene Groups” tab (Fig. 4a).
Type your query into the “Enter text” field. Valid entries are Gene Group names/symbols, synonyms or identifiers (e.g., ACTINS, FBgg0000184), or the symbols/names, synonyms, or identifiers of any member genes (e.g., Act42A, CG12051, FBgn0000043). Gene Group names that match the entered text appear in a drop-down list when typing and can be clicked to populate the field. The search is case-insensitive and a wildcard (*) can be added to search for matches to partial terms.
Click the “Search” button or press “enter.” Groups that match the query are displayed in a hit-list.
Click on a Gene Group to open the corresponding Gene Group report page.
2.3.2 Viewing Gene Lists in Gene Group Reports
Gene Group reports contain the list of member genes together with additional information organized into sections (Fig. 4c) [6]. The “Description” section gives an important overview of the criteria used to compile a particular group, and the “Notes on Group” field may contain justification for the inclusion or exclusion of particular genes. This section also displays “Key Gene Ontology (GO) terms”—these terms, or their children, are associated with most/ all of the member genes and are typical, though not necessarily diagnostic, of that group. Clicking on a key GO term takes the user to a Term Report, where other genes annotated with this term or its children can be found (see Subheading 2.1.3).
Gene Groups are constructed in a hierarchical fashion, with only the terminal groups populated with genes. The “Related Gene Groups” subsection displays the groups immediately above or below the group (called “Parent group(s)” or “Component group(s),” respectively) and clicking on these links displays the corresponding Gene Group page. Any nonhierarchical but functionally relevant relationships (e.g., receptor–ligand groups such as Frizzled-type receptors and Wnts) are displayed as “Other related group(s).”
The “Members” section contains all genes belonging to the group (displayed under their terminal group heading) with gene symbols hyperlinked to their Gene report page (where Gene Group membership is displayed in the “Families, Domains and Molecular Function” section (Fig. 3b), thereby providing an alternative entry into Gene Group reports). The attribution for membership of an individual gene to a particular group is shown in the “Source Material for Membership” column of the table. At the top of the “Members” table are three export buttons, provided to facilitate further analysis of the group. The “View Orthologs” button runs the gene list through the “QuickSearch-Orthologs” tab [1] to retrieve the predicted orthologs of each D. melanogaster gene in humans and model organisms, powered by the DRSC Integrative Ortholog Prediction Tool (DIOPT) [9]. The “Export to HitList” and “Export to Batch Download” buttons export the genes in the members table to these tools for further analyses (see Subheadings 2.4 and 2.5).
The “External Data” section of a Gene Group report includes links to equivalent gene collections at other databases to facilitate cross-organism analyses, notably human gene families at the HGNC, which are also manually compiled and verified [10]. Indeed, the reciprocal links that exist between HGNC gene families and FlyBase Gene Groups should be the primary method to compare related gene sets between humans and D. melanogaster, rather than using the “View Orthologs” option described above. Other expert/specialized databases are also listed in the “External Data” section where relevant, for example the Heat Shock Protein Information Resource [11] or the Ribosomal Protein Gene Database [12] for the HEAT SHOCK PROTEINS and RIBOSOMAL PROTEINS Gene Groups, respectively.
2.4 Combinatorial Queries
The methods above describe how to find a set of functionally related Drosophila genes based on a single GO term (and its children), a single protein domain, or a specific Gene Group (and its subgroups). It is sometimes useful to combine searches of multiple terms within or between any one of the three classifications to define a gene set based on additional criteria. For example, the subset of genes from the ION CHANNEL Gene Group that also have GO annotation under “sensory perception” (to identify ion channels known/predicted to be involved in perception of sensory stimuli), or a list of genes annotated with an “EF-hand domain” and the GO term “synaptic signaling” (to identify candidate Ca2+-binding proteins involved in signaling at the synapse). Simple intersections can be achieved using the Analysis tools available from a gene hit-list using protocol in Subheading 2.4.1 below. More complex queries require export of the hit-list to the QueryBuilder tool [8], as described in protocol in Subheading 2.4.2 below. (A detailed description of the use of QueryBuilder is beyond the scope of this chapter—additional information, templates, and examples are available online.)
2.4.1 Hit-List Analysis Tools
Generate an initial hit-list of genes from a GO or protein domain search, or directly from a Gene Group, as described in Subheadings 2.1.3, 2.2.1, and 2.3.2.
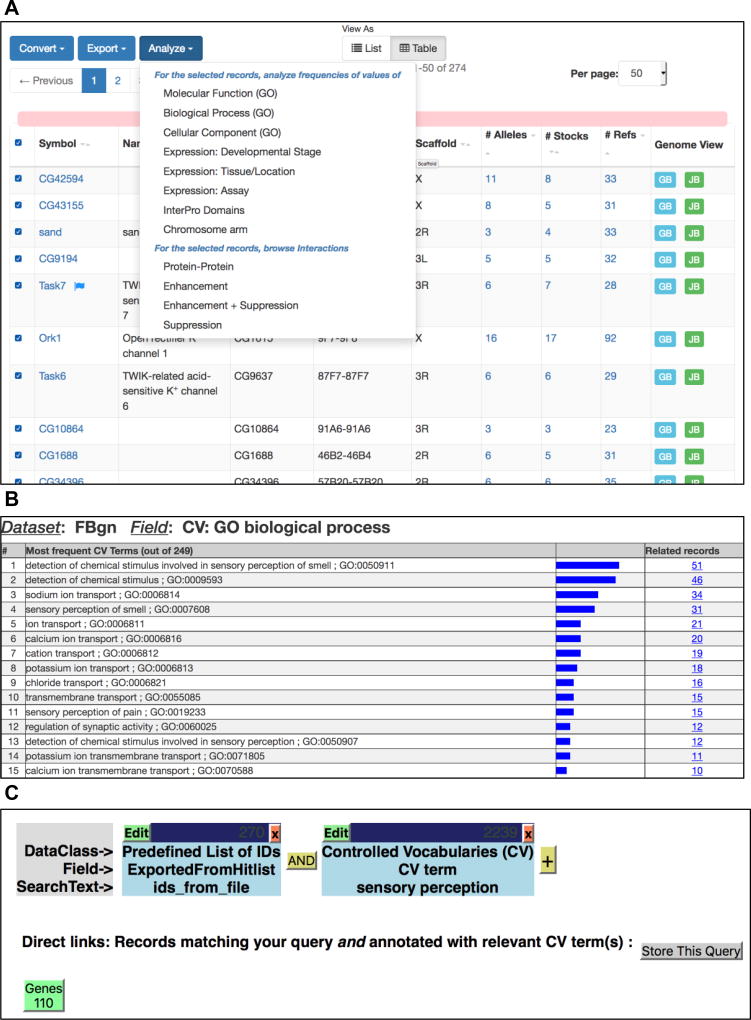
From a hit-list of genes, click on the “Analyze” button (Fig. 5a). From the drop-down menu, select one of “Molecular function (GO),” “Biological Process (GO),” “Cellular Component (GO),” or “InterPro Domains” (Fig. 5a). This generates a second hit-list showing the distribution of the most frequent GO term or protein domain annotations associated with the genes in the first hit-list (Fig. 5b). Note that for GO term refinements, the numbers shown correspond to genes with annotations to that exact term—that is, annotations to more specific child terms are not included in the given counts.
Click on the number in the “Related records” column to produce a third hit-list. This contains the subset of genes from the initial list that are also associated with the additional GO term/protein domain selected in step 1—that is, the intersection of the two criteria.
If desired, repeat the steps above to define finer level intersections of the list.
Fig. 5.
(a) A hit-list of genes. In this example, the hit-list is populated with genes exported from the ION CHANNELS Gene Group. The “Analyze” drop-down menu is shown. (b) A results analysis of individual Biological Process GO terms associated with genes from the ION CHANNELS Gene Group. (Only the top 15 most frequently associated GO terms are shown). (c) A QueryBuilder results page, showing a 2-leg query (top). First query: IDs imported from the ION CHANNELS Gene Group; second query: GO term search for “sensory perception.” A results button, with the number of genes returned from the query, is displayed at the bottom—clicking this generates a new gene hit-list.
2.4.2 QueryBuilder
Generate an initial hit-list of genes from a GO or protein domain search, or directly from a Gene Group, as described in Subheadings 2.1.3, 2.2.1, and 2.3.2.
Click on the “Export” button (Fig. 5a). From the drop-down menu, select “QueryBuilder”.
A new QueryBuilder session appears with the first segment of the query populated with the genes from step 1. Click on the “+” button to add a query segment, then select a data class from the drop-down menu and a specific field/term to query within that class. For example, choose the “Controlled Vocabularies” data class and select a specific GO term, or choose the “Genes” data class and select a term from the InterPro Domains field (Fig. 5c).
Repeat step 3 to include additional query legs.
Combine individual query segments using Boolean operators (AND, OR, BUT NOT) in order to generate lists that combine or exclude the given criteria.
Once the query is assembled, click the “Run query” button.
From the results page (Fig. 5c), click on the “Genes” box to generate a hit-list of genes matching the search criteria.
2.5 Downloading Lists of Functionally Related Genes
The hit-list of genes obtained via one of the approaches described above, together with associated data if desired, can be easily downloaded using the Batch Download tool (Fig. 6). Bulk files listing all FlyBase GO annotations and Gene Group data are also available. Both these options enable further processing/analysis of lists of genes offline or using other web-based tools. Protocols to obtain these files are given below. (Detailed descriptions of the use of Batch Download and the contents of the bulk files are beyond the scope of this article—additional information is available online.)
Fig. 6.
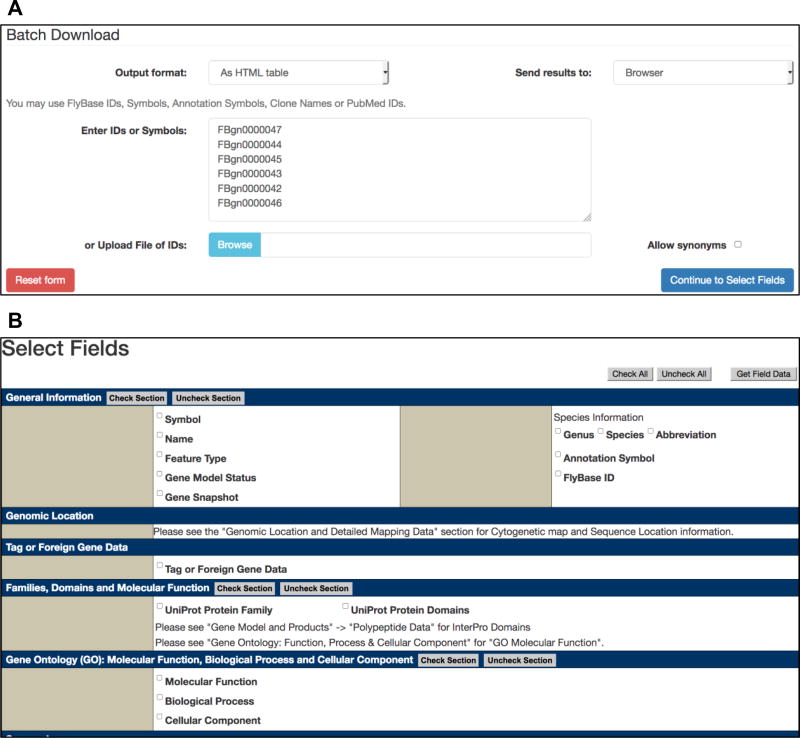
(a) The FlyBase Batch Download interface, using the FlyBase Gene IDs (FBgns) exported from the ACTINS Gene Group as an example. (b) The Batch Download interface for selecting data fields for download (only the top section is shown).
2.5.1 Batch Download
From a gene hit-list, click on the “Export” button (Fig. 5a). From the drop-down menu, select “Batch Download”. Alternatively, from a Gene Group report, simply click the “Export to Batch Download” button at the top of the “Members” table (Fig. 4c).
A new Batch Download session appears with the data entry box populated with the genes from step 1 (Fig. 6a).
Choose the “Output format” as “HTML table” or “tab-separated file” as required. Then choose to “Send results” to “Browser” or “File” as desired.
Click on the “Continue to Select Fields” button to be directed to a template resembling a FlyBase Gene report page and check the boxes corresponding to the data of interest (Fig. 6b). These may be directly relevant to the original search (e.g., gene symbols and synonyms, GO annotations, InterPro domains) or a different type of data (e.g., genomic data, expression data, physical interactions, available reagents) to be analyzed in the context of the given gene list.
Finally, click on the “Get Field Data” button to retrieve the data in the method and format selected in step 3.
2.5.2 Bulk Files
FlyBase bulk files can be accessed from any page by clicking on “Current release” from the “Downloads” menu in the NavBar. For GO data, the “gene_association.fb.gz” file within the “Genes” section contains all GO annotations for D. melanogaster genes within FlyBase in the standardized GO Annotation File (GAF) format.
For Gene Groups data, two files are available within the “Gene Groups” section of the Downloads page. The first (gene_ group_data_fb_*.tsv.gz) includes the symbol, name and ID of every group, any parent/child relationships between groups, and the symbol and ID of all member genes. The second file (gene_groups_HGNC_fb_*.tsv.gz) lists just the groups themselves together with any corresponding HGNC gene family IDs.
3 Notes
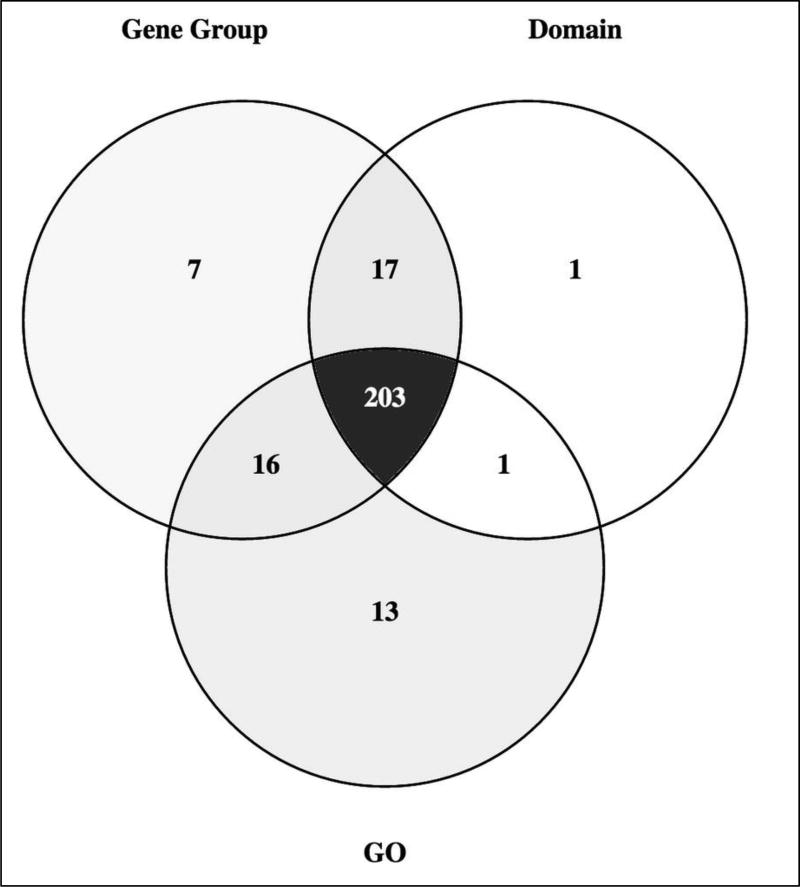
Three distinct, but overlapping, approaches to finding functionally related genes in FlyBase are presented in this chapter and it is important to consider the advantages and limitations of each method. For established and/or evolutionary conserved gene sets, the Gene Groups resource should be the first place to look, benefiting from manual curation from expert sources and supplemented with explanatory notes for edge cases and/or atypical members. However, the genomic coverage of Gene Groups is relatively limited and its scope does not extend to broad biological phenomena or to predicted/ uncharacterized gene sets. Thus, if a list of candidate genes involved in a process/pathway is required or the property sought is not confined to particular protein classes, then querying GO annotations is the most appropriate route, benefitting from high genomic coverage and a high degree of manual verification. Protein domain data are also worth consulting where there is good structure–function correlation: while they are not manually validated, they have a similar genomic coverage as GO annotations and are particularly useful when wanting to cast a wider net. For example, a search for “SH2 domain” retrieves many candidate phosphotyrosine-binding proteins involved in receptor tyrosine-kinase signaling that GO annotation may not capture. Of course, the results of some queries using the three approaches will overlap significantly. For example, the PROTEIN KINASE Gene Group comprises 243 genes, of which 219 are annotated with the GO term “protein kinase activity” or its child terms, and 220 have a “Protein kinase domain” (Fig. 7). In this case, where there is well-defined structure–function relationship, the Gene Group presentation provides the complete and accurate picture and differences in overlap with protein domain signature and GO annotation arise from either sequence divergence or the presence of pseudokinases. Ultimately, the approach taken to identify a group of functionally related genes depends on the details of the query itself and the accuracy/scope required in the answer. It will often be informative to experiment with all three methods, combining or refining the results with additional criteria as necessary.
It is worth noting that a subset of GO annotations in FlyBase are computationally derived from InterPro domain associations via “InterPro2GO” mapping [4, 13], and that GO annotations associated with members of a Gene Group are reviewed and improved during the compilation of a group. Both of these pipelines act to increase the overlap in results obtained when querying using different methods.
For some species (e.g., humans [10]), genes belonging to particular families/groups are given symbols/names with identical prefixes or “root symbols”, meaning that functionally related genes can be retrieved/classified by their nomenclature to some extent. This approach should not be used to identify D. melanogaster gene sets—gene nomenclature is generally not as systematic in this species with many genes given an esoteric symbol/name based on their mutant phenotype. Notable exceptions are genes encoding ncRNAs, whose symbols have a systematic prefix (“tRNA:”, “snoRNA:”, etc.). (See the “Nomenclature” link under the “Help” menu on the NavBar of any FlyBase page.)
The chapter focuses on methods to identify functionally related genes within FlyBase, taking advantage of GO annotations, protein domain associations, and membership of Gene Groups. Of course, there are several other methods, tools, and resources within FlyBase to identify other kinds of “related gene sets” based on these and other criteria. For example, FlyBase compiles sets of genes within experimentally derived datasets, such as protein–protein interaction sets or gene expression clusters, while any number of de novo sets could be constructed based on phenotype, expression, genomic data, etc. The protocols described herein are readily expandable/transferable to encompass a wider scope of data within FlyBase.
Fig. 7.
A Venn diagram showing the overlap between genes annotated with the GO term ‘protein kinase activity’ (GO:0004672) or its child terms, the InterPro term ‘Protein kinase domain’ (IPR000719) and the ‘PROTEIN KINASE’ Gene Group. The diagram was generated using Venny 2.1.
Acknowledgments
FlyBase is funded by the National Human Genome Research Institute at the US National Institutes of Health (#U41HG000739, PI N. Perrimon) and the UK Medical Research Council (#MR/N030117/1, PI N.H. Brown). At the time of writing, the FlyBase Consortium included: Norbert Perrimon, Julie Agapite, Kris Broll, Madeline Crosby, Gilberto dos Santos, David Emmert, Sian Gramates, Kathleen Falls, Beverley Matthews, Susan Russo Gelbart, Christopher Tabone, Pinglei Zhou, Mark Zytkovicz; Nicholas Brown, Giulia Antonazzo, Helen Attrill, Silvie Fexova, Phani Garapati, Tamsin Jones, Aoife Larkin, Steven Marygold, Gillian Millburn, Alix Rey, Vitor Trovisco, Jose-Maria Urbano; Thomas Kaufman, Bryon Czoch, Josh Goodman, Gary Grumbling, Victor Strelets, Jim Thurmond; Richard Cripps, Maggie Werner-Washburne, Phillip Baker.
References
- 1.Gramates LS, Marygold SJ, Santos GD, Urbano JM, Antonazzo G, Matthews BB, Rey AJ, Tabone CJ, Crosby MA, Emmert DB, Falls K, Goodman JL, Hu Y, Ponting L, Schroeder AJ, Strelets VB, Thurmond J, Zhou P, FlyBase Consortium FlyBase at 25: looking to the future. Nucleic Acids Res. 2017;45(D1):D663–D671. doi: 10.1093/nar/gkw1016. https://doi.org/10.1093/nar/gkw1016. [DOI] [PMC free article] [PubMed] [Google Scholar]
- 2.Marygold SJ, Crosby MA, Goodman JL, FlyBase Consortium Using FlyBase, a database of Drosophila genes and genomes. Methods Mol Biol. 2016;1478:1–31. doi: 10.1007/978-1-4939-6371-3_1. https://doi.org/10.1007/978-1-4939-6371-3_1. [DOI] [PMC free article] [PubMed] [Google Scholar]
- 3.The Gene Ontology C. Expansion of the Gene Ontology knowledgebase and resources. Nucleic Acids Res. 2017;45(D1):D331–D338. doi: 10.1093/nar/gkw1108. https://doi.org/10.1093/nar/gkw1108. [DOI] [PMC free article] [PubMed] [Google Scholar]
- 4.Finn RD, Attwood TK, Babbitt PC, Bateman A, Bork P, Bridge AJ, Chang HY, Dosztanyi Z, El-Gebali S, Fraser M, Gough J, Haft D, Holliday GL, Huang H, Huang X, Letunic I, Lopez R, Lu S, Marchler-Bauer A, Mi H, Mistry J, Natale DA, Necci M, Nuka G, Orengo CA, Park Y, Pesseat S, Piovesan D, Potter SC, Rawlings ND, Redaschi N, Richardson L, Rivoire C, Sangrador-Vegas A, Sigrist C, Sillitoe I, Smithers B, Squizzato S, Sutton G, Thanki N, Thomas PD, Tosatto SC, Wu CH, Xenarios I, Yeh LS, Young SY, Mitchell AL. InterPro in 2017-beyond protein family and domain annotations. Nucleic Acids Res. 2017;45(D1):D190–D199. doi: 10.1093/nar/gkw1107. https://doi.org/10.1093/nar/gkw1107. [DOI] [PMC free article] [PubMed] [Google Scholar]
- 5.Gaudet P, Livstone MS, Lewis SE, Thomas PD. Phylogenetic-based propagation of functional annotations within the Gene Ontology consortium. Brief Bioinform. 2011;12(5):449–462. doi: 10.1093/bib/bbr042. https://doi.org/10.1093/bib/bbr042. [DOI] [PMC free article] [PubMed] [Google Scholar]
- 6.Attrill H, Falls K, Goodman JL, Millburn GH, Antonazzo G, Rey AJ, Marygold SJ, FlyBase Consortium FlyBase: establishing a Gene Group resource for Drosophila melanogaster. Nucleic Acids Res. 2016;44(D1):D786–D792. doi: 10.1093/nar/gkv1046. https://doi.org/10.1093/nar/gkv1046. [DOI] [PMC free article] [PubMed] [Google Scholar]
- 7.Marygold SJ, Antonazzo G, Attrill H, Costa M, Crosby MA, Dos Santos G, Goodman JL, Gramates LS, Matthews BB, Rey AJ, Thurmond J, FlyBase Consortium Exploring FlyBase data using QuickSearch. Curr Protoc Bioinformatics. 2016;56(1):31 31–31 31 23. doi: 10.1002/cpbi.19. https://doi.org/10.1002/cpbi.19. [DOI] [PMC free article] [PubMed] [Google Scholar]
- 8.St Pierre SE, Ponting L, Stefancsik R, Mcquilton P, FlyBase Consortium FlyBase 102—advanced approaches to interrogating FlyBase. Nucleic Acids Res. 2014;42(Database issue):D780–D788. doi: 10.1093/nar/gkt1092. https://doi.org/10.1093/nar/gkt1092. [DOI] [PMC free article] [PubMed] [Google Scholar]
- 9.Hu Y, Flockhart I, Vinayagam A, Bergwitz C, Berger B, Perrimon N, Mohr SE. An integrative approach to ortholog prediction for disease-focused and other functional studies. BMC Bioinformatics. 2011;12:357. doi: 10.1186/1471-2105-12-357. https://doi.org/10.1186/1471-2105-12-357. [DOI] [PMC free article] [PubMed] [Google Scholar]
- 10.Yates B, Braschi B, Gray KA, Seal RL, Tweedie S, Bruford EA. Genenames.org: the HGNC and VGNC resources in 2017. Nucleic Acids Res. 2017;45(D1):D619–D625. doi: 10.1093/nar/gkw1033. https://doi.org/10.1093/nar/gkw1033. [DOI] [PMC free article] [PubMed] [Google Scholar]
- 11.Ratheesh Kumar R, Nagarajan NS, PA S, Sinha D, Veedin Rajan VB, Esthaki VK, D'Silva P. HSPIR: a manually annotated heat shock protein information resource. Bioinformatics. 2012;28(21):2853–2855. doi: 10.1093/bioinformatics/bts520. https://doi.org/10.1093/bioinformatics/bts520. [DOI] [PMC free article] [PubMed] [Google Scholar]
- 12.Nakao A, Yoshihama M, Kenmochi N. RPG: the Ribosomal Protein Gene database. Nucleic Acids Res. 2004;32(Database issue):D168–D170. doi: 10.1093/nar/gkh004. https://doi.org/10.1093/nar/gkh004. [DOI] [PMC free article] [PubMed] [Google Scholar]
- 13.Tweedie S, Ashburner M, Falls K, Leyland P, McQuilton P, Marygold S, Millburn G, Osumi-Sutherland D, Schroeder A, Seal R, Zhang H, FlyBase Consortium FlyBase: enhancing Drosophila Gene Ontology annotations. Nucleic Acids Res. 2009;37(Database issue):D555–D559. doi: 10.1093/nar/gkn788. https://doi.org/10.1093/nar/gkn788. [DOI] [PMC free article] [PubMed] [Google Scholar]


