Abstract
Objective
We aimed to describe and compare baseline cerebral blood flow (CBF) and microstructural characteristics of normal-appearing white matter (NAWM) within the vulnerable periventricular white matter hyperintensity (PVWMH) penumbra region in predicting white matter hyperintensity (WMH) growth over time.
Methods
Fifty-two patients, aged 82.8 years, underwent serial brain MRI, including pulsed arterial spin labeling and diffusion tensor imaging (DTI). New WMH and persistent NAWM voxels in relation to WMH penumbra at follow-up were identified. Mean baseline CBF and DTI variables of the new WMH and persistent NAWM voxels were computed. Univariate analyses with paired t tests were performed. Generalized estimating equation analyses were used to compare the relationships of baseline CBF, and structural penumbras with WMH growth, controlling for confounders.
Results
Low baseline CBF and fractional anisotropy, and high mean diffusivity (MD), were independently associated with new PVWMH voxels, with MD being the best predictor of WMH growth. A separate model demonstrated that radial diffusivity had the strongest relationship with WMH growth compared with CBF and axial diffusivity.
Conclusion
CBF and DTI measures independently predict WMH growth over time. DTI is a more sensitive predictor of WMH growth than CBF, with WMH progression likely due to demyelinating injury secondary to low perfusion. Findings support the use of MD as a sensitive marker of NAWM vulnerability in future trials aimed at preserving WM integrity.
White matter hyperintensity (WMH) penumbra is the WM surrounding WMH that appears normal on T2-weighted images. This area demonstrates compromised tissue, albeit to a lesser degree than the lesion itself, representing the earliest stage of WM deterioration associated with WMH growth.1,2 Previous work has shown lower perfusion2,3 and microstructural integrity1,3–8 in the WMH penumbra. Pathologically, WMH is characterized by demyelination, axonal loss, and rarefaction,9 often attributed to ischemia10–13 and associated with arteriolosclerosis.14 In vivo studies of diffusion tensor imaging (DTI) characteristics within the penumbra, including axial diffusivity (AD), reflecting axonal damage, and radial diffusivity (RD), reflecting demyelination,15,16 are limited; these signals may further our understanding of the underlying etiology of early WMH development and its expansion. This is crucial to prevent WMH growth and the subsequent development of cognitive and motor impairment.
Spatially, previous evidence demonstrated that cerebral blood flow (CBF) WMH penumbra extends approximately 13 to 14 mm distal to WM lesions,3 whereas the structural WMH penumbra, as measured by DTI or fluid-attenuated inversion recovery (FLAIR) imaging, exists within 2 to 9 mm,1,3,8 suggesting that decreased CBF may precede microstructural deterioration of normal-appearing white matter (NAWM) tissue. While cross-sectional studies have shown associations between lower CBF and structural integrity within the WMH penumbra, longitudinal studies are lacking.
The aim of this study was to describe and compare baseline CBF and microstructural characteristics of the periventricular WMH (PVWMH) penumbra region as predictors of WMH growth, with the hypothesis that both baseline CBF and DTI are independently predictive of WMH expansion.
Methods
Patients
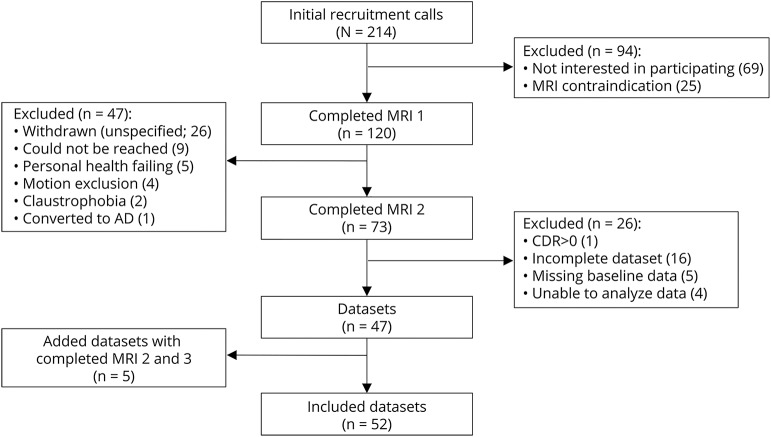
Fifty-two cognitively intact, community-dwelling, elderly patients followed in a Layton Aging and Alzheimer's Disease Center longitudinal aging study were recruited into a study aimed at investigating the etiology of WMH progression using multimodal MRI. Patients' mean baseline age was 82.8 years (table 1). The interscan interval was 17 months, ranging from 7 to 54 months. Inclusion criteria were seniors aged 65 years or older with a score of ≥24 on the Mini-Mental State Examination17 and 0 on the Clinical Dementia Rating scale.18 Exclusion criteria were contraindications to MRI, inability to lie in a supine position for 1.5 hours, and a history of clinical stroke or evidence of cortical stroke on MRI. Figure 1 demonstrates the flowchart of patient recruitment.
Table 1.
Summary of participant characteristics at baseline
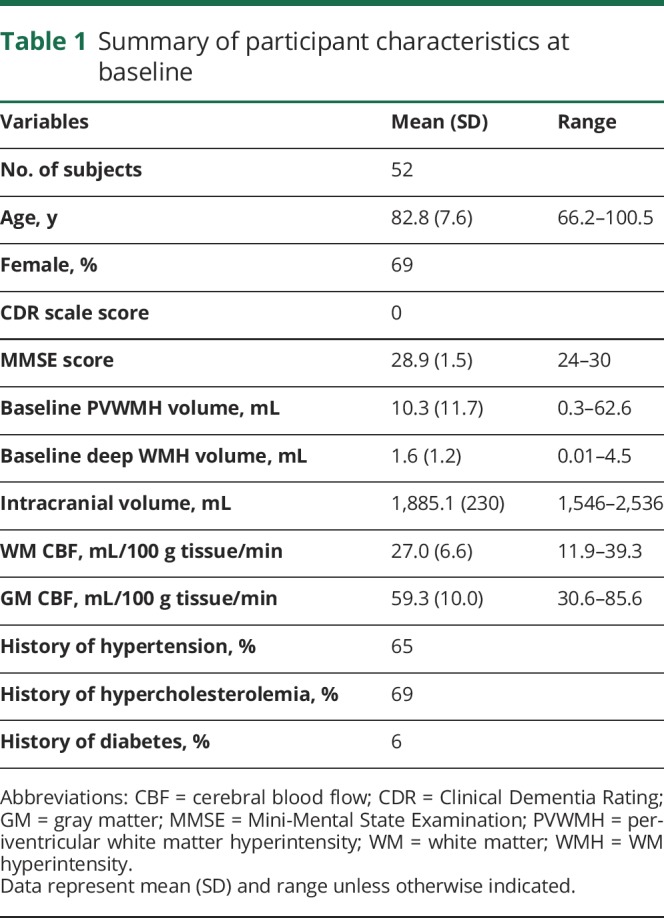
Figure 1. Flowchart of patient recruitment.
AD = Alzheimer disease; CDR = Clinical Dementia Rating.
Standard protocol approvals, registrations, and patient consents
All patients signed written informed consent, and approval from the institutional review board of Oregon Health & Science University was obtained.
Magnetic resonance imaging
Patients received two 3.0-tesla MRI scans (TIM Trio System; Siemens Medical Solutions, Malvern, PA). Pulsed arterial spin labeling (pASL) sequence19 covering the basal ganglia inferiorly through the centrum semiovale superiorly was performed as follows: resolution = 3 × 3 × 4 mm3, 2-mm gap, repetition time (TR) = 3,000 milliseconds (ms), echo time (TE) = 13 ms, time between the inversion pulse and beginning of the periodic saturation pulse train 1 (TI1) = 700 ms, the post-TI periodic saturation stop time (TI1s) = 1,600 ms, and the time between the inversion pulse and the initial echo-planar imaging read pulse (TI2) = 1,800 ms.20 The sequence acquired 240 images per run, a total of 3 runs. Other sequences included DTI: TE = 95 ms, TR = 9,500 ms, resolution = 2 × 2 × 2 mm, 2 averages, and 30 diffusion-weighted directions with b = 1,000 s/mm2; magnetization-prepared rapid-acquisition gradient echo (MPRAGE): TE = 3.4 ms, TR = 2,300 ms, inversion time (TI) = 1,200 ms, field of view = 256 mm, resolution = 1 × 1 × 1 mm; axial 2-dimensional FLAIR: TE = 87 ms, TR = 9,000 ms, TI = 2,500 ms, resolution 0.97 × 0.97 × 2 mm, 95 slices.
Image analysis
To define WMH, a WM-FLAIR intensity histogram was generated and 45% of the maximum intensity was used as a cutoff to separate the WMH and NAWM.2 Each cluster was expanded to fill the edge of the WMH areas. These steps were repeated until the cluster mean reached the lower limit of 2 SDs above the WM mean or until no additional voxels met the threshold. The clusters adjoining with the ventricles were considered PVWMH and all others were identified as deep WMH (DWMH). The WMH clusters were visually examined and manually corrected. For each individual's CBF map, the 3 runs of pASL images were concatenated. We discarded the data with excessive head movement (≥2 mm or 2°). Quantitative CBF was then computed on a voxel basis according to Wang et al.21
Diffusion tensor processing included registering raw DWIs to the B0 images to account for head motion and correcting for eddy-current distortions using FSL. The FSL “dtifit” command22 was used to reconstruct DTI–fractional anisotropy (FA), mean diffusivity (MD), RD, and AD (figure e-1, links.lww.com/WNL/A522).
Creating NAWM layer masks
Each patient's defined WMH on baseline FLAIR image was linearly aligned to the patient's own baseline T1-weighted image. Each NAWM layer mask was dilated away from the WM lesion by 1 voxel for each layer, a total of 5 NAWM layers, where there was substantial growth of WMH over time2 (figure 2; figure e-2, links.lww.com/WNL/A522). The gray matter and ventricular masks were dilated by 2 voxels and subtracted from the NAWM layers.
Figure 2. NAWM layer masks.
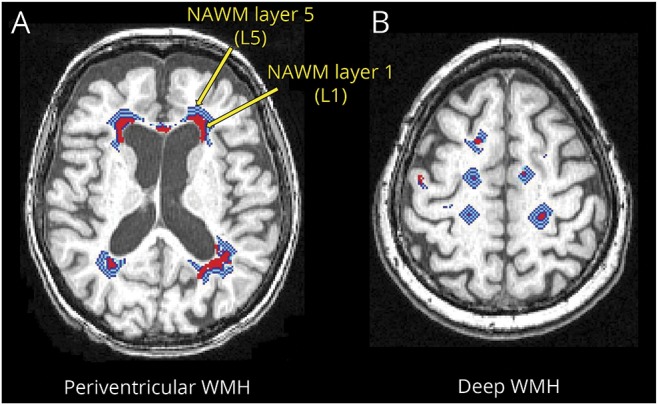
Red areas represent WMH. The light blue, blue, and white layers represent NAWM layer masks for (A) periventricular WMH and (B) deep WMH. The innermost layer adjoining WMH is NAWM layer 1 and the outermost layer away from the WMH is NAWM layer 5. NAWM = normal-appearing white matter; WMH = white matter hyperintensity.
Defining new WMH and persistent NAWM voxels
Each individual's follow-up FLAIR image was linearly aligned to their baseline FLAIR image. The voxels that were NAWM at baseline but within the WMH mask at follow-up, “new WMH” voxels, and voxels that were NAWM at baseline and at follow-up, “persistent NAWM” voxels, were defined. The baseline NAWM layer mask was then applied to the aligned FLAIR images. The NAWM layer mask with defined new WMH and persistent NAWM voxels for each individual patient was applied to the pASL-CBF and DTI maps, which were previously linearly aligned to their T1-weighted image and resampled to 1 × 1 × 1 mm. Each individual patient's mean baseline arterial spin labeling (ASL)-CBF and DTI variables of new WMH and persistent NAWM voxels of each layer were calculated for PVWMH and DWMH separately.
Statistical analysis
The analyses were performed using SPSS software (version 20; IBM Corp., Armonk, NY), SAS (version 9.3; SAS Institute, Cary, NC), and R (version 2.11, R Foundation). Paired t tests were used to examine relationships between baseline MRI variables and WMH growth over time by comparing mean baseline MRI data of new WMH voxels with that of persistent NAWM voxels, utilizing the mean baseline values of the inner 5 NAWM layers for each MRI variable. Generalized estimating equation (GEE) models were used to examine CBF and DTI composite scores of FA or MD in order to compare their association with WMH growth. Outcome is a dummy variable indicating new WMH voxels (coded as 1) and persistent NAWM voxels (coded as 0). We included FA or MD at baseline one at a time with baseline pASL-CBF, controlling for age and sex. We did not include FA and MD together in the same model since they were highly correlated with each other. A separate GEE model evaluated the underlying etiology of WMH growth by including CBF, RD (DTI indicator of demyelination), and AD (DTI indicator of axonal integrity), adjusted for age and sex. Statistical significance was set at p < 0.05 because of small sample size in the current study.
Data availability
Anonymized data will be shared by request from any qualified investigator for purposes of replicating procedures and results.
Results
At baseline, all patients had some degree of PVWMH on MRI. Comparing baseline and follow-up MRI, 79% of patients demonstrated some degree of PVWMH growth (mean growth volume 3.7 mL; SD 6 mL). Seventy percent of all patients (n = 36) had DWMH lesions at baseline (mean volume was 1.63 mL), and 61% of these patients demonstrated some degree of DWMH growth over time (mean volume 0.4 mL; SD 1 mL). Only patients with complete and analyzable datasets (MPRAGE, FLAIR, DTI, and ASL) were included in the analysis (figure 1).
Periventricular WMH
Relationships between baseline CBF, FA, MD, AD, and RD within the NAWM penumbra layers 1–5, and WMH growth
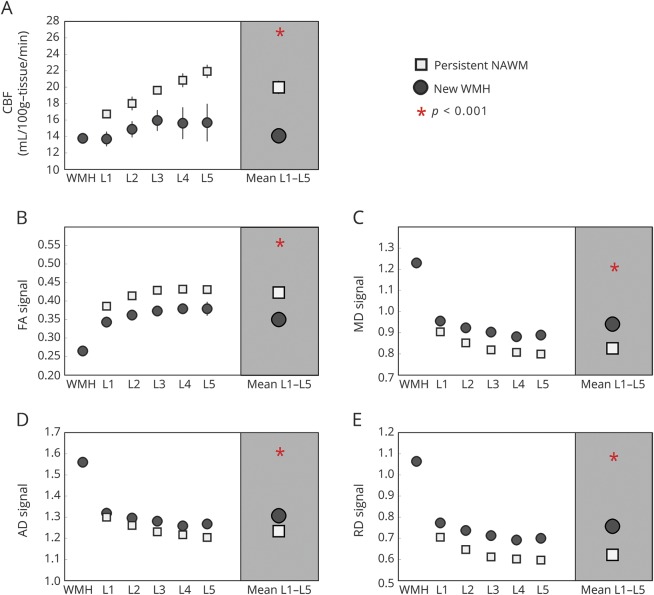
Figure 3 and table e-1 (links.lww.com/WNL/A523) show that baseline CBF and FA of voxels that transitioned to new WMH at follow-up were lower than voxels that remained NAWM at follow-up (p < 0.001). Baseline MD, AD, and RD of voxels that transitioned to new WMH at follow-up were higher than voxels that remained NAWM at follow-up (p < 0.001).
Figure 3. Baseline CBF and diffusion tensor imaging variables of the new periventricular WMH and persistent NAWM voxels of the inner 5 NAWM penumbra layers.
(A) Mean CBF of the inner 5 NAWM penumbra layers was 14.1 ± 0.8 and 20.0 ± 0.8 mL/100 g tissue/min for new WMH and persistent NAWM voxels, respectively (p < 0.001). (B) Mean baseline FA was 0.350 ± 0.007 and 0.423 ± 0.006 for new WMH and persistent NAWM voxels, respectively (p < 0.001). (C) Mean baseline MD was 0.94 ± 0.010 and 0.83 ± 0.007 for new WMH and persistent NAWM voxels, respectively (p < 0.001). (D) Mean baseline AD was 1.307 ± 0.015 and 1.234 ± 0.007 for new WMH and persistent NAWM voxels, respectively (p < 0.001). (E) Mean baseline RD was 0.757 ± 0.010 and 0.622 ± 0.008 for new WMH and persistent NAWM voxels, respectively, (p < 0.001). AD = axial diffusivity; CBF = cerebral blood flow; FA = fractional anisotropy; MD = mean diffusivity; NAWM = normal-appearing white matter; RD = radial diffusivity; WMH = white matter hyperintensity.
Comparison of CBF with composite DTI indicators of structural WMH penumbra markers as predictors of WMH growth
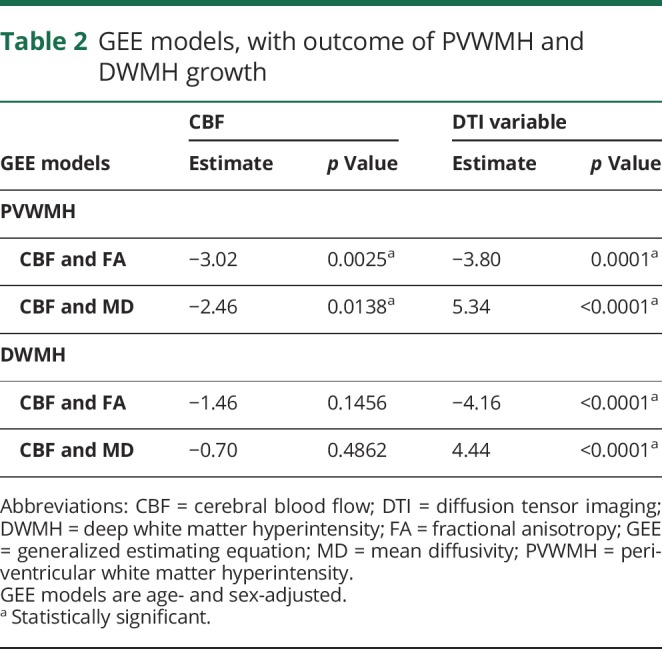
In GEE models adjusted for age and sex, both CBF and each individual DTI variable of FA and MD were associated with WMH growth (table 2).
Table 2.
GEE models, with outcome of PVWMH and DWMH growth
Final model examining PVWMH growth in relation to 3 main potential etiologic factors: Perfusion, decreased axonal integrity, and demyelination
After adjusting for age and sex, CBF, AD, and RD were entered into a GEE model with WMH growth as an outcome. In this final model, RD had the strongest association with WMH growth (estimate 5.08; p < 0.0001) followed by CBF (estimate −2.29; p = 0.0220). AD was not predictive of WMH growth (estimate −0.83; p = 0.4071).
Deep WMH
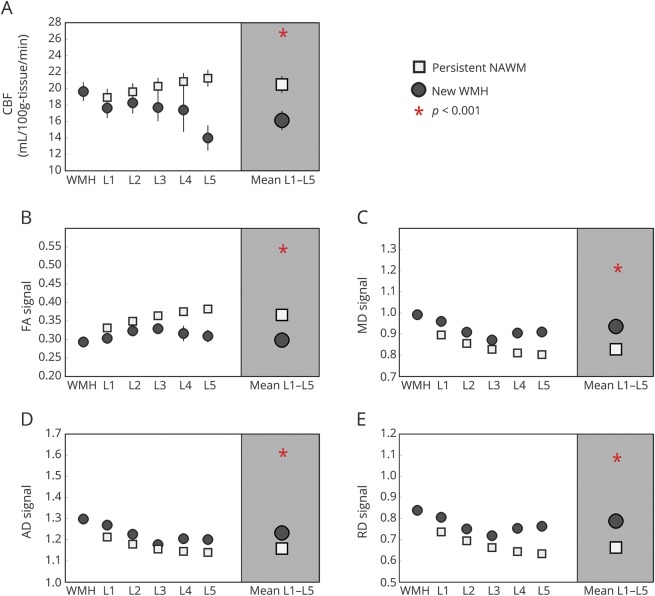
Similar to PVWMH, CBF and each DTI variable predicted WMH growth over time when examined individually (p < 0.001), as shown in figure 4. When entered into the same GEE model, however, DTI markers of decreased structural integrity remained associated with WMH progression, whereas CBF measures did not, as shown in table 2. In a final model examining perfusion and MRI proxies reflecting axonal pathology (AD) and demyelination (RD) as predictors of WMH growth, demyelination was the only variable that remained significant (estimate 3.80, p = 0.0001 for RD; estimate −0.76, p = 0.4468 for CBF; and estimate −0.07, p = 0.9474 for AD).
Figure 4. Baseline CBF and diffusion tensor imaging variables of the new deep WMH and persistent NAWM voxels of the inner 5 NAWM penumbra layers.
(A) cerebral blood flow (CBF), (B) fractional anisotropy (FA), (C) mean diffusivity (MD), (D) axial diffusivity (AD), and (E) radial diffusivity (RD). NAWM = normal-appearing white matter; WMH = white matter hyperintensity.
Discussion
Within the immediate PVWMH environment, both reduced blood flow and microstructure integrity can independently predict WM injury expansion over time. Specifically, low baseline CBF and FA, and high baseline MD, AD, and RD, are associated with future WMH growth, demonstrating that blood flow and microstructural changes precede visually observed WMH injury on FLAIR MRI. Disrupted microstructure integrity is a more sensitive predictor of WMH growth of existing lesions than cerebral perfusion. Compared with AD and CBF, RD was the best predictor of WMH growth, indicating that demyelination may be the main driving force behind PVWMH growth. This work is important because it extends a scientifically grounded framework characterizing WMH development by including both CBF and DTI measures, within the same statistical model, to predict new WMH. A better understanding of the etiology of conversion of NAWM tissue within the WMH penumbra into more damaged tissue is crucial to prevent WMH growth, as previously reported interventions shown to slow progression of WMH burden23–25 indicate that permanent injury within the WMH penumbra, and the subsequent development of cognitive and motor impairment, may be preventable.
Baseline CBF, FA, MD, AD, and RD, within the NAWM penumbra layers 1–5 robustly predicts WMH growth
Our results showed that both CBF and each of the structural markers within the NAWM penumbra layers 1–5 were associated with WMH growth at follow-up. This further validates the previous findings in the in vivo WMH penumbra study from our laboratory demonstrating that the WM area immediately next to WMH is characterized by low CBF and FA and high MD compared to that of the total brain NAWM, suggesting it may be vulnerable to injury.2 Other previous in vivo brain imaging studies have also shown that vascular compromise results in WMH development.11,12 Arteriolosclerosis,14 chronic hemodynamic insufficiency contributed by watershed blood supply,11,12 and impaired blood-brain barrier permeability26,27 are known to be pathologically attributed to WMH burden.
Our results show that low FA and high MD, AD, and RD are associated with the development of new WMH voxels at follow-up, indicating that previously compromised microstructural WM integrity disruption is a harbinger of continued WMH growth, as described elsewhere.28 FA and MD results are consistent with previous reports,2,5–7 while few studies, if any, have investigated AD and RD in this context. Among all of the individual MRI markers, MD was the strongest predictor of WMH growth. This finding is consistent with previous work demonstrating that MD provides better differentiation of WMH-associated integrity disruption within WMH penumbra than FA.2,4 Our current finding supports the use of MD as an early marker of NAWM tissue at risk of further damage to be examined as MRI outcomes in prevention and treatment trials to slow the progression of WM lesions. In addition, our results demonstrate that CBF was reduced throughout the inner 5 penumbra layers, whereas FA was increased according to the distance from the WMH, suggesting that CBF is likely reduced prior to changes in FA (figure 3).
Demyelination is the main underlying etiology of WMH development
Age-related cognitive decline classically has been associated with demyelination and axonal loss. Our results further showed RD to have the strongest relationship with WMH growth compared to AD and CBF, indicating that early subtle demyelination prior to an overt FLAIR hyperintensity signal is most indicative of later overt WMH damage. Previous pathologic studies have shown associations between WMH and demyelination,9,29 particularly along the leading edge of the WMH lesion.30 In the context of this prior work, our data suggest that axonal loss may be a later consequence of more severe WM damage or reflective of wallerian-type degeneration, rather than the initial precipitating factor leading to WMH growth.
CBF and DTI markers as independent predictors of WMH growth
In a separate model examining WMH growth in relation to axonal integrity, demyelination, and perfusion, both CBF and structural markers were independently predictive of WMH growth surrounding the ventricles. This finding of lower WM perfusion persisting as a predictor of WMH growth, even after adjusting for DTI-based measures reflecting microstructural integrity, indicates that CBF is likely partially causal in nature to progressive WM damage. The present results are consistent with pathologic studies demonstrating WMH growth to be associated with arteriolosclerosis14 and support prevention and treatment of cerebrovascular risk factors as a means to combat progression of WM damage in older individuals. In addition, these findings support intervention aimed at improving cerebral perfusion and the use of ASL-CBF as an imaging marker to be used for studies aimed at maintaining cerebrovascular health in older individuals.
CBF is not independently predictive of DWMH growth
Our results show that baseline CBF and DTI can predict DWMH growth. However, after including CBF and each DTI variable in the same model, unlike PVWMH, only the DTI variables correlated with WMH growth, suggesting that CBF is not independently predictive of the expansion of DWMH lesions. This indicates potentially varying pathophysiologies of the 2 WMH subtypes, in that PVWMH growth is more related to CBF at baseline. This discrepancy in WMH subtypes could be the result of anatomical differences, with PV WM located within a watershed region of cerebral perfusion,11,12 resulting in greater chronic hypoperfusion and subsequent damage of the surrounding WM. Our results show that the baseline CBF of PVWMH and its corresponding NAWM layers 1 and 2 is lower than that of DWMH, as shown in figure e-3 (links.lww.com/WNL/A522), consistent with a watershed distribution of perfusion around the ventricles. Initial WM damage of DWMH regions (represented by baseline CBF values within the penumbra) may represent a near-maximal insult resulting from compromised perfusion from occlusion of deep, penetrating arterioles. Unlike PVWMH growth, chronic hypoperfusion may not be as important a contributor to expansion of DWMH lesions, which appears to be more driven by progressive demyelination of previously damaged tissue. It should be noted, however, that this cohort had relatively little DWMH burden at baseline, with minimal growth over time, and these results should therefore be interpreted with caution. Future investigations examining the role of perfusion in the expansion of DWMH lesions in a cohort with greater DWMH damage at baseline will be necessary to fully clarify these relationships.
Limitations
One limitation is the spatial resolution of ASL. However, we used an increased ASL scan time (36 minutes) to maximize signal-to-noise ratio in order to mitigate this issue. Another confine is that, as an indirect sampling method, DTI measurements are a proxy for underlying tissue structure and may be reflective of other microstructural and/or macrostructural features. Follow-up studies including sequences allowing for evaluation of additional structural features, such as biotensor modeling, or postmortem MRI-guided tissue sampling to directly characterize the underlying tissue pathology, are certainly warranted. Additional studies examining rates of change of WMH growth and associations with cognitive status are also needed. Reproducibility is very important for a longitudinal study, as one would expect some variation in baseline MRI signal if the study were repeated within subject. However, the analyses reported are robust to scan session variance, as the WMH segmentation algorithm uses brightness of FLAIR signal relative to the rest of the WM signal within the scan, so baseline differences in signal intensity would have limited effect on WMH detection rates.
In conclusion, results from this study demonstrate that both reduced cerebral perfusion and degraded microstructural integrity at baseline predict PVWMH growth at follow-up. Baseline microstructural integrity is more sensitive than CBF in predicting WMH growth, with DTI-based metrics reflecting that demyelination is likely the primary cause of WMH development. MD is the most sensitive DTI marker in predicting WMH growth, suggesting that this MRI parameter should be used for future studies aimed at preserving WM integrity. Lastly, findings from this study support the use of interventions aimed at improving CBF to prevent WMH accumulation in an older, dementia-free population.
Glossary
- AD
axial diffusivity
- ASL
arterial spin labeling
- CBF
cerebral blood flow
- DTI
diffusion tensor imaging
- DWMH
deep white matter hyperintensity
- FA
fractional anisotropy
- FLAIR
fluid-attenuated inversion recovery
- GEE
generalized estimating equation
- MD
mean diffusivity
- MPRAGE
magnetization-prepared rapid-acquisition gradient echo
- NAWM
normal-appearing white matter
- pASL
pulsed arterial spin labeling
- PVWMH
periventricular white matter hyperintensity
- RD
radial diffusivity
- TE
echo time
- TI
inversion time
- TR
repetition time
- WM
white matter
- WMH
white matter hyperintensity
Author contributions
Dr. Nutta-on Promjunyakul: drafted the manuscript, participated in study concept and design, conducted the statistical analyses, analyzed and interpreted the data. Dr. Hiroko Dodge: performed statistical analyses, interpreted the data, and made a substantial contribution in revising the manuscript. Mr. David Lahna: conducted the white matter hyperintensity and DTI analyses, interpreted the data, and made a substantial contribution in revising the manuscript. Dr. Erin Boespflug: made a substantial contribution in revising the manuscript and interpreted the data. Dr. Jeffrey Kaye: made a substantial contribution in revising the manuscript for intellectual content and assisted in the study concept. Dr. Bill Rooney: assisted in study concept and in designing the MRI sequences. Dr. Lisa Silbert: supervised the study, made a substantial contribution in revising the manuscript for intellectual content, participated in study concept and design, analyzed and interpreted the data.
Study funding
Funded by NIH (1RO1AG036772, P30 AG008017, RO1 AG024059) and the Department of Veterans Affairs.
Disclosure
N. Promjunyakul reports no disclosures relevant to the manuscript. H. Dodge receives research support from NIH (P30 AG008017, R01AG051628, R01AG056102, U01NS100611, P01AG043362, R01AG043398, R01AG042191, P30AG053760, U2CAG054397, U2CAG057441); serves as an unpaid past chair of the Clinical Trials Methods Professional Interests Area supported by the Alzheimer's Association; and serves as senior associate editor for Alzheimer's & Dementia: Translational Research & Clinical Interventions, Alzheimer's & Dementia, and as a statistical editor for International Psychogeriatrics. D. Lahna reports no disclosures relevant to the manuscript. E. Boespflug receives research and/or salary support from the NIH (P30AG008017-28S1, P30AG008017-28) and from the Paul G. Allen Family Foundation. J. Kaye receives research support awarded to his university (Oregon Health & Science University [OHSU]) from the NIH (P30 AG008017, R01 AG024059, P30 AG024978, P01 AG043362, U01 AG010483); directs a center that has received research support in the last 36 months from the NIH, CDC, Nestlé Institute of Health Sciences, Roche, Lundbeck, Merck, and Eisai; is personally compensated for serving on data safety monitoring committees for Eli Lilly and Suven; receives reimbursement through the OHSU faculty practice plan from Medicare or commercial insurance plans for providing clinical assessment and care for patients; is salaried to see patients at the Portland VA Medical Center; serves as an unpaid past chair of the International Society to Advance Alzheimer's Research and Treatment for the national Alzheimer's Association and as an unpaid commissioner for the Center for Aging Services Technologies; and serves on the editorial advisory board of the journal Alzheimer's & Dementia, and as associate editor. W. Rooney reports no disclosures relevant to the manuscript. L. Silbert receives research support from the NIH (P30 AG008017, R01AG051628, R56AG056102, U01 79634019, 5U19AG010483-26) and from the Paul G. Allen Family Foundation. She also receives reimbursement through Medicare or commercial insurance plans for providing clinical assessment and care for patients and for intraoperative neurophysiologic monitoring, and is salaried to see patients at the Portland VA Medical Center. Go to Neurology.org/N for full disclosures.
References
- 1.Maillard P, Fletcher E, Harvey D, et al. White matter hyperintensity penumbra. Stroke 2011;42:1917–1922. [DOI] [PMC free article] [PubMed] [Google Scholar]
- 2.Promjunyakul N, Lahna D, Kaye JA, et al. Characterizing the white matter hyperintensity penumbra with cerebral blood flow measures. Neuroimage Clin 2015;8:224–229. [DOI] [PMC free article] [PubMed] [Google Scholar]
- 3.Promjunyakul NO, Lahna DL, Kaye JA, et al. Comparison of cerebral blood flow and structural penumbras in relation to white matter hyperintensities: a multi-modal magnetic resonance imaging study. J Cereb Blood Flow Metab 2016;36:1528–1536. [DOI] [PMC free article] [PubMed] [Google Scholar]
- 4.Maniega SM, Valdes Hernandez MC, Clayden JD, et al. White matter hyperintensities and normal-appearing white matter integrity in the aging brain. Neurobiol Aging 2015;36:909–918. [DOI] [PMC free article] [PubMed] [Google Scholar]
- 5.de Groot M, Verhaaren BF, de Boer R, et al. Changes in normal-appearing white matter precede development of white matter lesions. Stroke 2013;44:1037–1042. [DOI] [PubMed] [Google Scholar]
- 6.Maillard P, Carmichael O, Harvey D, et al. FLAIR and diffusion MRI signals are independent predictors of white matter hyperintensities. AJNR Am J Neuroradiol 2013;34:54–61. [DOI] [PMC free article] [PubMed] [Google Scholar]
- 7.Bernbaum M, Menon BK, Fick G, et al. Reduced blood flow in normal white matter predicts development of leukoaraiosis. J Cereb Blood Flow Metab 2015;35:1610–1615. [DOI] [PMC free article] [PubMed] [Google Scholar]
- 8.Maillard P, Fletcher E, Lockhart SN, et al. White matter hyperintensities and their penumbra lie along a continuum of injury in the aging brain. Stroke 2014;45:1721–1726. [DOI] [PMC free article] [PubMed] [Google Scholar]
- 9.Pantoni L, Garcia JH. Pathogenesis of leukoaraiosis: a review. Stroke 1997;28:652–659. [DOI] [PubMed] [Google Scholar]
- 10.De Reuck J. The human periventricular arterial blood supply and the anatomy of cerebral infarctions. Eur Neurol 1971;5:321–334. [DOI] [PubMed] [Google Scholar]
- 11.Thomas AJ, O'Brien JT, Barber R, McMeekin W, Perry R. A neuropathological study of periventricular white matter hyperintensities in major depression. J Affect Disord 2003;76:49–54. [DOI] [PubMed] [Google Scholar]
- 12.Moody DM, Brown WR, Challa VR, Ghazi-Birry HS, Reboussin DM. Cerebral microvascular alterations in aging, leukoaraiosis, and Alzheimer's disease. Ann NY Acad Sci 1997;826:103–116. [DOI] [PubMed] [Google Scholar]
- 13.Black S, Gao F, Bilbao J. Understanding white matter disease: imaging-pathological correlations in vascular cognitive impairment. Stroke 2009;40:S48–S52. [DOI] [PubMed] [Google Scholar]
- 14.Erten-Lyons D, Woltjer R, Kaye J, et al. Neuropathologic basis of white matter hyperintensity accumulation with advanced age. Neurology 2013;81:977–983. [DOI] [PMC free article] [PubMed] [Google Scholar]
- 15.Song SK, Sun SW, Ramsbottom MJ, Chang C, Russell J, Cross AH. Dysmyelination revealed through MRI as increased radial (but unchanged axial) diffusion of water. Neuroimage 2002;17:1429–1436. [DOI] [PubMed] [Google Scholar]
- 16.Schmierer K, Wheeler-Kingshott CA, Tozer DJ, et al. Quantitative magnetic resonance of postmortem multiple sclerosis brain before and after fixation. Magn Reson Med 2008;59:268–277. [DOI] [PMC free article] [PubMed] [Google Scholar]
- 17.Folstein MF, Folstein SE, McHugh PR. “Mini-Mental State”: a practical method for grading the cognitive state of patients for the clinician. J Psychiatr Res 1975;12:189–198. [DOI] [PubMed] [Google Scholar]
- 18.Morris JC. The Clinical Dementia Rating (CDR): current version and scoring rules. Neurology 1993;43:2412–2414. [DOI] [PubMed] [Google Scholar]
- 19.Luh WM, Wong EC, Bandettini PA, Hyde JS. QUIPSS II with thin-slice TI1 periodic saturation: a method for improving accuracy of quantitative perfusion imaging using pulsed arterial spin labeling. Magn Reson Med 1999;41:1246–1254. [DOI] [PubMed] [Google Scholar]
- 20.Campbell AM, Beaulieu C. Pulsed arterial spin labeling parameter optimization for an elderly population. J Magn Reson Imaging 2006;23:398–403. [DOI] [PubMed] [Google Scholar]
- 21.Wang J, Licht DJ, Jahng GH, et al. Pediatric perfusion imaging using pulsed arterial spin labeling. J Magn Reson Imaging 2003;18:404–413. [DOI] [PubMed] [Google Scholar]
- 22.Smith SM, Jenkinson M, Woolrich MW, et al. Advances in functional and structural MR image analysis and implementation as FSL. Neuroimage 2004;23:S208–S219. [DOI] [PubMed] [Google Scholar]
- 23.Dufouil C, Chalmers J, Coskun O, et al. Effects of blood pressure lowering on cerebral white matter hyperintensities in patients with stroke: the PROGRESS (Perindopril Protection Against Recurrent Stroke Study) Magnetic Resonance Imaging Substudy. Circulation 2005;112:1644–1650. [DOI] [PubMed] [Google Scholar]
- 24.de Leeuw FE, de Groot JC, Oudkerk M, et al. Hypertension and cerebral white matter lesions in a prospective cohort study. Brain 2002;125:765–772. [DOI] [PubMed] [Google Scholar]
- 25.Torres ER, Strack EF, Fernandez CE, Tumey TA, Hitchcock ME. Physical activity and white matter hyperintensities: a systematic review of quantitative studies. Prev Med Rep 2015;2:319–325. [DOI] [PMC free article] [PubMed] [Google Scholar]
- 26.Anderson VC, Obayashi JT, Kaye JA, et al. Longitudinal relaxographic imaging of white matter hyperintensities in the elderly Fluids Barriers CNS 2014;11:24. [DOI] [PMC free article] [PubMed] [Google Scholar]
- 27.Topakian R, Barrick TR, Howe FA, Markus HS. Blood-brain barrier permeability is increased in normal-appearing white matter in patients with lacunar stroke and leucoaraiosis. J Neurol Neurosurg Psychiatry 2010;81:192–197. [DOI] [PubMed] [Google Scholar]
- 28.Basser PJ, Pierpaoli C. Microstructural and physiological features of tissues elucidated by quantitative-diffusion-tensor MRI. J Magn Reson B 1996;111:209–219. [DOI] [PubMed] [Google Scholar]
- 29.Haller S, Kövari E, Herrmann FR, et al. Do brain T2/FLAIR white matter hyperintensities correspond to myelin loss in normal aging? A radiologic-neuropathologic correlation study Acta Neuropathol Commun 2013;1:14. [DOI] [PMC free article] [PubMed] [Google Scholar]
- 30.Adler S, Martinez J, Williams DS, Verbalis JG. Positive association between blood brain barrier disruption and osmotically-induced demyelination. Mult Scler 2000;6:24–31. [DOI] [PubMed] [Google Scholar]
Associated Data
This section collects any data citations, data availability statements, or supplementary materials included in this article.
Data Availability Statement
Anonymized data will be shared by request from any qualified investigator for purposes of replicating procedures and results.


