

Abstract
Twin studies indicate that latent genetic factors overlap across comorbid psychiatric disorders. In this study, we used a novel approach to elucidate shared genetic factors across psychiatric outcomes by clustering single nucleotide polymorphisms based on their genome-wide association patterns. We applied latent profile analysis (LPA) to p-values resulting from genome-wide association studies across three phenotypes: symptom counts of alcohol dependence (AD), antisocial personality disorder (ASP), and major depression (MD), using the European–American case-control genome-wide association study subsample of the collaborative study on the genetics of alcoholism (N = 1399). In the 3-class model, classes were characterized by overall low associations (85.6% of SNPs), relatively stronger association only with MD (6.8%), and stronger associations with AD and ASP but not with MD (7.6%), respectively. These results parallel the genetic factor structure identified in twin studies. The findings suggest that applying LPA to association results across multiple disorders may be a promising approach to identify the specific genetic etiologies underlying shared genetic variance.
Keywords: Comorbidity, Psychiatric disorder, Genetic etiology, Latent profile analysis, GWAS
Introduction
Twin studies of the genetic architecture of comorbid psychiatric disorders suggest considerable genetic overlap across psychiatric conditions. Analyses of the covariance structure of comorbid psychiatric disorders have suggested a hierarchical factor structure (Krueger 1999; Krueger et al. 2001; Krueger and Markon 2006), with two primary factors comprising internalizing and externalizing disorders. Internalizing disorders encompass major depression, dysthymia, generalized anxiety disorder, phobias, and panic disorder, and externalizing disorders encompass alcohol dependence, drug dependence, conduct disorder, and antisocial personality disorder (Krueger 1999). Behavioral genetic studies using twin data indicate that genetic factors largely account for shared variation within internalizing and externalizing disorders, respectively (Kendler et al. 2003; Kendler et al. 2011a; Krueger et al. 2002). In an effort to take into account the shared genetic epidemiology of internalizing or externalizing disorders, investigators have sometimes created composite internalizing or externalizing phenotypes for use in genetic analyses (Benke et al. 2014; Derringer et al. 2015; Dick et al. 2008; McGue et al. 2013). Genome-wide association studies (GWAS) results of individual psychiatric outcomes have also been used to examine genetic relationships between multiple disorders. Such methods include the polygenic score approach (Purcell et al. 2009), restricted maximum likelihood methods (Yang et al. 2010, 2011), and cross-trait linkage disequilibrium (LD) score regression (Bulik-Sullivan et al. 2015a, b).
In this study, we used GWAS summary statistics to elucidate shared genetic etiology across psychiatric outcomes by classifying single nucleotide polymorphisms (SNPs) based on their genome-wide association patterns. Specifically, we applied latent profile analysis (LPA) (Gibson 1959; Lazarsfeld and Henry 1968) to p-values of associations between SNPs and three psychiatric phenotypes: symptom counts of alcohol dependence (AD), antisocial personality disorder (ASP), and major depression (MD), to identify clusters of SNPs with homogeneous association patterns. We hypothesized that the pattern of associations with these phenotypes would not be random, but rather, that there would be a subset of SNPs with relatively stronger associations with the two externalizing disorders (AD and ASP) but not with MD, an internalizing disorder. Thus, as a proof of principle, we applied LPA to the association patterns across AD, ASP, and MD, to test whether it would result in identifying clusters of SNPs corresponding to the patterns predicted based on twin findings.
Method
Participants and measures
The case-control GWAS subsample was selected from the collaborative study on the genetics of alcoholism (COGA) as previously described (Edenberg et al. 2010). COGA recruited families with alcohol dependent probands diagnosed as alcohol dependent by both the diagnostic and statistical manual of mental disorders, third edition, revised (DSM-III-R) (American Psychiatric Association 1987) and Feighner criteria (Feighner et al. 1972) from inpatient and outpatient alcohol treatment centers across study sites, and families from community controls. A poly-diagnostic instrument, the semi-structured assessment for the genetics of alcoholism (SSAGA) (Bucholz et al. 1994; Hesselbrock et al. 1999) was administered to participants. Written consents were obtained from all participants, and the institutional review boards of all participating sites approved the study. Cases were selected from families with alcohol dependent probands that had a lifetime AD diagnosis using DSM-IV (American Psychiatric Association 2000) criteria. Controls were selected from both community-ascertained families and families with alcohol dependent probands, but could not share a common known ancestor with a case subject. Controls were required to have previously consumed alcohol, but not to have a diagnosis of alcohol dependence, abuse, or harmful use by any of the diagnostic systems included in SSAGA (Feighner, DSM-III-R, DSM-IV, and ICD-10). In addition, the controls could not have DSM-III-R or DSM-IV diagnoses of abuse or dependence for other substances (cocaine, marijuana, opioids, sedatives, or stimulants) to avoid potential genetic risk factors shared with alcohol abuse and dependence. Only the European–American subsample (N = 1399, 46.6% female) was used, to reduce population stratification. Genotyping was performed by the Center for Inherited Disease Research using the Illumina Infinium II assay protocol (Gunderson et al. 2006) with hybridization to Illumina HumanHap1M Bead-Chips (Illumina, San Diego, CA). Detailed information on genotyping can be found in Edenberg et al. (2010); data are available at dbGaP (phs000092.v1.p1). Symptom counts of AD, ASP, and MD were used as phenotypes for GWAS, and sex was used as a covariate. GWAS p-values of association between 989, 949 SNPs and each of the three phenotypes were computed using PLINK version 1.07 (Purcell et al. 2007).
Statistical analysis
We applied LPA to the log of p-values from the GWAS of AD, ASP, and MD symptom counts. LPA is a categorical latent variable model that is commonly used to identify groups of individuals, referred to as “classes”, based on the patterns of responses on multiple observed variables, referred to as “class indicators”. In this study, however, we used LPA to identify classes of SNPs, instead of individuals. Thus, unlike the common setting of LPA, in which data are arranged by individuals, the data for our analyses were arranged by SNPs. Thus, the data consisted of four columns—a SNP ID and three columns of class indicators, which in our case are −log10(p-values) corresponding to AD, ASP, and MD, with n rows, where n is the number of SNPs included in the analysis. The profile of each SNP, the pattern of association strengths with the three phenotypes, indexed by their −log10 of GWAS p-values, was used as class indicators in LPA.
Although other statistics from association results, such as regression coefficient beta, t statistics (beta divided by the standard error), and raw p-values, can index association strengths between SNPs and the phenotypes could be used as class indicators, we concluded that they are less or equivalently appropriate as class indicators compared to −log10(p). Raw p-values may not be appropriate because they may result in classes overly driven by SNPs with lower association strengths, where p-values are more distinguishable than p-values of higher association strengths. Given that the direction of effect of each SNP is determined by an arbitrary decision on the reference allele, and because we designed the analysis to classify SNPs based on their patterns of association strengths, signs of raw beta coefficients may introduce an unnecessary dimension into classification. Absolute values of beta coefficients still may not correctly represent the association strengths without taking into account their standard errors. Absolute values of beta coefficients divided by their standard errors, absolute values of t statistics, may better represent association strengths than raw beta. However, we expect that using absolute values of t statistics would be equivalent to using log10(p).
In our analyses, we utilized three primary sets of parameters to interpret the results of LPA. First, the estimated means of the −log10(p) of the three phenotypes were used to characterize and interpret the response profile of each class. For example, if SNPs in a given class have relatively larger means for AD and ASP than for MD, this class can be interpreted as being associated with the two externalizing phenotypes. Second, LPA estimates each SNP’s probability of belonging to each of the estimated classes. For each SNP, these probabilities sum to one, and the class with the highest probability was referred to as the “most likely class.” Third, LPA computes class proportions, which are, in our case, the proportions of SNPs classified into each class, based on the estimated parameters. In addition, the quality of classification was measured by the entropy. Entropy ranges from 0 to 1, where values approaching 1 indicate clear separation between classes (Celeux and Soromenho 1996). We used Mplus version 7.1 (Muthén and Muthén 1998–2012), with maximum likelihood estimator with robust standard errors (MLR), to estimate the parameters of LPA.
We fit LPAs with two to ten classes and examined classifications of SNPs across LPAs with different number of classes, based on most likely class memberships. The purposes of these analyses were to: (1) determine the optimal number of classes of SNPs and (2) examine whether classifications of SNPs follow the pattern predicted by twin studies. Assuming that SNPs corresponding to internalizing and externalizing genetic factors exist, we expected that SNPs in a class associated with both AD and ASP would be divided into individual classes of AD and ASP, respectively, as the number of classes increases. In contrast, we hypothesized that SNPs associated with MD would initially form their own class and would not overlap with SNPs in classes for AD and/or ASP by increasing the number of classes. To guide the selection of the optimal number of classes, we used both information criteria and the bootstrap likelihood ratio test (BLRT) (McLachlan and Peel 2004). The Akaike information criterion (AIC) (Akaike 1987) and Bayesian information criterion (BIC) (Schwarz 1978) penalize the complexity of models (i.e. the number of parameters estimated), and lower values are preferred because they represent a balance between model fit and parsimony. The BLRT tests the difference of log likelihoods between models with k and k-1 class(es), and insignificant p-values indicate that a model with k classes fits no better than a model with k-1 classes.
Results of the LPA models were compared to the results from subsets of the data and alternative methods to examine how consistent LPA results are. First, we fit LPA models with an increasing number of classes to a pruned subset of SNPs. Because SNPs in high linkage disequilibrium (LD) are correlated, they may distort the classification of SNPs by causing classes of correlated SNPs driven by LD structure. To exclude this possibility, we created a subset of SNPs by pruning SNPs with r2 > 0.1 and fit LPA models to this pruned subset of SNPs. Pruning was done in PLINK software version 1.07 (Purcell et al. 2007). Second, we applied k-means clustering to −log10(p-values) from the GWAS. Unlike LPA, k-means clustering is a non-parametric clustering method that does not have within-class normality assumption. K-means clustering with varying k were applied to examine how the number of clusters and class profiles from non-parametric model compare to the LPA results. Results of k-means clustering depend more on the choice of the distance metrics and their scales than in LPA (Magidson and Vermunt 2002). For our analysis, we used −log10(p), the class indicator used in LPA, as the distance metric for k-means clustering, because our goal was to examine whether the results from different methods using the same indicators converge. We used the Hpclus and Fastclus procedures in SAS/STAT™ software version 9.4 (SAS Institute, Cary NC) for k-means clustering. Lastly, we fit the LPA models with different number of classes to randomly split-half subsets of our sample to examine whether the results from the full sample replicate in smaller sample sizes. For the split-half samples, we created two subsets of randomly split-half samples with equal sizes from the full sample, without replacement. We then ran separate GWASs in each sample and fit LPAs using resulting p-values.
Results
Table 1 summarizes fit indices and entropy values resulting from the LPA of 2- to 9-class models using full set of SNPs. The best log likelihood was not replicated in the ten-class model indicating that the model is unstable, and the result from ten-class model was not presented. The optimal number of classes was not obvious based on information criteria and the BLRT. Both AIC and BIC continued to decrease throughout the 2- to 9-class models, and all BLRTs resulted in significant p-values. Given that the optimal number classes was not clear in terms of information criteria and BLRT, in the following sections we focus our interpretation on the 2- to 4-class models based on our expectations from twin findings. The classes were well separated in all models, as evidenced by values of entropy ranging between 0.888 and 0.920.
Table 1.
Model fit summary and entropy values from 2- to 9-class models
| Number of classes | Number of parameters | Log likelihood | AIC | BIC | VLM-LRT | Entropy |
|---|---|---|---|---|---|---|
| 2 | 10 | −1445427.453 | 2,890,875 | 2,890,993 | <0.001 | 0.920 |
| 3 | 14 | −1337989.919 | 2,676,008 | 2,676,173 | <0.001 | 0.921 |
| 4 | 18 | −1262112.296 | 2,524,261 | 2,524,473 | <0.001 | 0.912 |
| 5 | 22 | −1210300.289 | 2,420,645 | 2,420,904 | 0.333 | 0.901 |
| 6 | 26 | −1171070.191 | 2,342,192 | 2,342,499 | 0.333 | 0.895 |
| 7 | 30 | −1140480.727 | 2,281,021 | 2,281,376 | <0.001 | 0.894 |
| 8 | 34 | −1118906.299 | 2,237,881 | 2,238,282 | <0.001 | 0.888 |
| 9 | 38 | −1098595.506 | 2,197,267 | 2,197,716 | <0.001 | 0.894 |
Response profiles of classes identified in 2- to 4-class models are summarized in Table 2 and in Fig. 1. In the 2-class model, the first class (labeled as the null) included 90.35% of SNPs, and its response profile was characterized by weak associations, indexed by the low means of class indicators, which are −log10(p), for all three phenotypes, indicating that SNPs in this class were not associated with any of included phenotypes. The second class included 9.7% of SNPs and was labeled as the Signal class because its response profile was characterized by relatively stronger overall associations, indexed by higher means of class indicators compared to the null class. In the 3-class model, the three classes were labeled as the Null, AD+ASP, and MD classes, respectively based on their response profiles. The null class was the largest (85.57% of SNPs) and had a profile characterized by relatively low means of class indicators for all three phenotypes. The AD+ASP class consisted of 7.63% of SNPs, and its response profile indicated higher means for AD and ASP, indicating relatively stronger associations with AD and ASP. The MD class, comprised 6.8% of SNPs, was characterized by a higher mean for MD compared to means for AD and ASP. Finally, in the 4-class model, classes were labeled as the null, AD, ASP, and MD classes, respectively. The majority (80.9%) of SNPs were included in the null class. The AD class comprised 8.5% of SNPs and was characterized by a relatively higher mean for AD only. The ASP class included 4.9% of SNPs, and its profile indicated a higher mean for ASP only. The MD class consisted of 5.68% of SNPs and was characterized by a higher mean for MD only.
Table 2.
Response profiles of classes from 2- to 4-class models
| 2-class | Null | Signal | ||
|---|---|---|---|---|
| Class proportions | 90.35% | 9.65% | ||
| Means of −log10(p) (SE) | ||||
| AD | 0.378 (<0.001) | 0.867(0.003) | ||
| ASP | 0.336 (0.001) | 1.407(0.004) | ||
| MD | 0.409 (<0.001) | 0.711(0.003) | ||
|
| ||||
| 3-class | Null | MD | AD+ASP | |
|
| ||||
| Class proportions | 85.57% | 6.80% | 7.63% | |
| Means of −log10(p) (SE) | ||||
| AD | 0.372 (<0.001) | 0.588 (0.003) | 0.873 (0.004) | |
| ASP | 0.338 (0.001) | 0.541 (0.003) | 1.490 (0.004) | |
| MD | 0.341 (0.001) | 1.531 (0.005) | 0.550 (0.003) | |
|
| ||||
| 4-class | Null | MD | AD | ASP |
|
| ||||
| Class proportions | 80.90% | 5.68% | 8.50% | 4.93% |
| Means of −log10(p) (SE) | ||||
| AD | 0.309 (<0.001) | 0.524 (0.003) | 1.273 (0.003) | 0.759 (0.005) |
| ASP | 0.339 (0.001) | 0.540 (0.003) | 0.607 (0.003) | 1.689 (0.007) |
| MD | 0.344 (0.001) | 1.592 (0.005) | 0.464 (0.002) | 0.604 (0.004) |
Fig. 1.
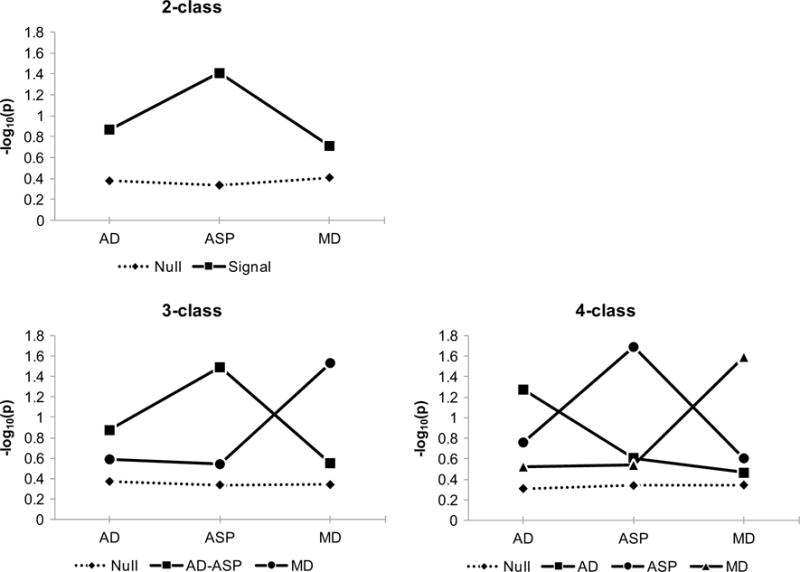
Mean profiles of 2- to 4-class LPA models
Patterns of classification, based on most likely class memberships, across LPAs with 2–4 classes are summarized in Table 3. Largely the same groups of SNPs were classified into the null class across the 2- to 4-class models. Of the SNPs classified into the Signal class in the 2-class model, most (93.7%) were classified into the AD+ASP class (79.4%) or MD class (14.3%) in the 3-class model. A majority (89.1%) of SNPs in the 3-class AD+ASP class were classified into the AD (24.1%) or ASP (65.1%) classes in the 4-class model. 83.4% of the SNPs classified into the MD class of the 3-class model remained in the MD class of the 4-class model.
Table 3.
The cross-tabulation of class memberships between 2-, 3-, and 4-class models
| Between 2- and 3-class models | ||||
|---|---|---|---|---|
|
| ||||
| 2-class | 3-class
|
|||
| AD+ASP | MD | Null | ||
| Null | Count | 0 | 50,922 | 848,055 |
| % within 2-class null | 0.00% | 5.70% | 94.30% | |
| Signal | Count | 72,249 | 13,029 | 5694 |
| % within 2-class signal | 79.40% | 14.30% | 6.30% | |
| Between 3- and 4-class models | |||||
|---|---|---|---|---|---|
|
| |||||
| 3-class | 4-class
|
||||
| ASP | AD | MD | Null | ||
| AD+ASP | Count | 47,018 | 17,440 | 208 | 7583 |
| % Within 3-class AD+ASP | 65.10% | 24.10% | 0.30% | 10.50% | |
| MD | Count | 373 | 5744 | 53,338 | 4496 |
| % Within 3-class MD | 0.60% | 9.00% | 83.40% | 7.00% | |
| Null | Count | 0 | 56,060 | 58 | 797,631 |
| % Within 3-class null | 0.00% | 6.60% | 0.00% | 93.40% | |
Results from LPA models applied to a subset of SNPs pruned at r2 = 0.1 were very close to the results from the full set of SNPs. Table 4 summarizes the results of 2- to 4-class models using the pruned subset of SNPs. Class profiles and proportions from 2- to 4-class models from pruned set of SNPs were close to corresponding classes from the full set of SNPs and were labeled accordingly in the Table 4. The results of k-means clustering applied to both the full and pruned subset of SNPs summarized in Tables 5 and 6. Although k-means clustering provides less guidance on the number of classes than in LPAs (Magidson and Vermunt 2002), we used the aligned box criterion (ABC) (Hall et al. 2014) to guide determining the number of clusters. ABC compares within-cluster sum of squares to those from simulated null distributions from varying number of clusters, and the largest difference indicates the optimal number of clusters. In our analysis, ABC peaked at 2 and 3 clusters from full and pruned (r2 = 0.1) sets of SNPs, respectively. Profiles of clusters from 3-means model were similar to 3-class LPA (Table 5). Clusters correspond to the Null, MD, and AD+ASP classes from 3-class LPA were identified, although the Null cluster was much smaller making other classes larger in 3-means result, compared to 3-class LPA result. Importantly, cross-tabulating cluster memberships across 2- to 4-means models showed consistent results as in LPA. In Table 6, the majority of SNPs in the null class of 2-means model stays in the null cluster of 3-means model, while SNPs in the Signal cluster were mostly split into either AD+ASP or MD cluster resulted from 3-means model. AD+ASP class was further split into ASP or AD clusters of 4-means model, and SNPs in MD cluster mostly remained in the MD cluster of 4-means model. Results of LPA from split-half samples were consistent with each other and with the result from overall sample. In both halves, classes with profiles and proportions similar to those of full set of SNPs were identified. Detailed results of split-half samples are provided in Tables S1 and S2 in the supplementary material.
Table 4.
Response profiles and proportions of classes from 2- to 4-class models using SNPs pruned at r2 = 0.1
| 2-class | Null | Signal | ||
|---|---|---|---|---|
| Proportions | 90.15% | 9.85% | ||
| Means of −log10(p) (SE) | ||||
| AD | 0.371 (0.001) | 0.829 (0.008) | ||
| ASP | 0.334 (0.001) | 1.396 (0.009) | ||
| MD | 0.420 (0.001) | 0.684 (0.007) | ||
|
| ||||
| 3-class | Null | MD | AD+ASP | |
|
| ||||
| Proportions | 85.55% | 6.30% | 8.14% | |
| Means of −log10(p) (SE) | ||||
| AD | 0.365 (0.001) | 0.569 (0.008) | 0.840 (0.009) | |
| ASP | 0.335 (0.001) | 0.525 (0.008) | 1.460 (0.010) | |
| MD | 0.357 (0.002) | 1.508 (0.014) | 0.556 (0.006) | |
|
| ||||
| 4-class | Null | MD | AD | ASP |
|
| ||||
| Proportions | 80.74% | 5.21% | 8.64% | 5.41% |
| Means of −log10(p) (SE) | ||||
| AD | 0.301 (0.001) | 0.503 (0.009) | 1.226 (0.007) | 0.762 (0.014) |
| ASP | 0.338 (0.002) | 0.530 (0.009) | 0.577 (0.008) | 1.633 (0.016) |
| MD | 0.360 (0.002) | 1.570 (0.016) | 0.467 (0.005) | 0.605 (0.010) |
Table 5.
Mean (variance) profiles from 3-means clusterings with full and pruned sets of SNPs
| Full set Cluster | Null | MD | AD+ASP |
|---|---|---|---|
| Proportions | 67.35% | 15.41% | 17.24% |
| AD | 0.301 (0.067) | 0.451 (0.140) | 0.887 (0.247) |
| ASP | 0.279 (0.051) | 0.419 (0.120) | 1.087 (0.283) |
| MD | 0.266 (0.040) | 1.187 (0.195) | 0.443 (0.130) |
|
| |||
| Pruned set* Cluster | Null | MD | AD+ASP |
|
| |||
| Proportions | 66.08% | 17.20% | 16.73% |
| AD | 0.304 (0.068) | 0.426 (0.125) | 0.851 (0.239) |
| ASP | 0.280 (0.050) | 0.391 (0.100) | 1.114 (0.260) |
| MD | 0.268 (0.038) | 1.115 (0.174) | 0.461 (0.134) |
SNPs were pruned at r2 = 0.1
Table 6.
Cross tabulations of cluster memberships from 2- to 3-means clusterings
| 2-means | 3-means
|
||||
|---|---|---|---|---|---|
| AD+ASP | MD | Null | |||
| Null | Count | 19,168 | 74,697 | 664,291 | |
| % Within 2-cluster null | 2.53% | 9.85% | 87.62% | ||
| Signal | Count | 151,473 | 77,834 | 2486 | |
| % Within 2-cluster signal | 65.35% | 33.58% | 1.07% | ||
|
| |||||
| 3-means | 4-means
|
||||
| ASP | AD | MD | Null | ||
|
| |||||
| AD+ASP | Count | 99,560 | 67,603 | 946 | 2532 |
| % Within 3-cluster AD+ASP | 58.34% | 39.62% | 0.55% | 1.48% | |
| MD | Count | 3511 | 11,101 | 135,760 | 2159 |
| % Within 3-cluster MD1 | 2.30% | 7.28% | 89.00% | 1.42% | |
| Null | Count | 2702 | 74,724 | 36 | 589,315 |
| % Within 3-cluster null | 0.41% | 11.21% | 0.01% | 88.38% | |
Discussion
This study examined the patterns of clustering of SNP association results by applying LPA to genome-wide association results across AD, ASP, and MD. Conditional on considering models consistent with expectations from twin studies regarding the number of classes, the results indicated that the classifications of SNPs based on their patterns of associations broadly reflected externalizing and internalizing genetic factors (Kendler et al. 2003; Kendler et al. 2011a; Krueger et al. 2002). Especially in the 3-class model, SNPs classified into the AD+ASP class, which was characterized by stronger associations with two externalizing phenotypes (AD and ASP) but not with MD, an internalizing phenotype, may represent a cluster of SNPs that affect externalizing disorders broadly. Thus, this cluster of SNPs may represent part of the molecular genetic basis for the shared latent genetic factor observed in twin studies. The MD class, which was distinguished from the AD+ASP class by relatively stronger association with MD only, more likely represents a cluster of SNPs that may reflect the internalizing genetic factor.
The pattern of SNPs classified into varying numbers of classes further supported the existence of clusters of SNPs corresponding to externalizing and internalizing genetic factors, especially between 3- and 4-class models. The AD+ASP class in the 3-class model split into AD or ASP classes in the 4-class model. However, almost no overlap (0.3% of SNPs) was observed between the AD+ASP class from the 3-class model, and the MD class identified in the 4-class model. SNPs in the MD class from the 3-class model mostly (83.4%) remained in the MD class in the 4-class model. This pattern of classification broadly reflects the hierarchical factor structure identified from factor analyses (Krueger 1999; Krueger et al. 2001; Krueger and Markon 2006) and twin studies (Kendler et al. 2003; Kendler et al. 2011a; Krueger et al. 2002). These findings suggest that the application of LPA to SNP association results across multiple disorders may be a promising approach to identify clusters of SNPs that are associated with related phenotypes. While the cross-tabulations of class memberships between 2- to 4-class models matched our expectation, some instability of class memberships were observed between LPA models with different number of classes. For example, 5.7–6.6% of SNPs in the Null class were classified into non-null classes, and 6.3–10.5% of SNPs in non-null classes were classified into the null class with increasing number of classes. Because Table 3 is based on the most likely memberships, SNPs with unstable memberships are likely to be in the edge of the given class where it overlap with other classes. Decreasing entropy values with increasing number of classes in Table 1 may indicate that the overlap between classes increases as the number of classes increase.
Limitations and future directions
An assumption of LPA, within-class normality, may not be met in our data. We examined the univariate distributions of class indicators within each class based on most likely class memberships, and they largely deviated from normality. Applying mixture models to true non-normally distributed indicators may result in the identification of spurious classes without meaningful interpretation (Bauer and Curran 2003; Lubke and Neale 2006). In addition, if the true distribution of the Null class is the uniform distribution across the range of class indicators, LPA with conditional normality assumption would result in underestimation of the Null classes by forcing the identification of classes with high and low mean profiles. However, it should also be noted that statistically distinguishing between single-class non-normal and multi-class normal data may not be possible (Bauer and Curran 2003; Muthén 2003). To check whether relaxing the normality assumption results in a different number of classes, we tried to fit LPA models with skewed t-distribution. However, estimating this model was extremely slow, likely due to the large number of SNPs, and the model never converged. On the other hand, clusters from k-means clustering, which does not assume conditional normality, had comparable profiles and proportions to LPA results. Although the sphericity assumption of k-means, which assumes the same within-cluster variance, may also not be appropriate for the distance metric used our analysis, −log10(p-values), the consistency of results from methods that require different sets of assumptions may indicate that classes identified in LPA are robust to the violations of assumptions. As pointed in Muthén (2003), the interpretation of classes identified from latent categorical variable models is rather a substantive question, and incorporating substantive knowledge is an important step to validate identified classes. Consistency of classes identified in our study with the expectation based on twin studies provides a theoretical support in interpreting identified classes. Further investigation of identified classes utilizing auxiliary information, such as predicting class membership by covariates or using class memberships to predict distal outcomes, would be important step to validate classification results.
The local independence assumption of LPA requires class indicators to be uncorrelated within each class. However, some indicators are moderately correlated within the classes identified in our analysis. We examined the within-class correlations between indicators based on most-likely class memberships from the 3-class model. The correlations between indicators in overall sample, ranged between 0.148 and 0.302, were reduced within each class, ranging between 0.009 and 0.219. However, some correlations, such as between AD and ASP (0.219) in the MD class and between MD and ASP (0.197) in the AD+ASP class, for example, remained substantial. This pattern of within-class correlation may indicate an extra source of correlations between the p-values other than the classes. LD structure may not likely be the cause because within-class correlations with the pruned (r2 = 0.1) set of SNPs showed similar patterns of within-class correlations to full set of SNPs. To incorporate common variance within classes, we fit the 3-class model with within-class residual covariance between indicators allowed. The result indicated no noticeable change in class proportions and profiles. Estimated residual correlations were substantial especially between AD and ASP in the Null and MD classes, 0.205 and 0.223, respectively, and between MD and ASP, in the MD and AD+ASP classes, 0.177 and 0.181, respectively. Although our analysis indicated an unexplained source of correlations between indicators, the stability of results with or without residual covariance may indicate that the classes we identified are stable regardless of local independence assumption.
Further investigation on different indicators for LPA might be able to refine the classification of SNPs. We used −log10(p) as an index of association strength and used them as class indicator for LPA among other possible class indicators for the reasons described in the methods section. In a post hoc analyses, we fit the same LPA models to alternative class indicators: raw p-values, absolute values of beta coefficients, and absolute values of t-statistics. Beta coefficients were also standardized to make interpretation of resulting classes more straightforward, given that linear transformations of class indicators do not affect the estimation of classes (Magidson and Vermunt 2002). The results of 3-class LPA using beta, raw p-values and t statistics are provided in the supplementary material (Table S3). As expected, only LPA results using t statistics as indicators showed consistent patterns of classifications to the results from using −log10(p). Although −log10(p) may be more appropriate for LPA than alternatives considered, searching for class indicators that can better represent association strengths and distinguish between SNPs would be an important step to elaborate our initial results.
Expanding and refining phenotypes would further elaborate the results of current study. Specifically, MD was the only internalizing disorder included in this study. Although a class for MD contains a set of SNPs distinctive from the AD+ASP class, the MD class alone may not fully represent internalizing disorders. Identification of a class of SNPs for multiple internalizing disorders, such as anxiety disorder or phobia in addition to MD, would confirm the cluster of SNPs corresponding to the internalizing genetic factor. In addition, twin studies have indicated that the externalizing and internalizing genetic factors may not be completely exclusive in influencing each disorder. Externalizing and internalizing genetic factors may be correlated (Kendler et al. 2011b), or cross loadings may exist for a single disorder from both internalizing and externalizing genetic factors (Kendler et al. 2003). Moreover, it is possible that subtypes of a disorder may have different genetic factors as indicated by, for example, studies on internalizing subtypes of AD (Edwards et al. 2014; McCarty et al. 2012; Needham 2007). However, these possibilities were not considered in this study.
Although the results of our analysis are consistent with the conclusion from twin studies that SNPs cluster according to hierarchical genetic factors, this study only provides a groundwork for further studies as a proof of principle. Simulations and replications are needed to fully validate these results. We focused our interpretation on 2- and 4-class models based on twin findings, but the optimal number of classes was not clear based upon commonly accepted criteria. Determining the optimal number of classes depends not only on the underlying mechanism being continuous or categorical, but also on adequacy of assumptions, parameter specifications, and characteristics of data, such as sample size and the scales of responses (Lubke and Miller 2015; Lubke and Neale 2006). Further simulations with varying genetic architecture would be needed to validate the clusters of SNPs correspond to the structure of comorbid phenotypes observed in our study. In addition, while previous studies on genetic architecture of comorbid psychiatric disorders are based on general population samples (Kendler et al. 2003; Kendler et al. 2011a; Krueger et al. 2002), our sample was ascertained based on AD diagnosis and ancestry information (Edenberg et al. 2010). The next step to confirm the similarity of genetic architecture between different populations would be to replicate the results in independent epidemiological samples.
Classifying SNPs based on their association patterns also lends itself to several additional possible follow-up analyses. Examining the function of the clusters of SNPs associated with multiple outcomes may be informative as to shared underlying pathways that contribute to their etiologies. For example, gene set enrichment analysis (GSEA) (Zhang et al. 2010, 2014) could be conducted to test whether certain genetic pathways are overrepresented in the clusters of SNPs identified in the LPA. Clusters of SNPs identified may also be used to construct polygene scores for use in other analyses or datasets that aim to characterize developmental changes associated with genetic effects and/or gene-environment interaction (Salvatore et al. 2014a, b).
Conclusion
This study presents a novel way to utilize GWAS results from multiple disorders to better understand genetic variation shared across comorbid disorders. Classifying SNPs based on their patterns of associations with multiple disorders may enable investigators to identify clusters of genes that impact clusters of behavioral outcomes. Our results suggested that large numbers of genetic variants are collectively associated with multiple disorders, and classification based on association patterns may provide a useful tool to investigate these relationships.
Supplementary Material
Acknowledgments
We thank our collaborators of Collaborative Study on the Genetics of Alcoholism (COGA) for sharing their valuable ideas and feedback that helped complete this study.
Funding
Funding support for GWAS genotyping performed at the Johns Hopkins University Center for Inherited Disease Research was provided by the National Institute on Alcohol Abuse and Alcoholism, the NIH GEI (U01HG004438), and the NIH contract “High throughput genotyping for studying the genetic contributions to human disease” (HHSN268200782096C). GWAS genotyping was also performed at the Genome Technology Access Center in the Department of Genetics at Washington University School of Medicine which is partially supported by NCI Cancer Center Support Grant #P30 CA91842 to the Siteman Cancer Center and by ICTS/CTSA Grant# UL1RR024992 from the National Center for Research Resources (NCRR), a component of the National Institutes of Health (NIH), and NIH Roadmap for Medical Research.
Footnotes
Edited by Gitta Lubke.
Electronic Supplementary Material The online version of this article (doi:10.1007/s10519-017-9844-4) contains supplementary material, which is available to authorized users.
Compliance with ethical standards
Conflict of interest
Seung Bin Cho, Fazil Aliev, Shaunna L. Clark, Amy E. Adkins, Howard J. Edenberg, Kathleen K. Bucholz, Bernice Porjesz and Danielle M. Dick declares that they have no conflict of interest.
Ethical approval
All procedures performed in studies involving human participants were in accordance with the ethical standards of the institutional and/or national research committee and with the 1964 Helsinki declaration and its later amendments or comparable ethical standards.
Informed consents
Informed consent was obtained from all individual participants included in this study.
References
- Akaike H. Factor anslysis and AIC. Psychometrika. 1987;52(3):317–332. [Google Scholar]
- American Psychiatric Association. Diagnostic and Statistical Manual of Mental Disorders. 3rd. American Psychiatric Association Press; Washington, DC: 1987. Revised. [Google Scholar]
- American Psychiatric Association. Diagnostic and Statistical Manual of Mental Disorders. 4th. American Psychiatric Association Press; Washington, DC: 2000. Revised. [Google Scholar]
- Bauer DJ, Curran PJ. Distributional assumptions of growth mixture models: implications for overextraction of latent trajectory classes. Psychol Methods. 2003;8(3):338–363. doi: 10.1037/1082-989X.8.3.338. [DOI] [PubMed] [Google Scholar]
- Benke KS, Nivard MG, Velders FP, Walters RK, Pappa I, Scheet PA, et al. A genome-wide association meta-analysis of preschool internalizing problems. J Am Acad Child Adolesc Psychiatry. 2014;53(6):667–676. doi: 10.1016/j.jaac.2013.12.028. [DOI] [PubMed] [Google Scholar]
- Bucholz KK, Cadoret R, Cloninger CR, Dinwiddie SH, Hesselbrock VM, Nurnberger JI, et al. A new, semi-structured psychiatric interview for use in genetic linkage studies: a report on the reliability of the SSAGA. J Stud Alcohol Drugs. 1994;55(2):149. doi: 10.15288/jsa.1994.55.149. [DOI] [PubMed] [Google Scholar]
- Bulik-Sullivan B, Finucane HK, Anttila V, Gusev A, Day FR, Loh P, et al. An atlas of genetic correlations across human diseases and traits. Nat Genet. 2015a;47(11):1236–1241. doi: 10.1038/ng.3406. [DOI] [PMC free article] [PubMed] [Google Scholar]
- Bulik-Sullivan BK, Loh P, Finucane HK, Ripke S, Yang J, Patterson N, et al. LD Score regression distinguishes confounding from polygenicity in genome-wide association studies. Nat Genet. 2015b;47(3):291–295. doi: 10.1038/ng.3211. [DOI] [PMC free article] [PubMed] [Google Scholar]
- Celeux G, Soromenho G. An entropy criterion for assessing the number of clusters in a mixture model. J Classif. 1996;13(2):195–212. [Google Scholar]
- Derringer J, Corley RP, Haberstick BC, Young SE, Demmitt BA, Howrigan DP, et al. Genome-wide association study of behavioral disinhibition in a selected adolescent sample. Behav Genet. 2015;45(4):375–381. doi: 10.1007/s10519-015-9705-y. [DOI] [PMC free article] [PubMed] [Google Scholar]
- Dick DM, Aliev F, Wang JC, Grucza RA, Schuckit M, Kuperman S, et al. Using dimensional models of externalizing psychopathology to aid in gene identification. Arch Gen Psychiatry. 2008;65(3):310–318. doi: 10.1001/archpsyc.65.3.310. [DOI] [PubMed] [Google Scholar]
- Edenberg HJ, Koller DL, Xuei X, Wetherill L, McClintick JN, Almasy L, et al. Genome-wide association study of alcohol dependence implicates a region on chromosome 11. Alcohol Clin Exp Res. 2010;34(5):840–852. doi: 10.1111/j.1530-0277.2010.01156.x. [DOI] [PMC free article] [PubMed] [Google Scholar]
- Edwards AC, Latendresse SJ, Heron J, Cho SB, Hickman M, Lewis G, et al. Childhood internalizing symptoms are negatively associated with early adolescent alcohol use. Alcohol Clin Exp Res. 2014;38(6):1680–1688. doi: 10.1111/acer.12402. [DOI] [PMC free article] [PubMed] [Google Scholar]
- Feighner JP, Robins E, Guze SB, Woodruff RA, Winokur G, Munoz R. Diagnostic criteria for use in psychiatric research. Arch Gen Psychiatry. 1972;26(1):57–63. doi: 10.1001/archpsyc.1972.01750190059011. [DOI] [PubMed] [Google Scholar]
- Gibson WA. Three multivariate models: Factor analysis, latent structure analysis, and latent profile analysis. Psychometrika. 1959;24(3):229–252. [Google Scholar]
- Gunderson KL, Steemers FJ, Ren H, Ng P, Zhou L, Tsan C, et al. Whole-genome genotyping. Methods Enzymol. 2006;410:359–376. doi: 10.1016/S0076-6879(06)10017-8. [DOI] [PubMed] [Google Scholar]
- Hall P, Dean J, Kabul IK, Silva J. An overview of machine learning with SAS® enterprise miner™. SAS Institute Inc; Cary NC: 2014. [Google Scholar]
- Hesselbrock M, Easton C, Bucholz KK, Schuckit M, Hesselbrock V. A validity study of the SSAGA-a comparison with the SCAN. Addiction. 1999;94(9):1361–1370. doi: 10.1046/j.1360-0443.1999.94913618.x. [DOI] [PubMed] [Google Scholar]
- Kendler KS, Prescott CA, Myers J, Neale MC. The structure of genetic and environmental risk factors for common psychiatric and substance use disorders in men and women. Arch Gen Psychiatry. 2003;60(9):929–937. doi: 10.1001/archpsyc.60.9.929. [DOI] [PubMed] [Google Scholar]
- Kendler KS, Aggen SH, Knudsen GP, Røysamb E, Neale MC, Reichborn-Kjennerud T. The structure of genetic and environmental risk factors for syndromal and subsyndromal common DSM-IV axis I and all axis II disorders. Am J Psychiatry. 2011a;168(1):29–39. doi: 10.1176/appi.ajp.2010.10030340. [DOI] [PMC free article] [PubMed] [Google Scholar]
- Kendler KS, Kalsi G, Holmans PA, Sanders AR, Aggen SH, Dick DM, et al. Genomewide association analysis of symptoms of alcohol dependence in the molecular genetics of schizophrenia (MGS2) control sample. Alcohol Clin Exp Res. 2011b;35(5):963–975. doi: 10.1111/j.1530-0277.2010.01427.x. [DOI] [PMC free article] [PubMed] [Google Scholar]
- Krueger RF. The structure of common mental disorders. Arch Gen Psychiatry. 1999;56(10):921–926. doi: 10.1001/archpsyc.56.10.921. [DOI] [PubMed] [Google Scholar]
- Krueger RF, Markon KE. Understanding psychopathology: melding behavior genetics, personality, and quantitative psychology to develop an empirically based model. Curr Dir Psychol Sci. 2006;15(3):113–117. doi: 10.1111/j.0963-7214.2006.00418.x. [DOI] [PMC free article] [PubMed] [Google Scholar]
- Krueger RF, McGue M, Iacono WG. The higher-order structure of common DSM mental disorders: internalization, externalization, and their connections to personality. Personal Individ Differ. 2001;30(7):1245–1259. [Google Scholar]
- Krueger RF, Hicks BM, Patrick CJ, Carlson SR, Iacono WG, McGue M. Etiologic connections among substance dependence, antisocial behavior and personality: Modeling the externalizing spectrum. J Abnorm Psychol. 2002;111(3):411–424. [PubMed] [Google Scholar]
- Lazarsfeld PF, Henry NW. Latent structure analysis. Houghton Mifflin; Boston: 1968. [Google Scholar]
- Lo Y, Mendell NR, Rubin DB. Testing the number of components in a normal mixture. Biometrika. 2001;88(3):767–778. [Google Scholar]
- Lubke GH, Miller PJ. Does nature have joints worth carving? A discussion of taxometrics, model-based clustering and latent variable mixture modeling. Psychol Med. 2015;45(04):705–715. doi: 10.1017/S003329171400169X. [DOI] [PMC free article] [PubMed] [Google Scholar]
- Lubke G, Neale MC. Distinguishing between latent classes and continuous factors: resolution by maximum likelihood? Multivar Behav Res. 2006;41(4):499–532. doi: 10.1207/s15327906mbr4104_4. [DOI] [PubMed] [Google Scholar]
- Magidson J, Vermunt J. Latent class models for clustering: A comparison with K-means. Canadian J Market Res. 2002;20(1):36–43. [Google Scholar]
- McCarty CA, Wymbs BT, King KM, Mason WA, Van der Stoep A, McCauley E, et al. Developmental consistency in associations between depressive symptoms and alcohol use in early adolescence. J Stud Alcohol Drugs. 2012;73(3):444–453. doi: 10.15288/jsad.2012.73.444. [DOI] [PMC free article] [PubMed] [Google Scholar]
- McGue M, Zhang Y, Miller MB, Basu S, Vrieze S, Hicks B, et al. A genome-wide association study of behavioral disinhibition. Behav Genet. 2013;43(5):363–373. doi: 10.1007/s10519-013-9606-x. [DOI] [PMC free article] [PubMed] [Google Scholar]
- McLachlan G, Peel D. Finite mixture models. Wiley; New Jersey: 2004. [Google Scholar]
- Muthén B. Statistical and substantive checking in growth mixture modeling: comment on Bauer and Curran (2003) Psychol Methods. 2003;8(3):369–377. doi: 10.1037/1082-989X.8.3.369. [DOI] [PubMed] [Google Scholar]
- Muthén LK, Muthén BO. Mplus user’s guide. 7th. Muthén & Muthén; Los Angeles, CA: 1998–2012. [Google Scholar]
- Needham BL. Gender differences in trajectories of depressive symptomatology and substance use during the transition from adolescence to young adulthood. Soc Sci Med. 2007;65(6):1166–1179. doi: 10.1016/j.socscimed.2007.04.037. [DOI] [PubMed] [Google Scholar]
- Purcell S, Neale B, Todd-Brown K, Thomas L, Ferreira MA, Bender D, et al. PLINK: a tool set for whole-genome association and population-based linkage analyses. Am J Hum Genet. 2007;81(3):559–575. doi: 10.1086/519795. [DOI] [PMC free article] [PubMed] [Google Scholar]
- Purcell SM, Wray NR, Stone JL, Visscher PM, O’Donovan MC, Sullivan PF, et al. Common polygenic variation contributes to risk of schizophrenia and bipolar disorder. Nature. 2009;460(7256):748–752. doi: 10.1038/nature08185. [DOI] [PMC free article] [PubMed] [Google Scholar]
- Salvatore JE, Aliev F, Bucholz K, Agrawal A, Hesselbrock V, Hesselbrock M, et al. Polygenic risk for externalizing disorders gene-by-development and gene-by-environment effects in adolescents and young adults. Clin Psychol Sci. 2014a;3(2):189–201. doi: 10.1177/2167702614534211. [DOI] [PMC free article] [PubMed] [Google Scholar]
- Salvatore JE, Aliev F, Edwards AC, Evans DM, Macleod J, Hickman M, et al. Polygenic scores predict alcohol problems in an independent sample and show moderation by the environment. Genes. 2014b;5(2):330–346. doi: 10.3390/genes5020330. [DOI] [PMC free article] [PubMed] [Google Scholar]
- Schwarz G. Estimating the dimension of a model. Ann Stat. 1978;6(2):461–464. [Google Scholar]
- Yang J, Benyamin B, McEvoy BP, Gordon S, Henders AK, Nyholt DR, et al. Common SNPs explain a large proportion of the heritability for human height. Nat Genet. 2010;42(7):565–569. doi: 10.1038/ng.608. [DOI] [PMC free article] [PubMed] [Google Scholar]
- Yang J, Lee SH, Goddard ME, Visscher PM. GCTA: a tool for genome-wide complex trait analysis. Am J Hum Genet. 2011;88(1):76–82. doi: 10.1016/j.ajhg.2010.11.011. [DOI] [PMC free article] [PubMed] [Google Scholar]
- Zhang K, Cui S, Chang S, Zhang L, Wang J. i-GSEA4GWAS: a web server for identification of pathways/gene sets associated with traits by applying an improved gene set enrichment analysis to genome-wide association study. Nucleic Acids Res. 2010;38:W90–W95. doi: 10.1093/nar/gkq324. Web Server issue. [DOI] [PMC free article] [PubMed] [Google Scholar]
- Zhang K, Chang S, Guo L, Wang J. I-GSEA4GWAS v2: a web server for functional analysis of SNPs in trait-associated pathways identified from genome-wide association study. Protein Cell. 2014:1–4. doi: 10.1007/s13238-014-0114-4. [DOI] [PMC free article] [PubMed] [Google Scholar]
Associated Data
This section collects any data citations, data availability statements, or supplementary materials included in this article.