Abstract.
We investigate and demonstrate the feasibility of using a combined Raman scattering (RS) spectroscopy and low-coherence interferometry (LCI) probe to differentiate microbial pathogens and improve our diagnostic ability of ear infections [otitis media (OM)]. While the RS probe provides noninvasive molecular information to identify and differentiate infectious microorganisms, the LCI probe helps to identify depth-resolved structural information as well as to guide and monitor positioning of the Raman spectroscopy beam for relatively longer signal acquisition times. A series of phantom studies, including the use of human middle ear effusion samples, were performed to mimic the conditions of in vivo investigations. These were also conducted to validate the feasibility of using this combined RS/LCI probe for point-of-care diagnosis of the infectious pathogen(s) in OM patients. This work establishes important parameters for future in vivo investigations of fast and accurate determination and diagnosis of infectious microorganisms in OM patients, potentially improving the efficacy and outcome of OM treatments, and importantly reducing the misuse of antibiotics in the presence of viral infections.
Keywords: biomedical optics instrumentation, optical diagnostics for medicine, optical coherence tomography, Raman spectroscopy
1. Introduction
A middle ear infection, or otitis media (OM), is a highly prevalent disease, especially for young children. It has been documented that more than 75% of children will have had at least one episode of OM by age 3, and many children will have recurrent or chronic OM.1 Problematic symptoms of OM include otalgia (ear pain), otorrhea (drainage of fluid from the ear), fever, and impaired hearing. The current diagnostic method of OM primarily relies on the presence of these symptoms and the observation of abnormalities in the physical characteristics of the tympanic membrane (TM) (the ear drum), such as bulging or retraction, erythema (redness), and/or the presence of a middle ear effusion.2 In primary care and pediatric clinics, a traditional otoscope is normally used to assess the appearance of the TM, and pneumatic otoscopes and/or tympanometers can also be used to provide additive information regarding the presence of an effusion behind the TM. Recently, optical coherence tomography (OCT) and low-coherence interferometry (LCI) have emerged as enabling tools to provide physicians with more detailed three-dimensional (3-D) structural and biomechanical characteristics of the TM and any biofilm or effusion that may be present.3–6 These advanced technologies not only improve the diagnostic sensitivity and specificity of OM but also provide additional and meaningful pathological information, such as the presence of a bacterial biofilm or effusion behind the TM and within the middle ear cavity. With both well-established approaches and these emerging technologies, our ability to assess middle ear infections has the potential to be improved considerably for otolaryngologists, primary care physicians, and pediatricians.
In most cases, upon diagnosis of an ear infection, a prescription for general antibiotics is often the initial treatment, along with pain medication when necessary.2 Without knowing the cause of the infection, a broad-spectrum antibiotic, such as amoxicillin, is often the best choice for the initial prescription. However, clinical data suggest that antibiotic therapy is only effective for one-third of OM patients and not for the other two-thirds of cases that could likely be caused by antibiotic resistant bacteria or more likely, viral pathogens.1 The unnecessary administration and overprescription of antibiotics render multiple detrimental consequences, including clinical side effects, wasting of medical resources, and more importantly, the development of antibiotic resistance due to the overexposure and misuse of antibiotics.7,8 Therefore, identification of the infectious source of OM is critically needed, which will not only eliminate unnecessary administration of antibiotics, but more importantly, improve efficacy of the treatment and management of this prevalent disease.
Unfortunately, there is currently no rapid and effective approach available to determine the infectious sources of OM, i.e., the bacterial and/or viral microorganisms. Currently, to identify the infectious agent(s), middle ear fluid must be collected surgically (e.g., tympanocentesis) by passing a needle through the TM and into the middle ear space where the effusion is aspirated and collected. Subsequently, the aspirated material must be cultured for at least 24 to 48 h and then examined via microbial analysis procedures.2,9 This invasive and time-consuming procedure is only recommended for rare OM cases that have severe and persistent symptoms. Except for the tedious, risky, and time-consuming analyses of the surgically extracted middle ear effusion, rapid and accurate identification of the infectious pathogens in OM remains a great challenge in the diagnosis and management of this common disease.
Raman scattering (RS) spectroscopy is a diagnostic technique that has been used to analyze the molecular fingerprint features of biological tissues and samples. The use of RS spectroscopy to differentiate microbial pathogens, especially bacterial species and strains, has been demonstrated by many groups over the past few decades.10–13 Since the RS signal is extremely weak, several signal enhancing methods have been explored to improve the detection sensitivity. These enhanced Raman technologies, such as surface-enhanced Raman spectroscopy (SERS)14,15 and resonance Raman spectroscopy,16,17 help to identify pathological microorganisms in low concentrations. These enhanced detection capabilities offer important benefits for rapid or online detection, although these approaches can hardly be used for in vivo investigations. Alternatively, microscopic Raman spectroscopy, such as confocal Raman spectroscopy, can be used for single-cell level analysis of microorganisms.18,19 Due to the spatial confinement effect of an optical beam in a high-numerical aperture (NA) system, this approach can more efficiently collect the RS signal as well as suppress background signals. Microscopic Raman spectroscopy provides the benefits for rapidly identifying and differentiating bacterial species and strains without the need for culturing the microorganisms to increase their effective concentrations. However, due to the tight focus and small excitation volume in confocal RS studies, pathogens are often required to be immobilized,20,21 which is also not appropriate for in vivo investigation of microbial pathogens that are present in body fluids, such as blood, urine, mucus, and middle ear effusions. Therefore, it still remains challenging to use RS spectroscopy for the identification of infectious pathogens in natural or untreated samples in clinical settings, or for clinical diagnosis (e.g., in vivo body fluids).22
In this study, we investigate the potential and feasibility of using combined RS spectroscopy and LCI for the real-time detection and differentiation of pathological microorganisms in the middle ear. We have developed a fiber-based RS/LCI probe that can be inserted into the ear canal for real-time, point-of-care diagnosis of microbial pathogens present in middle ear infections. To demonstrate this concept, we designed phantom studies that mimic the conditions of an infected middle ear where an effusion is present behind the TM. Our initial results demonstrate the feasibility of the combined RS/LCI probe for noninvasive differentiation of bacterial or viral OM in point-of-care settings.
2. System Design and Experimental Setup
The goal of this work is to investigate the feasibility of developing and using a combined RS/LCI probe that can be inserted into the ear canal to analyze the infectious microorganisms that may be present in an effusion behind the TM of OM patients. During the design of this probe, considerations were made to optimize the Raman signal detection efficiency and the reproducibility of the analysis under the constraints given by the anatomy of the middle ear and the motion that may occur in future in vivo human studies.
First, under in vivo conditions, the NA of the probe is restricted due to the physical dimensions of the ear canal, although a high-NA system is preferable for high signal collection efficiency. For patient safety and comfort during the procedure, the tip of the probe should be placed at least a few millimeters (e.g., larger than 5 mm) away from the TM. The outer diameter of the probe is also restricted to less than 5 mm due to the diameter of the ear canal. As a result, the NA of an RS/LCI probe for in vivo and point-of-care investigations is limited to around 0.4 or less. In fact, for in vivo identification and differentiation of microbial pathogens, a high-NA microscopic scheme may not be an optimal or preferable solution. Due to the intrinsic movement of the microorganisms and the motion of the patient, the collected RS signal could vary substantially over time since the pathogens can move in and out of the focal region. Obviously, this effect is more prominent for a high-NA microscopy system that has a tight focus and thus a small interaction volume.
Since the RS signal is weak, especially when collected by a miniature probe with a low NA, a long signal acquisition time may be needed. In this case, we designed the use of LCI in the probe that can be used to guide the positioning of the RS signal collection to increase the sensitivity and accuracy of the measurement. The structural information of the LCI axial depth scans also add additional data for the diagnosis of the disease, such as the presence of a scattering middle ear effusion and/or biofilm.4,6 In the design of the probe, the optimal overlap of the foci of the RS and LCI beams is required.
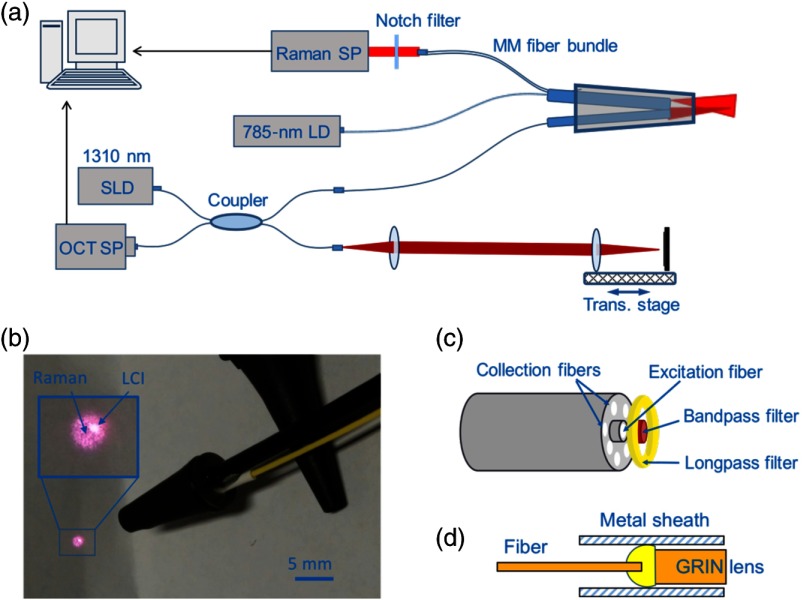
The schematic setup of the combined RS/LCI probe and system is shown in Fig. 1. The RS system consists of a diode laser (SWL-7500-P, New Focus), a spectrometer (IsoPlane 160, Princeton Instruments), and a fiber probe (EmVission LLC). The diode laser outputs continuous wave 785-nm light with a maximum power of 60 mW. The excitation laser was coupled into a multimode fiber with a core size of . At the distal end of the probe, the excitation fiber was surrounded by seven collection fibers. The core size of the collection fibers was . A circular-shaped bandpass filter was placed in front of the excitation fiber to block the RS background from the fiber. An annular ring-shaped longpass filter was also placed in front of the collection fibers to block the Rayleigh scattered excitation laser light, which would otherwise generate an RS background in the collection fibers. Although the potential background signal generated in the fibers may be subtracted numerically from the spectrum containing the discrete Raman peaks, the background suppression filters were important because this strong background would introduce substantial shot noise to the measurements. The fibers and filters were glued together with epoxy and the tip was encapsulated in a stainless steel blunt needle tube with an outer diameter of 2.1 mm. The rigid stainless steel tube was 15-mm long, and the length of the fibers was about 3 m. At the proximal end, the seven collection fibers were arranged in a line configuration, and the line structure of the fibers was imaged onto the slit of the spectrometer by a 30-mm focal length achromatic lens. The spectrometer provided a maximum resolution of about at 850 nm with a slit width of . The Raman spectra were collected by a back-illumination CCD (ProEM 1600, Princeton Instruments). The etalon effect of the CCD was numerically removed based on a calibration curve, which was obtained by correcting a measured spectrum of a halogen lamp to a simulated blackbody emission spectrum. This calibration procedure for etalon correction was repeated for each experimental condition.
Fig. 1.
Schematic setup of the combined RS/LCI probe. (a) Schematic setup of the system. (b) Photograph of the combined RS/LCI probe encapsulated into a modified otoscope ear speculum. The inset shows a magnified view of the RS and LCI beam patterns. (c) Schematic of the RS components. (d) Schematic of the LCI components. SP, spectrometer; LD, laser diode; SLD, superluminescence diode; and MM, multimode.
The LCI system was based on a modified spectral-domain OCT system by replacing the sample arm with the fiber probe. The light source of the OCT system had a central wavelength of 1300 nm and a FWHM spectral bandwidth of 105 nm, which corresponded to an axial resolution of in air. The LCI portion of the probe was fabricated by gluing a 5-mm long, 0.29-pitch gradient index (GRIN) lens to the distal end of the fiber. The working distance of the LCI beam was about 6 mm. The sensitivity of the LCI system was measured to be about 86 dB, with an incident power of 3 mW and an A-scan line rate of 6 kHz. The GRIN lens was enclosed in a 16-gauge stainless steel blunt needle barrel with a length of .
The two distal fiber components (for RS and LCI) of the probe were finally inserted into a standard ear speculum tip with a diameter of 3.7 mm at the distal opening. The positions of the two fiber components were carefully adjusted so that the two laser beams overlapped (Fig. 1). The axial positions of the two fibers were adjusted to optimize Raman collection efficiency when a sample was placed slightly in front of the focal plane of the LCI fiber. The goal was to obtain the optimal Raman signal from the effusion or biofilm that would be located behind the TM when the LCI focus was located within the TM region.
3. Results
To investigate the feasibility of the combined RS/LCI probe for real-time diagnosis of microbial pathogens in middle ear infections, we designed and conducted the following phantom studies. First, to validate the capability of the RS/LCI probe to detect and differentiate bacterial pathogens, we collected Raman spectra of Pseudomonas aeruginosa (PSAG) and Streptococcus pneumoniae (SP), two of the most common bacterial microorganisms in human middle ear infections. Bacterial strains of PSAG (ATCC #14203) and SP (ST556, Case Western Reserve23) were cultured in growth media (ATCC media 44—Brain/heart infusion broth and Lysogeny broth, respectively) in an incubator (5% ) for at least 14 days.
The spectra were recorded with both the Raman fiber components and a commercial confocal Raman system (LabRam HR 3-D, Horiba). In the confocal Raman experiments, the bacterial samples were deposited onto a quartz slide and dried in air to immobilize the bacteria. During the collection of the Raman spectra, a , 0.95 NA objective was used to focus the excitation light onto single bacteria. Positioning of the laser focus was monitored under the reflection mode of the microscope. The excitation laser was at a 785 nm wavelength with an average power of on the sample. An integration time of 20 s was used to record the Raman data. Since the bacterial samples were very thin films deposited onto the surface of the quartz slide, during the data collection there was negligible absorption of the excitation light and no damage to the sample was noticed. A rapid photobleaching effect was observed, which helped suppress the autofluorescence background. In the Raman experiments using the fiber probe, the bacterial culture was contained in a quartz cuvette, and the probe was placed perpendicular and close (2- to 3-mm distance from the wall) to one of the clear side walls of the cuvette. In this case, the Raman excitation beam passed through the clear side wall of the cuvette and excited the bacteria solution. The spectra were integrated over 12 s and the laser power was at the sample. The raw spectra were processed by removing the fluorescence background in MATLAB® (MathWorks) based on a polynomial fitting algorithm.24 Two aliquots of each strain were prepared for each experimental condition, and 30 repeated measurements were collected for each experiment. During the preparation for the experiments, the samples were not washed, since the goal of this experiment was to investigate the feasibility of using the miniaturized Raman probe to differentiate bacterial species in the presence of possible interference from the environment, such as culture medium, body fluid, and surrounding tissue.
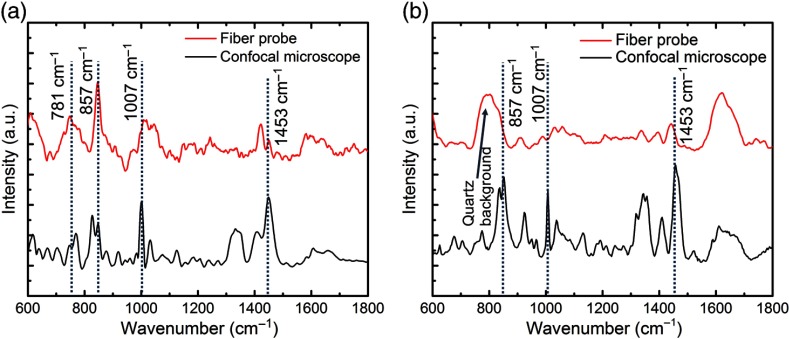
As shown in Fig. 2, the major features of the bacterial species are seen in both the RS fiber probe and confocal Raman spectra. These Raman features include the peaks at 781, 857, 1007, and , which can be assigned to uridine monophosphate and cytidine monophosphate, the amino acid tyrosine, symmetric benzene/pyrrole in-phase, and out-of-phase breathing modes of tryptophan and phenylalanine, and deformation vibrations, respectively.11 These Raman peaks were found to be consistent with the findings in previous studies.22,25 Moreover, the differences between the structures (e.g., relative peak intensities) of the spectra obtained from these two different bacterial species are clear, which demonstrate the capability of the Raman fiber probe to distinguish these two different microbial pathogens. There are some structural differences between the spectra recorded by the fiber probe and the confocal microscope, which were due to the difference in the conditions of the two experiments, such as the excitation and collection NA, the spectral resolution, and the sample culture conditions (the dried culture deposited on a microscope slide used in the confocal Raman experiment, and the culture solution contained in a quartz cuvette used in the Raman fiber probe measurement).26 Despite these different experimental parameters that are inherent in the requirements of the systems used, the characteristic Raman features (major peaks) are exhibited by spectra obtained based on both the Raman microscope and the Raman fiber probe.
Fig. 2.
RS spectra of (a) PSAG and (b) SP cultures obtained based on the Raman fiber probe and a bench top confocal Raman microscope.
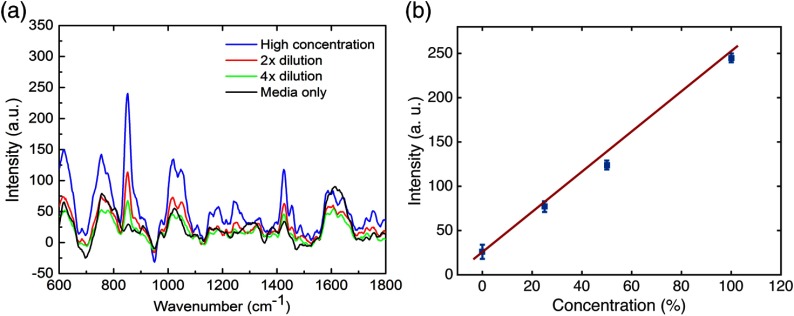
To further confirm that the major spectral features are associated with the bacteria rather than any other molecules in the culture media, we measured the Raman spectra with the fiber probe after adding fresh culture media to dilute the bacterial samples. As indicated by the spectral traces in Fig. 3, the intensities of the major Raman peaks are proportional to the concentrations of the bacterial samples, especially for the amino acid peak [Fig. 3(b)]. This data also suggest that the characteristic Raman features of the PSAG bacteria detectable with the Raman fiber probe are the spectral peaks of 857, 1007, and .
Fig. 3.
RS spectra of a PSAG culture recorded by the Raman fiber probe. (a) Raman spectra of different culture concentrations. (b) Intensity of the Raman peak versus culture concentration following successive dilutions with culture media. The initial concentration [high concentration in (a) and 100% in (b)] was estimated to be by counting the bacteria under a microscope. The 0% concentration in (b) indicates fresh culture media only (without bacteria).
For this feasibility study, we first used a high concentration of bacteria in our samples (estimated to be ), which were prepared by centrifuging the growth media and culture broth mixture at 3000 RPM for 5 min. The concentrated bacterial pellet was then transferred into appropriate fresh culture media of three times the volume of the centrifuged bacteria for spectroscopic measurements. Afterward, the samples were serially diluted by adding corresponding amounts of culture media as previously described.
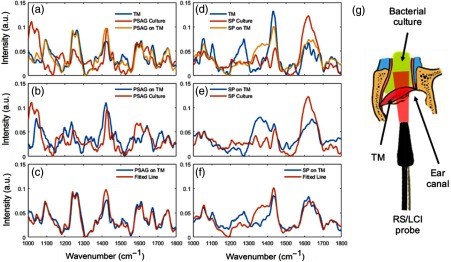
For in vivo use, one important issue will be the presence of the RS and fluorescence emission from the surrounding tissue, which may be a strong interfering light background. To investigate the effects of background emission and the potential performance of the Raman fiber probe during future in vivo use, we mimicked these conditions by aspirating a suspension of bacteria from culture and placing the suspension behind and onto freshly excised rat TM tissue. The rat TM tissue was obtained under a protocol approved by the Institutional Animal Care and Use Committee of the University of Illinois at Urbana–Champaign (UIUC). Raman spectra collected under this model condition are shown in Fig. 4. Figure 4(g) shows the physical arrangement of the bacterial suspension, the dissected ear canal with the TM intact, and the RS/LCI probe. It can be seen that although the SNR of the main Raman features of the two bacterial species are degraded due to the effects of the background signals, the two samples remain distinguishable by their spectra after extraction of the bacterial spectral information through multiple linear regressions. The major Raman spectral features shown in the background-subtracted spectra are highly consistent with those shown in the respective spectra collected from the cultures in the quartz cuvettes. This data suggest that the interference of the potential background from the TM and ear canal tissue to the Raman measurement under in vivo conditions may be manageable.
Fig. 4.
Raman spectra of PSAG/SP suspensions located behind a TM and obtained from the Raman fiber probe. A suspension of bacterial culture fluid was placed behind TMs from freshly dissected rat ear canal tissues. (a) RS spectra of the TM alone, of the PSAG culture alone, and of PSAG behind the TM. (b) Comparison of PSAG culture spectra and extracted PSAG information from spectra of PSAG on the TM through multiple linear regressions. (c) Comparison of the original spectrum from PSAG on the TM with the fitted line by the regression model. (d)–(f) Display and decomposition of Raman spectra of SP behind a TM. (g) Illustration of the arrangement of the bacterial culture fluid (top), dissected rat ear canal (middle), and the combined RS/LCI probe (bottom).
For the multiple linear regression process, the spectra acquired from the TM and PSAG/SP culture were used as basis spectra. Then, the spectrum acquired from PSAG/SP behind a TM was fitted with these two basis spectra using a nonnegative least-square regression model. Based on the coefficients obtained from the model fitting, the bacterial spectral content was extracted by subtracting the portion of the TM from the raw spectrum. The reliability of this method is demonstrated by the high degree of similarity between the fitted line and the raw spectrum in Figs. 4(c) and 4(f).
Large variation of the TM spectra was observed, which could be explained by the differences in the structure of the extracted ex vivo specimen, and the different positioning of the probe relative to the TM tissue. Due to the large size (several millimeters in diameter) of the diverged Raman excitation beam, which is larger than the diameter of the rat ear canal, different tissue contents could be excited in different experiments, which may result in large variations of the TM signals. However, it should be noted that this type of variation is inevitably present in in vivo or point-of-care applications. Therefore, it is important to see that the fiber Raman probe is capable of extracting discernible Raman signals even under the interference of the heterogeneous TM tissue background, as we demonstrated here.
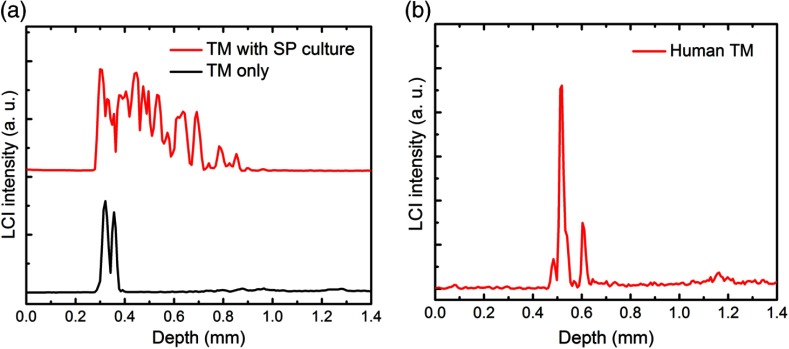
LCI data that provide the axial depth profiles of the sample were also collected under this condition, as shown in Fig. 5. This LCI data show the one-dimensional depth-resolved structure of the TM tissue and the presence of the scattering bacterial suspension. This simultaneously captured real-time LCI information can be used to monitor the location of the focus of the Raman beam and signal collection during future in vivo human patient studies. A typical LCI axial-scan depth profile of the TM of a healthy human volunteer is shown in Fig. 5(b).
Fig. 5.
LCI axial-scan depth profiles from (a) rat TM tissue with and without the SP bacterial suspension and (b) from the TM of a healthy human volunteer.
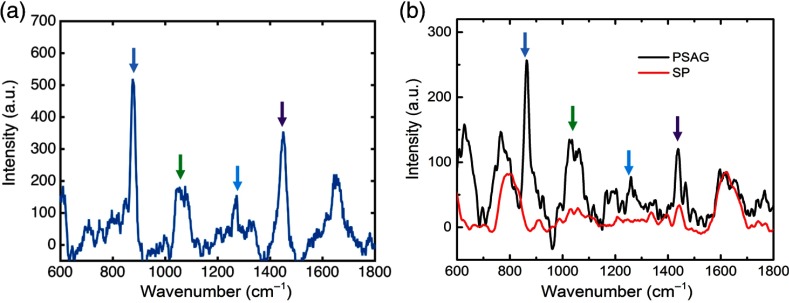
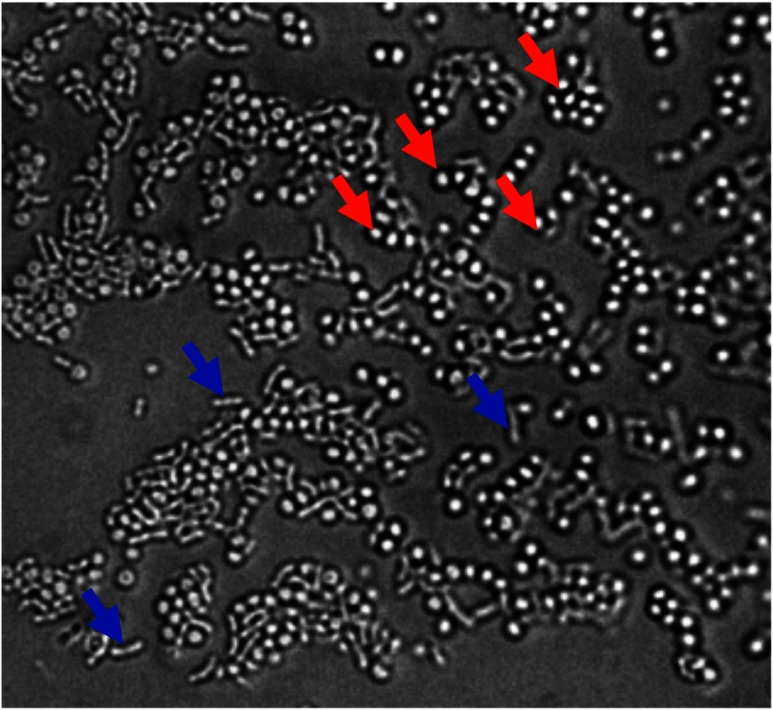
Infectious pathogens in middle ear infections reside frequently in the effusion behind the TM. For one of our validation experiments, we obtained a middle ear effusion sample from a human subject with an ear infection, who was undergoing surgery for the placement of a tympanostomy tube in the TM. The acquisition of optical measurements and middle ear effusions from human subjects was performed under a human studies protocol approved by the Institutional Review Boards of Carle Foundation Hospital (Carle IRB #08-02) and the UIUC (IRB #08261). Raman spectra were collected from this sample immediately after removal from the middle ear using the fiber probe to demonstrate the sensitivity of our system for future in vivo use. These results also suggest that additional time and culturing of removed samples was not necessary to increase the bacterial concentration, demonstrating the use of this methodology for true point-of-care diagnostics without the need for analysis in a pathology laboratory. The RS spectra shown here have a strong correlation with the Raman features presented in the spectra of the PSAG culture (Fig. 6). The Raman spectra were collected with a 15-s integration time and 45-mW excitation power. The presence of PSAG in the effusion sample was confirmed by microbial observation under an optical microscope (Fig. 7).
Fig. 6.
RS spectra of (a) a human middle ear effusion sample and (b) Raman spectra of PSAG and SP cultures in quartz cuvettes. The corresponding colored arrows indicate matching spectral peaks.
Fig. 7.
Microscopic image of a smear of the middle ear effusion sample identifying the bacterial species by their morphology. Blue arrows: PSAG and red arrows: Staphylococcus aureus.
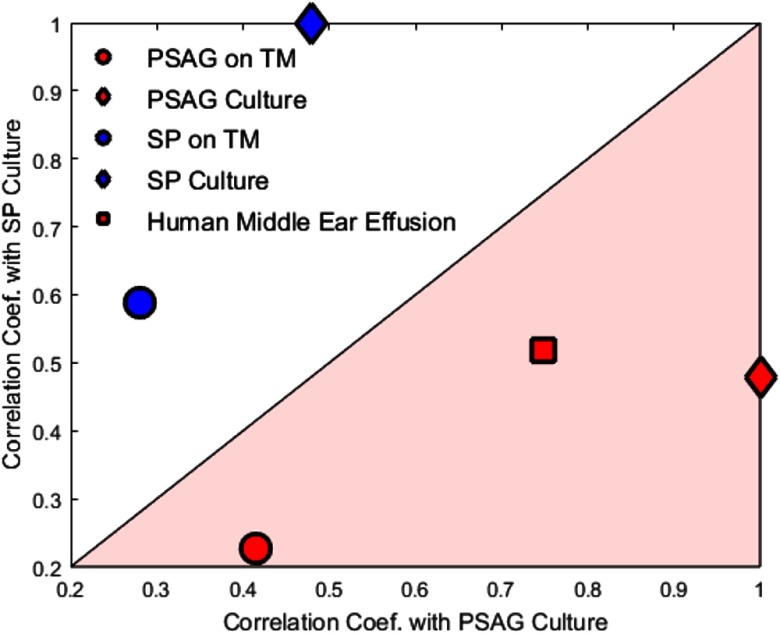
In addition, to test the consistency of the chemical information provided by the system in different environments, we performed a quantitative assessment of the correlation between PSAG and SP in culture, PSAG and SP on the rat TM, and the human middle ear effusion. As shown in Fig. 8, samples associated with PSAG fall in the pink area, which indicates a stronger correlation with the PSAG culture, while samples associated with SP fall in the white area, which indicates a stronger correlation with the SP culture. The Raman spectra from the human middle ear effusion show a predominance of peaks associated with PSAG, which is consistent with the microscopic observations of the effusion in Fig. 7. These results demonstrate the feasibility of this system for identifying and differentiating infectious pathogens in more complex polymicrobial effusions that will be encountered in clinical point-of-care situations.
Fig. 8.
Correlation results with PSAG and SP cultures from PSAG or SP on a rat TM, as well as a human middle ear effusion. The PSAG on TM and the SP on TM results were obtained from the extracted PSAG and SP results as shown in Fig. 4.
4. Discussion
The goal of this study was to investigate the feasibility of using a custom-built RS/LCI fiber probe to rapidly and accurately determine and differentiate the infectious pathogens in OM. While many previous studies have demonstrated the potential of RS in differentiating microbial species, in vivo investigations have been largely precluded due to the inherent limitations of the technology, which has often required the application of exogenous agents in SERS and/or the fixation of the specimen in microscopic Raman studies. In particular, Raman microscopy (e.g., confocal Raman microscopy) that utilizes high NAs to maximize collected Raman signals is often discussed in the literature as a promising technology for rapid and noninvasive identification of microorganisms. However, because this approach requires the bacterial targets to be confined within the small focal volume of the microscope, this technology is not suitable for detecting bacterial pathogens in body fluids, especially under in vivo conditions. One promising approach to overcome this obstacle could be to combine optical trapping technologies that confine the targeted cells under the microscope, but the in vivo applicability of this method is still unclear due to the high optical power needed for optical trapping and the complexity of the system.21,22 Therefore, it is still an open question whether RS-based technologies can be used for in vivo detection of infectious pathogens in clinical settings.
In this work, we designed a series of phantom experiments to mimic the conditions that will be encountered during in vivo investigations. The data collected in these experiments demonstrate the potential of this combined RS/LCI probe for fast and accurate identification and differentiation of bacterial pathogens, even without sophisticated (but often subjective) data analysis algorithms.27–29 The success of this approach may be attributed to several unique features of this particular application. First, the ear effusion where high-concentration infectious pathogens reside is readily accessible with the designed RS/LCI fiber probe. Second, the background signal that is mostly generated in the nearly-transparent TM tissue is relatively weak. Third, despite the relatively low NA of the fiber probe, the unfocused excitation beam is able to excite a large volume of the effusion, which leads to a high level of RS.
Moreover, we note that the sensitivity of the Raman system is not optimal but can be further improved by using a more sensitive CCD and a spectrometer with a higher throughput. A deep depletion CCD at a reasonable cost is now commercially available and can be used to mitigate this effect. A better spectrometer with a higher throughput can also be used to improve the signal collection efficiency of the system.
While these experiments successfully demonstrate the potential for using this LCI-guided RS probe to rapidly identify and differentiate bacterial pathogens in OM, we were not able to collect Raman spectra with sufficiently high SNR from virus samples using this RS/LCI probe. The Raman signals from the physically smaller viruses tend to be extremely weak, as demonstrated in earlier studies30 and by our own confocal Raman experiments (data not shown). Further investigations may be needed to answer whether it is technically feasible for this probe design to detect and differentiate viruses under either in vitro or in vivo conditions. Importantly, however, the rapid point-of-care detection and differentiation of bacterial species are the most essential data in the management of OM, since the presence and types of these bacterial species affect whether and what types of antibiotics should be prescribed. It would be clinically reasonable to assume that a child presenting with symptoms of OM, but with no bacterial Raman signatures present, would likely have viral OM, and therefore not require antibiotic treatment.
5. Conclusion
We have developed a custom combined RS/LCI fiber probe and have demonstrated the feasibility of using this as an ear canal insert (or ear-bud) for fast determination and differentiation of bacterial pathogens that would commonly be found in OM patients. The capability and performance of the system were tested and validated in phantom studies that were designed to mimic the conditions of in vivo measurements by using excised rat TM tissue and a human middle ear effusion sample. The data and analysis results demonstrate the feasibility and promise of using this technology for the real-time noninvasive point-of-care detection and diagnosis of the infectious causes of OM, along with the potential for using this technology in future in vivo studies.
Acknowledgments
We thank Darold Spillman for his technical, logistical, and information-technology support for this research. This research was supported in part by grants from the Center for Integration of Medicine and Innovative Technology (S.A.B. and R.L.S.), the National Institutes of Health (R01EB013723, S.A.B.), and the National Science Foundation (CBET 14-45111, S.A.B.). Additional information can be found at http://biophotonics.illinois.edu. Stephen Boppart, Ryan Shelton, and Ryan Nolan are cofounders of PhotoniCare, Inc., which is commercializing optical imaging devices for assessing ear infections. Conflict management plans are on file with the UIUC. All other authors have no conflicts of interest.
Biographies
Youbo Zhao received his BS degree in applied physics from Beijing Institute of Technology, Beijing, China, in 1997, and his PhD in optical engineering from Nankai University, Tianjin, China, in 2007. He was a postdoctoral research associate at the Biophotonics Imaging Laboratory, the University of Illinois at Urbana–Champaign (UIUC), Urbana, Illinois. His research interests include developing and using optical imaging technologies for biomedical studies.
Guillermo L. Monroy received his BS degree in computer engineering in 2011 and his MS degree in bioengineering in 2013 from the UIUC. Currently, he is a graduate research fellow (PhD candidate) at the Biophotonics Imaging Laboratory, working under the guidance of Professor Stephen Boppart. His current interests include the integration of advanced biomedical instrumentation and imaging techniques to improve diagnosis and treatment in healthcare.
Sixian You received her BS degree in optoelectronics information engineering from Huazhong University of Science and Technology and her MS degree in bioengineering from the UIUC. She has been developing optical imaging technologies for molecular disease detection. Her interests include multiphoton imaging, Raman spectroscopy and imaging, and the tumor microenvironment.
Ryan L. Shelton received his BS degree in electrical engineering from Oklahoma State University and his PhD in biomedical engineering from Texas A&M University. He has been developing medical imaging technologies for the past 10 years in clinical applications ranging across otology, ophthalmology, and dermatology. Currently, he leads PhotoniCare, a medical device firm developing diagnostic imaging technology for middle ear disease.
Ryan M. Nolan received his BS degree in bioengineering from the University of Pittsburgh and his MEng degree in biomedical engineering from Cornell University. He has extensive experience collaborating with physicians and hospitals developing innovative imaging technologies for integration into clinical environments. Currently, he is working to commercialize diagnostic imaging technology developed in Dr. Boppart’s Academic Research Lab alongside Ryan Shelton and has cofounded the startup company, PhotoniCare.
Haohua Tu received his BS degree in chemical engineering from Tsinghua University, Beijing, China, and his PhD in chemical engineering and material science from the University of Kentucky, Lexington. He has experience in optics, spectroscopy, biomedical imaging, and material/chemical engineering. Currently, he is using nonlinear fiber optics to develop a ultrafast fiber laser, and ultrashort pulse compression and shaping to implement clinical nonlinear optical imaging.
Eric J. Chaney received his BS degree in biology from the University of Evansville, Evansville, Indiana. He has worked as a research assistant at Indiana University School of Medicine, Indiana State University, Terre Haute, and then as a transmission electron microscope technician at the UIUC. Since 2000, he has been a research scientist in the Biophotonics Imaging Laboratory, Beckman Institute, UIUC.
Stephen A. Boppart is an Abel Bliss Professor of Engineering at the Departments of Electrical and Computer Engineering, Bioengineering, and Medicine, and head of the Biophotonics Imaging Laboratory at the Beckman Institute for Advanced Science and Technology. His interests include the development of optical imaging technologies for medical applications, with emphasis on translating these to clinical applications. He is a fellow of SPIE, IEEE, AAAS, OSA, and AIMBE.
References
- 1.Klein J. O., “Otitis media,” Clin. Infect. Dis. 19(5), 823–833 (1994). 10.1093/clinids/19.5.823 [DOI] [PubMed] [Google Scholar]
- 2.Lieberthal A. S., et al. , “The diagnosis and management of acute otitis media,” Pediatrics 131(3), e964–e999 (2013). 10.1542/peds.2012-3488 [DOI] [PubMed] [Google Scholar]
- 3.Monroy G. L., et al. , “Non-invasive depth-resolved optical measurement of the tympanic membrane and middle-ear for differentiating otitis media,” Laryngoscope 125(8), E276–E282 (2015). 10.1002/lary.v125.8 [DOI] [PMC free article] [PubMed] [Google Scholar]
- 4.Nguyen C. T., et al. , “Non-invasive in vivo optical detection of biofilm in the human middle ear,” Proc. Natl. Acad. Sci. U.S.A. 109(24), 9529–9534 (2012). 10.1073/pnas.1201592109 [DOI] [PMC free article] [PubMed] [Google Scholar]
- 5.Jung W., et al. , “Handheld optical coherence tomography scanner for primary care diagnostics,” IEEE Trans. Biomed. Eng. 58(3), 741–744 (2011). 10.1109/TBME.2010.2096816 [DOI] [PMC free article] [PubMed] [Google Scholar]
- 6.Monroy G. L., et al. , “Non-invasive optical assessment of viscosity of middle ear effusions in otitis media,” J. Biophotonics (2016). 10.1002/jbio.201500313 [DOI] [PMC free article] [PubMed] [Google Scholar]
- 7.Beringer P. M., Wong-Beringer A., Rho J. P., “Economic aspects of antibacterial adverse effects,” Pharmacoeconomics 13(1), 35–49 (1998). 10.2165/00019053-199813010-00004 [DOI] [PubMed] [Google Scholar]
- 8.Gonzales R., et al. , “Excessive antibiotic use for acute respiratory infections in the United States,” Clin. Infec. Dis. 33(6), 757–762 (2001). 10.1086/cid.2001.33.issue-6 [DOI] [PubMed] [Google Scholar]
- 9.Guven M., et al. , “Bacterial etiology of acute otitis media and clinical efficacy of amoxicillin–clavulanate versus azithromycin,” Int. J. Pediatr. Otorhinolaryngol. 70(5), 915–923 (2006). 10.1016/j.ijporl.2005.10.004 [DOI] [PubMed] [Google Scholar]
- 10.Maquelin K., et al. , “Identification of medically relevant microorganisms by vibrational spectroscopy,” J. Microbiol. Methods 51(3), 255–271 (2002). 10.1016/S0167-7012(02)00127-6 [DOI] [PubMed] [Google Scholar]
- 11.Harz M., Pösch P., Popp J., “Vibrational spectroscopy—a powerful tool for the rapid identification of microbial cells at the single-cell level,” Cytometry Part A 75(2), 104–113 (2009). 10.1002/cyto.a.v75a:2 [DOI] [PubMed] [Google Scholar]
- 12.Maquelin K., et al. , “Raman spectroscopic method for identification of clinically relevant microorganisms growing on solid culture medium,” Anal. Chem. 72(1), 12–19 (2000). 10.1021/ac991011h [DOI] [PubMed] [Google Scholar]
- 13.Huang W. E., et al. , “Raman microscopic analysis of single microbial cells,” Anal. Chem. 76(15), 4452–4458 (2004). 10.1021/ac049753k [DOI] [PubMed] [Google Scholar]
- 14.Jarvis R. M., Brooker A., Goodacre R., “Surface-enhanced Raman scattering for the rapid discrimination of bacteria,” Faraday Discuss. 132(281), 281–292 (2006). 10.1039/B506413A [DOI] [PubMed] [Google Scholar]
- 15.Jarvis R. M., Goodacre R., “Characterisation and identification of bacteria using SERS,” Chem. Soc. Rev. 37(5), 931–936 (2008). 10.1039/b705973f [DOI] [PubMed] [Google Scholar]
- 16.Nelson W. H., Manoharan R., Sperry J. F., “UV resonance Raman studies of bacteria,” Appl. Spectros. Rev. 27(1), 67–124 (1992). 10.1080/05704929208018270 [DOI] [Google Scholar]
- 17.López-Díez E. C., Goodacre R., “Characterization of microorganisms using UV resonance Raman spectroscopy and chemometrics,” Anal. Chem. 76(3), 585–591 (2004). 10.1021/ac035110d [DOI] [PubMed] [Google Scholar]
- 18.Schuster K. C., et al. , “Multidimensional information on the chemical composition of single bacterial cells by confocal Raman microspectroscopy,” Anal. Chem. 72(22), 5529–5534 (2000). 10.1021/ac000718x [DOI] [PubMed] [Google Scholar]
- 19.Rösch P., et al. , “The identification of microorganisms by micro-Raman spectroscopy,” J. Mol. Struct. 661, 363–369 (2003). 10.1016/j.molstruc.2003.06.004 [DOI] [Google Scholar]
- 20.Xie C., et al. , “Identification of single bacterial cells in aqueous solution using confocal laser tweezers Raman spectroscopy,” Anal. Chem. 77(14), 4390–4397 (2005). 10.1021/ac0504971 [DOI] [PubMed] [Google Scholar]
- 21.Chan J. W., “Recent advances in laser tweezers Raman spectroscopy (LTRS) for label-free analysis of single cells,” J. Biophotonics 6(1), 36–48 (2013). 10.1002/jbio.201200143 [DOI] [PubMed] [Google Scholar]
- 22.Stöckel S., et al. , “The application of Raman spectroscopy for the detection and identification of microorganisms,” J. Raman Spectrosc. 47(1), 89–109 (2015). 10.1002/jrs.4844 [DOI] [Google Scholar]
- 23.Joloba M. L., et al. , “Pneumococcal conjugate vaccine serotypes of Streptococcus pneumoniae isolates and the antimicrobial susceptibility of such isolates in children with otitis media,” Clin. Infect. Dis. 33, 1489–1494 (2001). 10.1086/cid.2001.33.issue-9 [DOI] [PubMed] [Google Scholar]
- 24.Zhao J. H., et al. , “Automated autofluorescence background subtraction algorithm for biomedical Raman spectroscopy,” Appl. Spectro. 61(11), 1225–1232 (2007). 10.1366/000370207782597003 [DOI] [PubMed] [Google Scholar]
- 25.Silge A., et al. , “Identification of water-conditioned Pseudomonas aeruginosa by Raman microspectroscopy on a single cell level,” Syst. Appl. Microbiol. 37(5), 360–367 (2014). 10.1016/j.syapm.2014.05.007 [DOI] [PubMed] [Google Scholar]
- 26.Harz M., et al. , “Micro-Raman spectroscopic identification of bacterial cells of the genus Staphylococcus and dependence on their cultivation conditions,” Analyst 130(11), 1543–1550 (2005). 10.1039/b507715j [DOI] [PubMed] [Google Scholar]
- 27.Danzer K., et al. , Chemometrik, Springer Verlag, Berlin: (2001). [Google Scholar]
- 28.Jolliffe I. T., Principal Component Analysis, Springer Verlag, Berlin: (2002). [Google Scholar]
- 29.Peschke K. D., et al. , “Using transformation knowledge for the classification of Raman spectra of biological samples,” in Proc. of the 4th IASTED Int. Conf. on Biomedical Engineering, pp. 288–293 (2006). [Google Scholar]
- 30.Moor K., et al. , “Noninvasive and label-free determination of virus infected cells by Raman spectroscopy,” J. Biomed. Opt. 19(6), 067003 (2014). 10.1117/1.JBO.19.6.067003 [DOI] [PubMed] [Google Scholar]


