

ABSTRACT
Cell migration requires a precise temporal and spatial coordination of several processes which allow the cell to efficiently move. The extension and retraction of membrane protrusion, as well as adhesion are controlled by the Rho-family small GTPases. Two members of the family, Rac1 and RhoA, can show opposite behaviors and spatial localisations, with RhoA being active toward the rear of the cell and regulating its retraction during migration, whereas Rac1 is active toward the front of the cell. In addition to the spatial segregation, RhoA and Rac1 activity at the leading edge of the cells has an element of temporal segregation, with RhoA and Rac1 activities peaking at separate points during the migratory cycle of protrusion and retraction. Elements of this separation have been explained by the presence of 2 mutually inhibitory feedbacks, where Rac1 inhibits RhoA and RhoA in turn can inhibit Rac1. Recently, it was shown that Rac1 and RhoA activity and downstream signaling respond in a bistable manner to perturbations of this network.
KEYWORDS: bistable switches, cell motility, mathematical modeling, PAK inhibition, Rac1, RhoA
The small GTPases of the Rho family have been established as crucial signaling effectors regulating cellular morphology and, consequently, locomotion.1 Activation of RhoA and Rac1, 2 members of the family, has been shown to induce the formation of membrane protrusions and retractions as well as the regulation of actin polymerisation into filaments.
The activity of Rho-family GTPases is determined by their guanine nucleotide-bound state and their localization. Upon binding of GTP, Rho-GTPases undergo a conformational change which exposes effector binding domains, consequently greatly increasing the affinity for downstream signal transducers. This induces the translocation of these proteins to the membrane resulting in their activation and triggering downstream signaling thorough cascades which ultimately lead to modulation of cellular functions. On the other hand, GDP-bound GTPases are inactive, as they are locked in a conformation where the effector binding domain is masked.
The switching from GDP and GTP bound (or inactive to active) states is tightly controlled by a family of regulatory proteins that interact with GTPases and promote the exchange of GDP to GTP. Guanine nucleotide exchange factors (GEFs) promote the dissociation of GDP from the GTPase, which then preferentially binds GTP, as it is available in excess over GDP in the cell. The inactivation of the GTPase is induced by the binding of GTPase activating proteins (GAPs). GAPs greatly increase the intrinsic hydrolysis activity of the GTPases, promoting the conversion of GTP to GDP.2
RhoA is predominantly active toward the rear of the cell where it induces the retraction of the lagging end of the cell through action-myosin contractility. A smaller pool of active RhoA is present at the leading edge of the cell. In contrast to the near constitutive activity at the rear, RhoA activity at the front of the cell is highly dynamic and is sometimes induced only for a few seconds.3 Intriguingly, RhoA activity at the leading edge precedes the formation of a membrane protrusion. Rac1 on the other hand is nearly exclusively active at the very leading edge of migrating cells. Interestingly, the activities of both GTPases are clearly segregated, either spatially, with RhoA active at the rear and Rac1 at the front or indeed temporally with RhoA activity peaking before Rac1 at the leading edge of the cell during the protrusion-retraction cycle.4 This exclusivity has been explained by demonstrating that RhoA and Rac1 are embedded in a mutual inhibitory feedback loops. Rac1 has been shown to reduce RhoA activity through multiple mechanisms, some of which are dependent on the downstream effector kinase PAK.5 PAK has been reported to phosphorylate and inactive several RhoA-specific GEFs. In particular, phosphorylation GEF-H1 by PAKs on a C-terminal serine residue has been shown to induce the association of 14-3-3 proteins which leads to the sequestration of GEF-H1 to the microtubules where it is inactive and unable to promote the exchange of RhoA-GDP to GTP.6
Conversely, RhoA-GTP has also been shown to decrease Rac1 activity through activation of the downstream effector kinases ROCK1/2. ROCK has been shown to supress Rac1-GTP by directly phosphorylating FilGAP.7 In addition, in melanoma cells, the ROCK-dependent suppression of Rac-activity requires ARHGAP22. The precise mechanism of how this is mediated is as yet unclear, but it appears to be indirect as no ROCK dependent phosphorylation of ARHGAP22 was detected.8
Such a reciprocally regulated network structure can give rise to several distinct behaviors, depending on parameters, such as protein concentrations and activities. Firstly, such systems will react in a switch-like manner in response to perturbations, with either RhoA or Rac1 activities changing marginally until a tipping point is reached upon with a dramatic switching would occur. Depending on the wiring of the network this switch could be reversible, meaning that when the perturbation is removed the reversal switch would occur at the same position. Alternatively, such a reversal in activities could happen at distinct points, meaning that upon a perturbation Rac1 activity could be high or low depending on what the initial activity of Rac1 was when the system was perturbed, a so called bistable system. In fact it could even occur that RhoA and Rac1 activities would be locked permanently at a new level after a perturbation, resulting in an irreversible switch. In several model systems, RhoA activity has been recently shown to be bimodally distributed, spatially separate, excitable and traveling in waves, all hallmarks of a potentially bistable system.9-12
In a recent paper, we went on to explore under which circumstances bistability of the system would emerge and to determine how this would affect the Rho-GTPases, downstream signaling and cellular behavior.13 We combined kinetically detailed as well as coarse-grained mathematical models of the Rac1-RhoA interaction network focusing on the mutually inhibitory crosstalk between these GTPases mediated via p21-activated kinase (PAK). By employing mathematical models encompassing increasing levels of abstraction that retain the essential network features, we could flexibly zoom in and out of the network structure and conduct comprehensive, complementary computational analyses. In combination, these in silico analyses allowed us to untangle the network complexity and identify the key conditions that characterize the network input-output responses. Importantly, model predictions helped to formulate hypotheses and design appropriate experiments to test them. Using the highly motile MDA-MB-231 breast cancer cell line as the experimental model, we predicted and validated the presence of bistability at various levels via manipulation of PAK using a small inhibitor, IPA-3. By gradually inhibiting PAK activity starting from control (active PAK, no IPA-3) cells, or re-triggering PAK after pre-treating the cells with high doses of IPA-3, we could trace distinct input-output trajectories reflecting the hysteresis curves, a hallmark of bistable behaviors. We demonstrated bistability in the activities of Rac1 and RhoA, as well as bistable responses of actin dynamics, cell migration and the switching of cell morphology from elongated, mesenchymal to a rounded, amoeboid-like shape in 3-dimensional matrices.
A significant advance of a model-led analysis framework is the ability to forecast answers to newly posed questions that have not been experimentally tested before, through model simulations. Although such predictions have to be ultimately validated by experiments they nevertheless offer valuable insights into the mechanism-behavior relationship, and inform what can be expected which helps direct optimal experimental directions. Having validated the Rac1-PAK-RhoA model in MDA-MB-231 cells, we asked whether such bistable behavior is a common feature in other cell types. To probe this question, we first extracted publicly available protein expression data of several key model components from a variety of cell types of different origins.14,15 While the order of abundance of the extracted proteins is conserved across the cell lines, with 14-3-3 being the most and GEF-H1 the least abundant, the copy number of each protein tends to vary strongly (∼1-2 orders of magnitude) between the cell lines (Fig. 1A). This raises the possibility that the existence of bistability observed in MDA-MB-231 may be dependent on specific molecular contexts.
Figure 1.
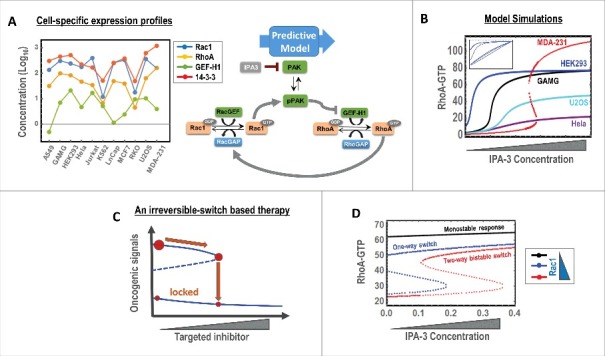
Model simulations of network dynamics under different conditions. (A) Cell-specific abundances of key network components in different cell-types determined by Mass Spectrometry (analyzed from ref. 14). (B) Simulated responses to increasing Rac1 inhibitor (IPA-3), plotted for RhoA-GTP as an example, for different cell types. The inbox shows the response for the remaining cells which display non-sigmoidal behaviors. (C) Graphical illustration of targeted therapeutic strategy that utilises an irreversible switch. (D) Simulations showing the sensitivity of the bistable switch to the concentration of Rac1. All model simulations were performed using our model published in ref. 13. The concentration units for RhoA-GTP are in μM.
Given a fixed network wiring, the dynamic behaviors of a network model are determined by the values of its kinetic parameters and state variables (e.g. expression of the network nodes). Because these parameters may vary between different cell types, the network can potentially display context-specific behaviors. It is reasonable to assume that kinetic parameters involved in protein-protein interactions or enzymatic reactions such as dissociation constants (Kds), catalytic constants (kcats) and Michaelis-Menten constants (Kms) are cell type independent, i.e. their values are conserved between different host cells. However, parameters including degradation or synthesis rates can vary between cell types, as these parameters often encapsulate and are therefore dependent on the regulatory enzymes (i.e., E3 ligases or transcriptional factors), whose levels may well differ between the cell types. Similarly, as models often lump multiple reactions for simplicity, parameters describing these reactions are dictated by the levels of the lumped nodes; and because these nodes may have different abundance between different cell types, the lumped parameters are likely cell type specific. Together, these argue that in addition to the commonly observed variation in the expression of network nodes, kinetic parameters can also be under strong variation across different cell types. Nevertheless, since our Rac1-RhoA model consists mainly of Kds, kcats and Kms, which are likely to be invariant across different cellular backgrounds, the model could be utilised to explore possible divergent network behaviors in different cell lines based on protein expression variations.
To this end, when we populated the model with cell type-specific expression profiles, model simulations predicted that only some of the tested cell types display switch-like, ultrasensitive response behaviors and, surprisingly, none apart from MDA-MB-231 exhibited bistablity (Fig. 1B). On one hand, this suggests we were rather lucky in choosing MDA-MB-231 as the model to investigate bistability, as the abundances of network components in this cell type seemed to be just “right” for bistability. On the other hand, as the model we have used is an abstraction of the complete network, it is quite possible that Rac1- RhoA behave bistable in some of these cell lines if the cross-talk between the 2 GTPases is not primarily mediated via PAK and GEF-H1. Nevertheless, these simulations highlight the benefit of model-based analysis as they would have pointed us to MDA-MB-231 as the optimal model to expose bistable behaviors in response to PAK inhibition. These simulations also explain the often observed cell-to-cell heterogeity in responses to perturbations by targeted therapy, attributed to by the variations in expression profiles between different cell types.
Irreversible switch based therapy
Bistable switches are often thought of as 2-way switches, where the output response can be switched “On” or “Off” depending on the direction of the input perturbation and history of the system. However, bistability can also manifest as one-way, irreversible switches where the output is locked permanently at a new level after a perturbation and cannot be turned back even by the reversal of that perturbation. As a result, the output is “trapped” in either the “On” or “Off” state irrespective of the perturbation status. This concept is particularly attractive in the context of targeted therapeutics as it suggests that once an inhibitor exceeds a threshold to suppress an oncogenic signal, even a complete withdrawal of that inhibitor would not re-trigger the inhibited signal, thereby minimizing harmful side-effects due to off-target specificity of the drug. Interestingly, although our model did not predict the existence of irreversible switch at the measured levels of the network nodes in MDA-MB-231 cells, it predicts presence of this type of switch at a lower intracellular Rac1 abundance (Fig. 1C). In this case, increasing the dose of the PAK inhibitor IPA-3 would permarnently lock RhoA and Rac1 activities in an active and inactive state, respectively, without having to replenish the inhibitor in cells, and subseqeuently promote an amoeboid switch (Fig. 1D, blue line). Our simulations however indicate that the existence of this irreversible switch may only occur in a small sub-population of cells as it was strongly parameter dependent and predicted to occur over a narrow range of Rac1 expression. If Rac1 is lower than this range, the system exhibits only simple monostable response (Fig. 1D, black line), while if Rac1s level exceeds this range, the systems displays robust reversible bistable responses (red line).
While this is the case in MDA-MB-231 cells, given the observed cell-type specific variations in protein expressions it is reasonable to expect that the conditions for irreversible switch may well be less stringent in other cells. A potentially interesting scenario is the presence of an irreversible switch in tumor cells but its absence in normal cells, possibly due to difference in network nodes' expression profiles, in which case withdrawing the drugs does not affect its efficacy in cancer cells but reverse its effect in normal cells, thereby minimizing deleterious side-effects. It is not clear how such scenario is likely to occur but it is almost of certainty that mathematical modeling and computational analysis will be again instrumental in guiding necessary perturbations to induce the network into exhibiting irreversible switches, which can be then exploited for targeted therapies.
Subcellular segregation of network components renders site-specific dynamics
Our mathematical model was purposely constructed to capture the whole-cell effects of the Rac1-RhoA interaction network, however mounting evidence suggest that there is spatiotemporal segregation of the network components between different subcellular localisations, which are highly dynamic and context-dependent.4,16 For example, RhoA is often observed to be active at the rear of a polarized cell, while it can be low or high at different patches at the cell front. Similarly, the level of Rac1-GTP tends to be low at the cell rear but could be low or high at the cell's leading edge, where it seems to lock in a localized mutual antagonistic relationship with RhoA. Additionally, FilGAP, a major GAP for Rac1, localizes with F-actin and filamin A (FLNA) at the cell rear and in patches of actin bundles at membrane ruffles.17 FilGAP is also localized at some protrusion and adhesion points, exactly where high RhoA activity is expected.17 These data suggests distinct profiles of the network nodes at the front and back of a migrating cell, characterized either by a combination of low Rac1, high RhoA, high FilGAP or high Rac1, low RhoA, low FilGAP.
To interrogate the local behavior of the Rac1-RhoA network dynamics at different sites in migrating cells the models need to be spatially-resolved, to capture site-specific expression and activity profiles and account for possible variations in network topology that can be rewired across the sites. These models can be used to probe a range of exciting questions: How does bistability change between different subcellular localisations? Would there be the more intricate dynamics, such as oscillation and excitability, and how do they interplay? Can information be fed back and forth between components of neighboring sites and if so, how would the site-specific dynamics be influenced? Clearly, the development of these models will be attractive avenues for future research. Initially, one can however attempt to gain understanding into site-specific dynamics of the Rac-RhoA interactions by utilizing our whole-cell model. As an illustration, we populated our model with different profiles of Rac1/RhoA/FilGAP. Model simulations show that upregulation of Rac1 combined with downregulation of RhoA and FilGAP drive the system away from bistability toward more linear, monostable responses (Figs. 2A, B). As a result, the Rac1/RhoA responses to PAK inhibition could be different depending on the locations as demonstrated in Fig. 2C. Fortunately, next-generation GTPase activity probes, which allow quantifying Rho-GTPase activities at the sub-cellular level robustly, have been created which will prove invaluable to validate these predictions.18 Using these tools it was recently shown that CDC42 and RhoA activities are also spatially and temporally segregated during neutrophil chemotaxis.9 RhoA activity was shown to be bimodally distributed indicating that in this system bistability is also likely.
Figure 2.
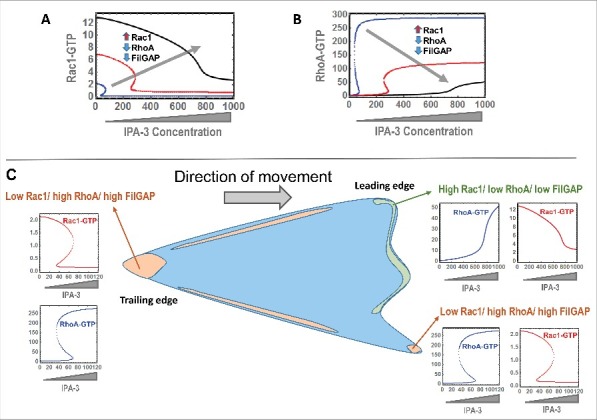
Subcellular site-specific simulations of network behaviors. (A, B) Simulated responses to increasing PAK inhibitor (IPA-3) for active Rac1 and RhoA as the concentrations of Rac1, RhoA and Rac1s GAP are simultaneously altered. (C) Illustrative simulations of the network responses at specific subcellular sites characterized by different expression profiles of the network nodes. All model simulations were performed using our model published in ref. 13. The concentration units for RhoA-GTP are in μM.
Funding Statement
AK and LKN acknowledge support from Breast Cancer NOW award 2013NovPR183, BNK support from the FP7 SynSignal (Grant agreement number 613879) and H2020 SmartNanoTox (Grant agreement number 686098).
Disclosure of potential conflicts of interest
No potential conflicts of interest were disclosed.
References
- [1].Hall A. Rho family GTPases. Biochem Soc Trans 2012; 40:1378-82; PMID:23176484; https://doi.org/ 10.1042/BST20120103 [DOI] [PubMed] [Google Scholar]
- [2].Vigil D, Cherfils J, Rossman KL, Der CJ. Ras superfamily GEFs and GAPs: validated and tractable targets for cancer therapy? Nat Rev Cancer 2010; 10:842-57; PMID:21102635; https://doi.org/ 10.1038/nrc2960 [DOI] [PMC free article] [PubMed] [Google Scholar]
- [3].Pertz O, Hodgson L, Klemke RL, Hahn KM. Spatiotemporal dynamics of RhoA activity in migrating cells. Nature 2006; 440:1069-72; PMID:16547516; https://doi.org/ 10.1038/nature04665 [DOI] [PubMed] [Google Scholar]
- [4].Machacek M, Hodgson L, Welch C, Elliott H, Pertz O, Nalbant P, Abell A, Johnson GL, Hahn KM, Danuser G. Coordination of Rho GTPase activities during cell protrusion. Nature 2009; 461:99-103; PMID:19693013; https://doi.org/ 10.1038/nature08242 [DOI] [PMC free article] [PubMed] [Google Scholar]
- [5].Guilluy C, Garcia-Mata R, Burridge K. Rho protein crosstalk: another social network? Trends Cell Biol 2011; 21:718-26; PMID:21924908; https://doi.org/ 10.1016/j.tcb.2011.08.002 [DOI] [PMC free article] [PubMed] [Google Scholar]
- [6].Zenke FT, Krendel M, DerMardirossian C, King CC, Bohl BP, Bokoch GM. p21-activated kinase 1 phosphorylates and regulates 14-3-3 binding to GEF-H1, a microtubule-localized Rho exchange factor. J Biol Chem 2004; 279:18392-400; PMID:14970201; https://doi.org/ 10.1074/jbc.M400084200 [DOI] [PubMed] [Google Scholar]
- [7].Ohta Y, Hartwig JH, Stossel TP. FilGAP, a Rho- and ROCK-regulated GAP for Rac binds filamin A to control actin remodelling. Nat Cell Biol 2006; 8:803-14; PMID:16862148; https://doi.org/ 10.1038/ncb1437 [DOI] [PubMed] [Google Scholar]
- [8].Sanz-Moreno V, Gadea G, Ahn J, Paterson H, Marra P, Pinner S, Sahai E, Marshall CJ. Rac activation and inactivation control plasticity of tumor cell movement. Cell 2008; 135:510-23; PMID:18984162; https://doi.org/ 10.1016/j.cell.2008.09.043 [DOI] [PubMed] [Google Scholar]
- [9].Yang HW, Collins SR, Meyer T. Locally excitable Cdc42 signals steer cells during chemotaxis. Nat Cell Biol 2016; 18:191-201; PMID:26689677; https://doi.org/ 10.1038/ncb3292 [DOI] [PMC free article] [PubMed] [Google Scholar]
- [10].Martin K, Reimann A, Fritz RD, Ryu H, Jeon NL, Pertz O. Spatio-temporal co-ordination of RhoA, Rac1 and Cdc42 activation during prototypical edge protrusion and retraction dynamics. Sci Rep 2016; 6:21901; PMID:26912264; https://doi.org/ 10.1038/srep21901 [DOI] [PMC free article] [PubMed] [Google Scholar]
- [11].Bement WM, Leda M, Moe AM, Kita AM, Larson ME, Golding AE, Pfeuti C, Su KC, Miller AL, Goryachev AB, et al.. Activator-inhibitor coupling between Rho signalling and actin assembly makes the cell cortex an excitable medium. Nat Cell Biol 2015; 17:1471-83; PMID:26479320; https://doi.org/ 10.1038/ncb3251 [DOI] [PMC free article] [PubMed] [Google Scholar]
- [12].Holmes WR, Edelstein-Keshet L. Analysis of a minimal Rho-GTPase circuit regulating cell shape. Phys Biol 2016; 13:046001; PMID:27434017; https://doi.org/ 10.1088/1478-3975/13/4/046001 [DOI] [PubMed] [Google Scholar]
- [13].Byrne KM, Monsefi N, Dawson JC, Degasperi A, Bukowski-Wills JC, Volinsky N, Dobrzynski M, Birtwistle MR, Tsyganov MA, Kiyatkin A, et al.. Bistability in the Rac1, PAK, and RhoA Signaling Network Drives Actin Cytoskeleton Dynamics and Cell Motility Switches. Cell Syst 2016; 2:38-48; PMID:27136688; https://doi.org/ 10.1016/j.cels.2016.01.003 [DOI] [PMC free article] [PubMed] [Google Scholar]
- [14].Geiger T, Wehner A, Schaab C, Cox J, Mann M. Comparative proteomic analysis of eleven common cell lines reveals ubiquitous but varying expression of most proteins. Mol Cell Proteomics 2012; 11:M111 014050; PMID:AMBIGUOUS; https://doi.org/ 10.1074/mcp.M111.014050 [DOI] [PMC free article] [PubMed] [Google Scholar]
- [15].Geiger T, Velic A, Macek B, Lundberg E, Kampf C, Nagaraj N, Uhlen M, Cox J, Mann M. Initial quantitative proteomic map of 28 mouse tissues using the SILAC mouse. Mol Cell Proteomics 2013; 12:1709-22; PMID:23436904; https://doi.org/ 10.1074/mcp.M112.024919 [DOI] [PMC free article] [PubMed] [Google Scholar]
- [16].Xu J, Wang F, Van Keymeulen A, Herzmark P, Straight A, Kelly K, Takuwa Y, Sugimoto N, Mitchison T, Bourne HR. Divergent signals and cytoskeletal assemblies regulate self-organizing polarity in neutrophils. Cell 2003; 114:201-14; PMID:12887922; https://doi.org/ 10.1016/S0092-8674(03)00555-5 [DOI] [PubMed] [Google Scholar]
- [17].Nakamura F. FilGAP and its close relatives: a mediator of Rho-Rac antagonism that regulates cell morphology and migration. Biochem J 2013; 453:17-25; PMID:23763313; https://doi.org/ 10.1042/BJ20130290 [DOI] [PubMed] [Google Scholar]
- [18].Fritz RD, Letzelter M, Reimann A, Martin K, Fusco L, Ritsma L, Ponsioen B, Fluri E, Schulte-Merker S, van Rheenen J, et al.. A versatile toolkit to produce sensitive FRET biosensors to visualize signaling in time and space. Sci Signal 2013; 6:rs12; PMID:23882122; https://doi.org/ 10.1126/scisignal.2004135 [DOI] [PubMed] [Google Scholar]