Abstract
Background
Several previous studies have reported the prognostic value of special AT-rich sequence-binding protein 1 (SATB1) in solid tumors. However, these studies produced inconsistent results because of their various limitations, including small sample sizes. Here, we describe a meta-analysis based on 17 studies including 3144 patients to search for connections between SATB1 overexpression and overall survival (OS) of patients with solid tumors. Seventeen studies (n = 3144) were assessed in the meta-analysis. Both univariate and multivariate analysis for survival indicated that high SATB1 reactivity significantly predicted poor prognosis. In the multivariate analysis, the combined hazard ratio (HR) for OS was 1.82 (95% confidence interval [CI]: 1.59–2.08, P < 0.0001). The pooled HR of the univariate analysis for OS was 1.96 (95% CI: 1.65–2.34, P < 0.0001).
Methods
Studies were identified by an electronic search of PubMed, EMBASE, and Web of Science, including publications prior to April 2017. Pooled HR values for OS were aggregated and quantitatively analyzed in the meta-analysis.
Conclusion
The meta-analysis indicated that high SATB1 reactivity is significantly correlated with decreased survival in most cases of solid tumors. In addition, SATB1 shows promise as a prognostic biomarker and novel therapeutic target on the basis of its expression level in solid tumors.
Keywords: SATB1, prognosis, solid tumor, meta-analysis
Introduction
Epidemiological data show that 14.1 million new cancer cases and 8.2 million cancer deaths occurred in 2012 worldwide;1 in other words, cancer is a leading cause of death in both more and less economically developed countries.2 Although considerable improvements have been made with respect to diagnostic capabilities and therapeutic methods, patients still face poor prognosis, especially in the advanced stages of the disease.3 A lack of biomarkers for early diagnosis has limited the efficacy of current therapies for patients with solid tumors. Therefore, identification of prognostic biomarkers for human solid tumors and elucidation of their molecular mechanisms are urgent priorities for improving standard diagnosis, therapy, and prognosis.
Recently, the role of special AT-rich sequence-binding protein 1 (SATB1) in tumorigenesis and tumor progression has become a focus of research. SATB1 is a cell type-specific nuclear matrix-associated protein that is predominantly expressed in thymocytes.4 SATB1 serves as a gene regulator and a genome organizer, as it can form a characteristic “cage-like” network that surrounds the heterochromatin to fold chromatin into complex higher order structures. It can also provide a nuclear platform that recruits chromatin-modifying enzymes and chromatin remodeling.5,6 SATB1 has been reported to influence the expression of hundreds of genes, including some involved in the pathogenesis of human cancers.7 These findings suggest that SATB1 may be involved in the carcinogenesis and/or progression of human malignancies. Many retrospective studies have evaluated whether SATB1 overexpression may be a prognostic factor for survival in patients with diverse types of solid tumors, including gastric cancer,8–10 breast cancer,11,12 glioma,13,14 epithelial ovarian cancer,15 colorectal cancer,16–20 astrocytoma,21 pancreatic cancer,22 endometrial cancer,23 bladder cancer,24 and esophageal squamous cell carcinoma.25 In addition, several studies found that the expression of SATB1 was not significantly associated with prognosis.19,21 Overall, the reported results are inconclusive, and no consensus has been reached. It is necessary to establish whether SATB1 expression is a prognostic marker for human solid tumors. In this study, we conducted a meta-analysis to evaluate the prognostic role of SATB1 expression in patients with solid tumors.
Methods
Literature search strategy
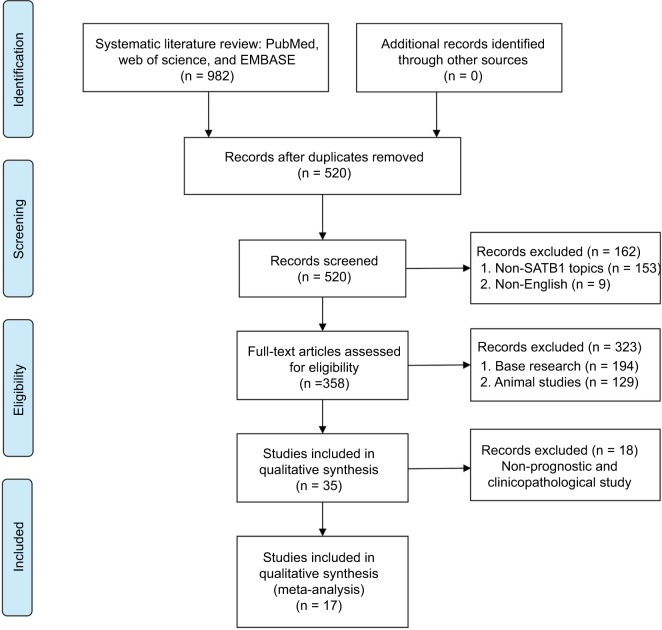
An electronic search of EMBASE, PubMed, and Web of Science was carried out to identify studies evaluating SATB1 expression and clinical outcome in solid tumors prior to April 2017. The search terms included ‘‘special AT-rich sequence-binding protein 1’’ or ‘‘SATB1’’ and ‘‘cancer’’ or ‘‘tumor’’ or ‘‘neoplasms’’ or ‘‘survival’’ or ‘‘prognosis’’. Only studies of solid tumors in humans were considered. A total of 982 studies were identified. The reference lists of studies were scanned for relevant reports, and further analysis was performed on articles of possible interest. Cohen’s kappa coefficient was used to determine inter-reviewer agreement. We would go all the way to reach a consensus if there was any disagreement between assessors.
Study selection
To be eligible for inclusion in this meta-analysis, a study had to meet the following criteria: 1) measure the expression of SATB1 with immunohistochemistry in the primary cancer tissue; 2) investigate the association between SATB1 and patients’ prognosis (overall survival [OS]); 3) have a follow-up period of no less than 3 years; 4) be published in the English language; and 5) be the most complete report or the most recent one, when the same author(s) published more than one on the same patient population. All candidate manuscripts were carefully read by two independent authors (Wang and Huang). In order to obtain a consensus, these two authors resolved any disagreements or conflicting results.
Data collection process and quality assessment
Two investigators (Wang and Liu) aimed to assess studies that included independently patient number, sex, median age, country, cancer type, follow-up duration, references, cutoff value for SATB1 positivity, cutoff definition, and hazard ratios (HRs) for OS with corresponding 95% confidence intervals (CIs). The OS data were acquired from tables or Kaplan-Meier curves that contained negative and positive groups for SATB1. All studies included in the meta-analysis were entire cohort studies. Each publication was scored based on the Newcastle–Ottawa scale (NOS) to identify high-quality studies.26 The score ranges from 0 to 9; a study with a score ≥6 was considered to be methodologically sound. A consensus NOS score was reached for each publication by discussion.
Statistical analysis
Data were acquired from the original articles and analyzed using the RevMan 5.3 software. The Mantel-Haenszel random-effects model was used for the weighted and pooled HR estimates, while Cochran’s Q and I2 were used for the heterogeneity statistics.27,28 As recommended by the Cochrane Handbook for Systematic Reviews of Interventions, differences appearing in the subgroups were assessed. A difference was considered statistically significant if two-sided P<0.05. Publication bias was estimated qualitatively using funnel plots with the standard error and evaluated by Begg’s and Egger’s tests.29
Results
Search results and study characteristics
Seventeen studies involving a total of 3144 patients were used for the meta-analysis (Figure 1). The included studies are summarized in Table 1. Five studies evaluated colorectal cancer,16–20 three studies evaluated gastric cancer,8–10 two studies focused on breast cancer11,12 and glioma,13,14 and one each evaluated epithelial ovarian cancer,15 astrocytoma,21 pancreatic cancer,22 endometrial cancer,23 bladder cancer,24 and esophageal squamous cell carcinoma.25 The studies were performed in five countries (People’s Republic of China, Germany, Poland, Australia, and Sweden) and published prior to April 2017.
Figure 1.
Flow diagram of the meta-analysis process.
Abbreviation: SATB1, special AT-rich sequence-binding protein 1.
Table 1.
Characteristics of the included studies
| References | Country | Cancer type | Case no. | Male/female | Age (years) | Detection method (cutoff) | Increased SATB1 (%) | Follow-up (months) | Survival analysis | HR (95% CI) | NOS (scores) |
|---|---|---|---|---|---|---|---|---|---|---|---|
| Cheng et al8 | People’s Republic of China | Gastric cancer | 102 | 63/39 | Mean 62.0 | IHC (score ≥3) | 49 (48.0%) | 87 | OS (M) | 1.79 (1.08–2.97) | 9 |
| Lu et al9 | People’s Republic of China | Gastric cancer | 118 | 78/40 | Mean 60.3 | IHC (score ≥2) | 56 (47.5%) | 91 | OS (M) | 1.71 (1.08–2.71) | 9 |
| Chu et al13 | People’s Republic of China | Glioma | 70 | 54/16 | Mean 45.0 | IHC (score ≥2) | 44 (62.9%) | 86 | OS (U) OS (M) |
2.22 (1.14–4.34) 2.22 (1.23–4.00) |
8 |
| Nodin et al15 | Sweden | Ovarian cancer | 105 | NR | NR | NR | 18 (17.14%) | 60 | OS (M) | 2.06 (1.11–3.81) | 6 |
| Nodin et al16 | Sweden | Colorectal cancer | 529 | 246/283 | 361/168 (<75 years/>75 years) | IHC (score >3) | 96 (18.1%) | 120 | OS (M) | 2.05 (1.09–3.88) | 8 |
| Chu et al21 | People’s Republic of China | Astrocytoma | 113 | 68/45 | Mean 45.0 | IHC (score ≥2) | 71 (62.8%) | 60 | OS (U) OS (M) |
2.34 (0.77–7.09) 2.17 (0.75–6.28) |
8 |
| Han et al14 | People’s Republic of China | Glioma | 79 | 53/26 | Mean 45.5 | IHC (score >4) | 45 (57.0%) | 36 | OS (U) OS (M) |
2.12 (1.33–3.38) 2.90 (1.72–4.88) |
8 |
| Elebro et al22 | Sweden | Pancreatic cancer | 106 | 57/49 | Mean 67.0 | NR | 21 (19.8%) | 60 | OS (U) OS (M) |
2.11 (1.25–3.56) 1.79 (1.05–3.05) |
8 |
| Hedner et al10 | Sweden | Gastric cancer | 170 | 129/41 | NR | IHC (staining ≥2%) | 53 (31.2%) | 96 | OS (U) OS (M) |
1.74 (1.04–2.90) 2.30 (1.32–4.01) |
9 |
| Al-Sohaily et al20 | Australia | Colorectal cancer | 352 | 191/152 | 197/145 (<70 years/>70 years) | IHC (staining ≥5%) | 266 (78.0%) | 120 | OS (U) | 2.48 (1.31–4.69) | 8 |
| Niu et al17 | People’s Republic of China | Colorectal cancer | 131 | 78/53 | 59/72 (<60 years/≥60 years) | IHC (score ≥3) | 64 (48.5%) | 72 | OS (U) OS (M) |
2.33 (1.36–3.99) 1.77 (1.03–3.04) |
9 |
| Zhang et al18 | People’s Republic of China | Colorectal cancer | 520 | 311/209 | 254/266 (<60 years/≥60 years) | TMA (strongly staining) | 205 (39.4%) | 120 | OS (M) | 1.45 (1.09–1.93) | 9 |
| Zhang et al23 | People’s Republic of China | Endometrial cancer | 172 | NR | 112/60 (<55 years/≥55 years) | NR | 78 | 84 | OS (M) | 2.93 (1.07–8.02) | 7 |
| Kowalczyk et al19 | Poland | Colorectal cancer | 102 | 54/48 | Mean 57.3 | IHC (score >4) | 41 | 60 | OS (U) | 1.39 (0.73–2.63) | 8 |
| Liu et al12 | People’s Republic of China | Breast cancer | 169 | 0/169 | Mean 53.6 | IHC (score ≥3) | 92 | 120 | OS (U) | 2.41 (1.20–4.84) | 7 |
| Wan et al24 | People’s Republic of China | Bladder cancer | 126 | 83/43 | Mean 62.5 | IHC (score ≥3) | 71 | 72 | OS (M) | 1.82 (1.19–2.78) | 9 |
| Cong et al25 | People’s Republic of China | Esophageal cancer | 180 | 129/51 | Mean 61.0 | IHC (score ≥4.5) | 87 | 120 | OS (U) OS (M) |
1.62 (1.11–2.37) 1.58 (1.08–2.31) |
9 |
Abbreviations: CI, confidence interval; HR, hazard ratio; IHC, immunohistochemistry; M, multivariate analysis; no., number; NOS, Newcastle–Ottawa Scale; NR, not reported; OS, overall survival; SATB1, special AT-rich sequence-binding protein 1; U, univariate analysis.
Association of SATB1 with OS
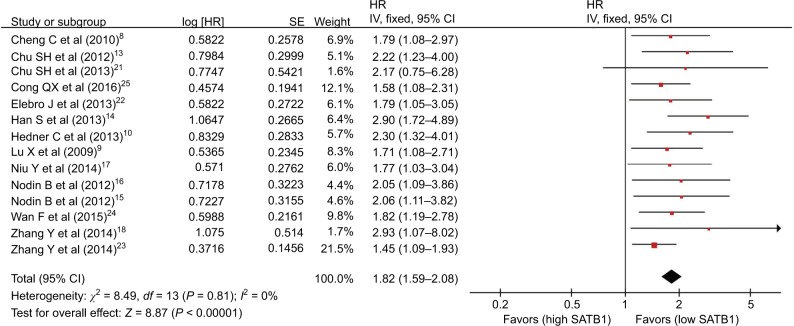
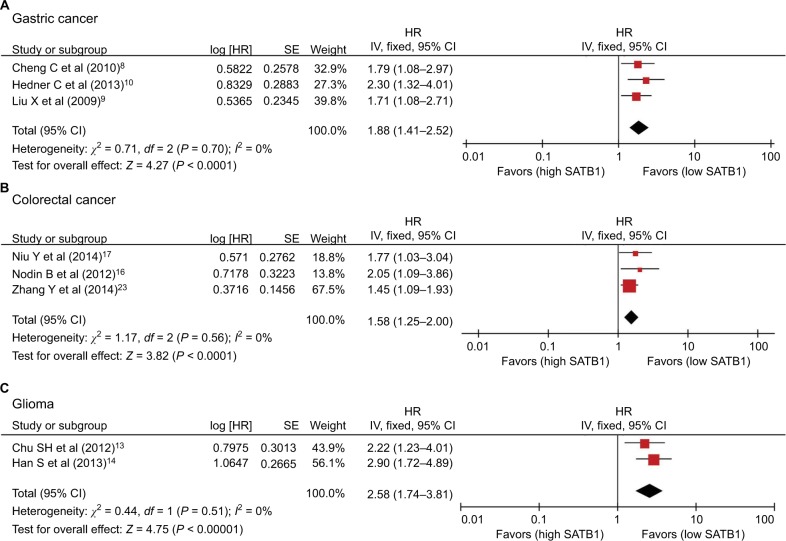
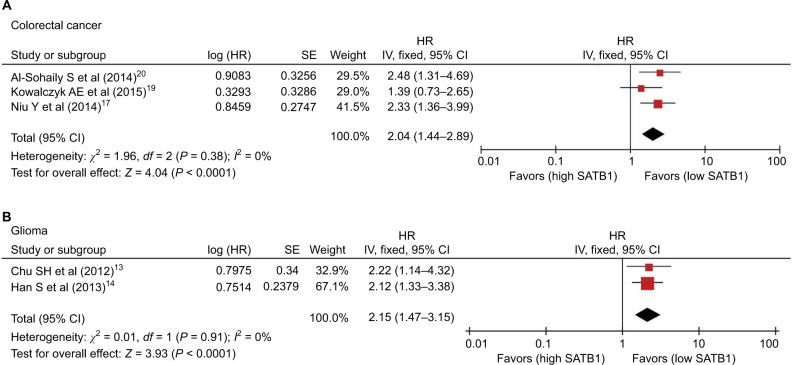
There were 14 studies that reported OS data with multivariate analysis. The relevant results showed that SATB1 overexpression in human tumor tissues was associated with a decrease in survival among solid tumor patients (HR = 1.82; 95% CI 1.59–2.08, P < 0.00001) (Figure 2). There was no evidence of heterogeneity among the 14 studies mentioned (P = 0.81, I2 = 0 %). Pooled HRs for OS according to subgroup analysis of the included studies are shown in Table 2. We further performed a subgroup analysis to assess OS data for different types of cancer using univariate analysis. Three reports provided OS data for gastric cancer and colorectal cancer, and two for glioma. A stratified analysis on solid tumor type showed that SATB1 overexpression was connected with negative clinical outcomes in gastric cancer (HR = 1.88; 95% CI 1.41–2.52, P < 0.0001) (Figure 3A), colorectal cancer (HR = 1.58; 95% CI 1.25–2.00, P < 0.0001) (Figure 3B), and glioma (HR = 2.58; 95% CI 1.74–3.81, P < 0.00001) (Figure 3C). There were 10 studies reporting OS data with univariate analysis. Relevant results showed that SATB1 overexpression in human tumor tissues was related to a decrease in survival among solid tumor patients (HR = 1.96; 95% CI 1.65–2.34, P < 0.00001) (Figure 4). Among the 14 studies involved, there was no significant heterogeneity (P = 0.91, I2 = 0%). We further conducted a subgroup analysis to assess OS data for different types of cancer with multivariate analysis. Three reports provided OS data for colorectal cancer and two studies for glioma. A stratified analysis of solid tumor type found that SATB1 overexpression was connected with negative clinical outcomes in colorectal cancer (HR = 2.04; 95% CI 1.44–2.89, P < 0.0001) (Figure 5A), and glioma (HR = 2.15; 95% CI 1.47–3.15, P < 0.00001) (Figure 5B).
Figure 2.
Meta-analysis of the association between SATB1 and OS (multivariate analysis) in patients with solid tumors.
Abbreviations: CI, confidence interval; HR, hazard ratio; IV, inverse variance; OS, overall survival; SATB1, special AT-rich sequence-binding protein 1; SE, standard error.
Table 2.
Pooled HR for OS according to subgroup analysis
| References Analysis type | No. of studies | No. of patients | Fixed-effect model
|
Heterogeneity
|
||
|---|---|---|---|---|---|---|
| HR (95% CI) | P-value | I2 (%) | P-value | |||
| Multivariate | 10 | 1473 | 1.82 (1.59–2.08) | <0.00001 | 0 | 0.81 |
| Univariate | 14 | 2521 | 1.96 (1.65–2.34) | <0.00001 | 0 | 0.91 |
| Tumor type (univariate) | ||||||
| Colorectal cancer | 3 | 585 | 2.04 (1.44–2.89) | <0.0001 | 0 | 0.38 |
| Glioma | 2 | 149 | 2.15 (1.47–3.15) | <0.0001 | 0 | 0.91 |
| Others | 5 | 793 | 1.86 (1.46–2.36) | <0.00001 | 0 | 0.83 |
| Tumor type (multivariate) | ||||||
| Colorectal cancer | 3 | 1180 | 1.58 (1.25–2.00) | <0.0001 | 0 | 0.56 |
| Gastric cancer | 3 | 390 | 1.88 (1.41–2.52) | <0.0001 | 0 | 0.70 |
| Glioma | 2 | 149 | 2.58 (1.74–3.81) | <0.00001 | 0 | 0.51 |
| Others | 6 | 802 | 1.81 (1.45–2.26) | <0.00001 | 0 | 0.90 |
| Ethnicity (univariate) | ||||||
| Asian | 6 | 742 | 2.01 (1.61–2.51) | <0.00001 | 0 | 0.85 |
| Caucasian | 4 | 731 | 1.89 (1.42–2.52) | <0.0001 | 0 | 0.61 |
| Ethnicity (multivariate) | ||||||
| Asian | 11 | 2140 | 1.78 (1.54–2.06) | <0.00001 | 0 | 0.81 |
| Caucasian | 3 | 381 | 2.03 (1.46–2.82) | <0.0001 | 0 | 0.82 |
Abbreviations: CI, confidence interval; HR, hazard ratio; No., number.
Figure 3.
Subgroup analysis of OS (multivariate analysis) by SATB1 expression in various tumor types. (A) Gastric cancer; (B) colorectal cancer; and (C) glioma.
Abbreviations: CI, confidence interval; IV, inverse variance; OS, overall survival; SATB1, special AT-rich sequence-binding protein 1; SE, standard error.
Figure 4.
Meta-analysis of the association between SATB1 and OS (univariate analysis) in patients with solid tumors.
Abbreviations: CI, confidence interval; IV, inverse variance; OS, overall survival; SATB1, special AT-rich sequence-binding protein 1; SE, standard error.
Figure 5.
Subgroup analysis of OS (univariate analysis) by SATB1 expression in various tumor types. (A) Colorectal cancer and (B) glioma.
Abbreviations: CI, confidence interval; HR, hazard ratio; IV, inverse variance; OS, overall survival; SATB1, special AT-rich sequence-binding protein 1; SE, standard error.
Publication bias
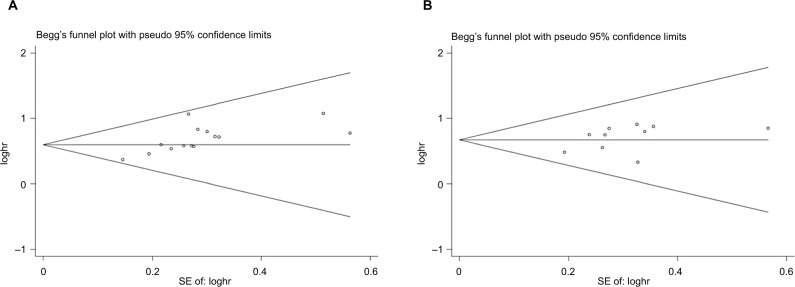
The funnel plots showed no evidence of publication bias in the studies of either outcome. No evidence for significant publication bias was found for OS with multivariate analysis (Figure 6A) or univariate analysis (Figure 6B).
Figure 6.
Begg’s funnel plot estimation of the publication bias of the included literature for OS with multivariate analysis (A) and univariate analysis (B).
Abbreviation: OS, overall survival.
Discussion
Over the past several decades, much research has focused on identifying novel prognostic markers in order to advance therapy and outcomes by informing clinical decision making. The prognostic significance of SATB1 expression has been investigated in a wide range of cancers. Here, we aimed to summarize and evaluate the findings of published studies and extract valuable information that can be used in clinical decision-making regarding human solid tumors.
This meta-analysis was the first systematic review to investigate in depth the relationship between SATB1 overexpression and OS of patients with solid tumors. Survival data for 3144 solid tumor patients in 17 different studies were systematically analyzed. The meta-analysis indicated that the overexpression of SATB1 could be used as a biomarker of poor prognosis in human with solid tumors, with similar OS results given by the multivariate and the univariate analysis. Regarding solid tumors of different tissues, high SATB1 expression was relevant to poor OS in gastric cancer, colorectal carcinoma, and glioma. Similarly, increased SATB1 expression was associated with poor survival in solid tumors. Further studies are required to verify the potential mechanism and impact of SATB1 in the pathogenesis of human solid tumors, in addition to its prognostic value.
There are several crucial implications of this meta-analysis. First, SATB1 expression is associated with adverse outcomes in various human solid tumors, indicating that SATB1 may be of use as a new therapeutic target. Second, in a subgroup of tumors, tumor tissues with high SATB1 expression were shown to have worse OS, including gastric cancer, colorectal carcinoma, and glioma. Overall, this study highlights SATB1 as a valuable prognostic biomarker with potential clinical applications.
However, this meta-analysis had some deficiencies and limitations. First, there was a risk of publication bias, as some studies with small sample sizes or negative results may not have been published. Second, there may be inconsistent data in the included reports, as they used different cutoff values and analysis methods for evaluating SATB1 overexpression. Finally, there may be a certain publication bias within some of the included studies, as any negative results are less likely to have been reported.
Conclusion
In general, this meta-analysis makes it clear that SATB1 overexpression is related to poor OS in the case of most human solid tumors. It also suggests that SATB1 is both a promising prognostic indicator and a potential therapeutic target for human solid tumors.
Acknowledgments
This study was supported by grants from the Medical Innovations Topic in Fujian Province (no. 2016-CXB-8, 2012-CXB-29), the Science and Technology Project of Natural Science Foundation of Fujian Province (no. 2016J01639), and the Project of Xiamen Scientific and Technological Plan (nos. 3502Z20134011 and 3502Z20174023).
Footnotes
Disclosure
The authors report no conflicts of interest in this work.
References
- 1.Torre LA, Bray F, Siegel RL, Ferlay J, Lortet-Tieulent J, Jemal A. Global cancer statistics, 2012. CA Cancer J Clin. 2015;65(2):87–108. doi: 10.3322/caac.21262. [DOI] [PubMed] [Google Scholar]
- 2.Ferlay J, Soerjomataram I, Dikshit R, et al. Cancer incidence and mortality worldwide: sources, methods and major patterns in GLOBOCAN 2012. Int J Cancer. 2015;136(5):E359–E386. doi: 10.1002/ijc.29210. [DOI] [PubMed] [Google Scholar]
- 3.Macdonald JS. Gastric cancer–new therapeutic options. N Engl J Med. 2006;355(1):76–77. doi: 10.1056/NEJMe068121. [DOI] [PubMed] [Google Scholar]
- 4.Dickinson LA, Joh T, Kohwi Y, Kohwi-Shigematsu T. A tissue-specific MAR/SAR DNA-binding protein with unusual binding site recognition. Cell. 1992;70(4):631–645. doi: 10.1016/0092-8674(92)90432-c. [DOI] [PubMed] [Google Scholar]
- 5.Galande S, Purbey PK, Notani D, Kumar PP. The third dimension of gene regulation: organization of dynamic chromatin loopscape by SATB1. Curr Opin Genet Dev. 2007;17(5):408–414. doi: 10.1016/j.gde.2007.08.003. [DOI] [PubMed] [Google Scholar]
- 6.Purbey PK, Singh S, Notani D, Kumar PP, Limaye AS, Galande S. Acetylation-dependent interaction of SATB1 and CtBP1 mediates transcriptional repression by SATB1. Mol Cell Biol. 2009;29(5):1321–1337. doi: 10.1128/MCB.00822-08. [DOI] [PMC free article] [PubMed] [Google Scholar]
- 7.Han HJ, Russo J, Kohwi Y, Kohwi-Shigematsu T. SATB1 reprogrammes gene expression to promote breast tumour growth and metastasis. Nature. 2008;452(7184):187–193. doi: 10.1038/nature06781. [DOI] [PubMed] [Google Scholar]
- 8.Cheng C, Lu X, Wang G, et al. Expression of SATB1 and heparanase in gastric cancer and its relationship to clinicopathologic features. APMIS. 2010;118(11):855–863. doi: 10.1111/j.1600-0463.2010.02673.x. [DOI] [PubMed] [Google Scholar]
- 9.Lu X, Cheng C, Zhu S, et al. SATB1 is an independent prognostic marker for gastric cancer in a Chinese population. Oncol Rep. 2010;24(4):981–987. doi: 10.3892/or.2010.981. [DOI] [PubMed] [Google Scholar]
- 10.Hedner C, Gaber A, Korkocic D, et al. SATB1 is an independent prognostic factor in radically resected upper gastrointestinal tract adenocarcinoma. Virchows Arch. 2014;465(6):649–659. doi: 10.1007/s00428-014-1667-6. [DOI] [PMC free article] [PubMed] [Google Scholar]
- 11.Hanker LC, Karn T, Mavrova-Risteska L, et al. SATB1 gene expression and breast cancer prognosis. Breast. 2011;20(4):309–313. doi: 10.1016/j.breast.2010.10.002. [DOI] [PubMed] [Google Scholar]
- 12.Liu X, Zheng Y, Qiao C, et al. Expression of SATB1 and HER2 in breast cancer and the correlations with clinicopathologic characteristics. Diagn Pathol. 2015;10:50. doi: 10.1186/s13000-015-0282-4. [DOI] [PMC free article] [PubMed] [Google Scholar]
- 13.Chu SH, Ma YB, Feng DF, et al. Upregulation of SATB1 is associated with the development and progression of glioma. J Transl Med. 2012;10:149. doi: 10.1186/1479-5876-10-149. [DOI] [PMC free article] [PubMed] [Google Scholar]
- 14.Han S, Xia J, Qin X, Han S, Wu A. Phosphorylated SATB1 is associated with the progression and prognosis of glioma. Cell Death Dis. 2013;4:e901. doi: 10.1038/cddis.2013.433. [DOI] [PMC free article] [PubMed] [Google Scholar]
- 15.Nodin B, Hedner C, Uhlén M, Jirström K. Expression of the global regulator SATB1 is an independent factor of poor prognosis in high grade epithelial ovarian cancer. J Ovarian Res. 2012;5(1):24. doi: 10.1186/1757-2215-5-24. [DOI] [PMC free article] [PubMed] [Google Scholar]
- 16.Nodin B, Johannesson H, Wangefjord S, et al. Molecular correlates and prognostic significance of SATB1 expression in colorectal cancer. Diagn Pathol. 2012;7:115. doi: 10.1186/1746-1596-7-115. [DOI] [PMC free article] [PubMed] [Google Scholar]
- 17.Niu Y, Wang L, Cheng C, et al. Increased expressions of SATB1 and S100A4 are associated with poor prognosis in human colorectal carcinoma. APMIS. 2015;123(2):93–101. doi: 10.1111/apm.12310. [DOI] [PubMed] [Google Scholar]
- 18.Zhang Y, Tian X, Ji H, et al. Expression of SATB1 promotes the growth and metastasis of colorectal cancer. PLoS One. 2014;9(6):e100413. doi: 10.1371/journal.pone.0100413. [DOI] [PMC free article] [PubMed] [Google Scholar]
- 19.Kowalczyk AE, Godlewski J, Krazinski BE, et al. Divergent expression patterns of SATB1 mRNA and SATB1 protein in colorectal cancer and normal tissues. Tumour Biol. 2015;36(6):4441–4452. doi: 10.1007/s13277-015-3084-0. [DOI] [PMC free article] [PubMed] [Google Scholar]
- 20.Al-Sohaily S, Henderson C, Selinger C, et al. Loss of special AT-rich sequence-binding protein 1 (SATB1) predicts poor survival in patients with colorectal cancer. Histopathology. 2014;65(2):155–163. doi: 10.1111/his.12295. [DOI] [PubMed] [Google Scholar]
- 21.Chu SH, Ma YB, Feng DF, et al. Relationship between SATB1 expression and prognosis in astrocytoma. J Clin Neurosci. 2013;20(4):543–547. doi: 10.1016/j.jocn.2012.05.033. [DOI] [PubMed] [Google Scholar]
- 22.Elebro J, Heby M, Gaber A, et al. Prognostic and treatment predictive significance of SATB1 and SATB2 expression in pancreatic and periampullary adenocarcinoma. J Transl Med. 2014;12:289. doi: 10.1186/s12967-014-0289-8. [DOI] [PMC free article] [PubMed] [Google Scholar]
- 23.Zhang Y, Wang L, Liu Y, et al. Overexpression of special AT-rich sequence-binding protein 1 in endometrial cancer: a clinicopathologic study. Int J Gynecol Cancer. 2015;25(1):4–11. doi: 10.1097/IGC.0000000000000314. [DOI] [PubMed] [Google Scholar]
- 24.Wan F, Cheng C, Wang Z, et al. SATB1 overexpression regulates the development and progression in bladder cancer through EMT. PLoS One. 2015;10(2):e0117518. doi: 10.1371/journal.pone.0117518. [DOI] [PMC free article] [PubMed] [Google Scholar] [Retracted]
- 25.Cong QX, Zhang H, Sun SX, Li HF, Wang Y, Jian S. Pilot study special AT-rich sequence-binding protein 1 investigating as a potential biomarker for esophageal squamous cell carcinoma. Dis Esophagus. 2016;29(6):621–626. doi: 10.1111/dote.12365. [DOI] [PubMed] [Google Scholar]
- 26.Stang A. Critical evaluation of the Newcastle-Ottawa scale for the assessment of the quality of nonrandomized studies in meta-analyses. Eur J Epidemiol. 2010;25(9):603–605. doi: 10.1007/s10654-010-9491-z. [DOI] [PubMed] [Google Scholar]
- 27.Higgins JP, Thompson SG, Deeks JJ, Altman DG. Measuring inconsistency in meta-analyses. BMJ. 2003;327(7414):557–560. doi: 10.1136/bmj.327.7414.557. [DOI] [PMC free article] [PubMed] [Google Scholar]
- 28.Dickersin K, Berlin JA. Meta-analysis: state-of-the-science. Epidemiol Rev. 1992;14:154–176. doi: 10.1093/oxfordjournals.epirev.a036084. [DOI] [PubMed] [Google Scholar]
- 29.Sterne JA, Egger M. Funnel plots for detecting bias in meta-analysis: guidelines on choice of axis. J Clin Epidemiol. 2001;54(10):1046–1055. doi: 10.1016/s0895-4356(01)00377-8. [DOI] [PubMed] [Google Scholar]


