Abstract
Aim
Severe caffeine poisoning is rare, but is associated with high mortality. Plasma caffeine concentration is one of the indications of treatment of caffeine poisoning; however, it is not easily measured at most emergency departments. If the plasma lactate concentration and the plasma caffeine concentration were correlated, the plasma lactate concentration may be an indication of caffeine poisoning. In this study, we investigated the correlation between the plasma lactate concentration and the plasma caffeine concentration.
Methods
From April 2010 to March 2012, 18 patients with severe caffeine poisoning by overdose were admitted at our Emergency Center. The plasma lactate concentration and plasma caffeine concentration of 10 patients were determined at the same time at 12–24 h after admission. These findings were plotted and we analyzed the correlation and trends in these concentrations.
Results
There were strong correlations between the plasma lactate concentration and the plasma caffeine concentration at admission (n = 18) and at 12–24 h after admission (n = 10) (correlation coefficients, 0.95 and 0.91, respectively). There was a strong positive correlation between the trend of the plasma lactate concentration and the plasma caffeine concentration (n = 10). The correlation coefficient was 0.91.
Conclusion
These results are extremely beneficial for emergency department clinical physicians because such findings permit the determination of the severe caffeine poisoning patient. Additionally, the plasma lactate concentration might be one of the indicators of hospitalization and discharge.
Keywords: Caffeine poisoning, plasma caffeine concentration, plasma lactate concentration
Introduction
Caffeine‐containing products are popular drugs used to combat physical and mental fatigue, and are sold over‐the‐counter in tablet form.1, 2 Severe caffeine poisoning is rare but is associated with high mortality.1, 2 The plasma caffeine concentration (PCC) is one of the indications of treatment of caffeine poisoning; however, it is not easily measured at most emergency departments (ED). Conversely, measurement of the plasma lactate concentration (PLC) is a common blood examination procedure used in ED for circulatory collapse, ischemia, and other critical patients.3, 4, 5 Few published reports have mentioned increased PLC in severe caffeine poisoning.6 If there is a correlation between the PLC and the PCC, the PLC may be an indicator of the severity of caffeine poisoning in a patient. Furthermore, any correlation in the change of the PLC and the PCC would be useful in decision‐making regarding treatment strategies.
In this study, we investigated the correlation between the PLC and the PCC in patients with severe caffeine poisoning.
Methods
From April 2010 to March 2012, 18 patients with severe caffeine poisoning by overdose were admitted to the Tokai University Trauma and Emergency Center (Isehara, Japan). The PLC and PCC of these patients were examined at admission. The details of patients' characteristics and clinical courses are presented in Table 1. Six patients were male, the average age was 26.8 years (range, 16–46 years), average caffeine ingestion was 15.7 g (range, 8–24 g), and all patients survived. No patient presented with shock, seizures, or hypoxia during the clinical course. The PLC and PCC of 10 of the patients were examined at the same time at 12–24 h after admission.
Table 1.
Characteristics and clinical courses in patients admitted to an emergency department with severe caffeine poisoning (n = 18)
| No. | Gender | Age, years | Estimated intake | Time from ingestion (min) | Initial value | Initial status | Electrolytes | ||||||
|---|---|---|---|---|---|---|---|---|---|---|---|---|---|
| Total (g) | mg/kg | PCC (μg/mL) | PLC (mg/dL) | Excitement | HTN | Tachycardia | Tachypnea | Hyponatremia | Hypokalemia | ||||
| 1 | F | 19 | 14 | 311 | 180 | 42.48 | 27 | + | − | + | + | − | − |
| 2 | M | 24 | 10 | 139 | 80 | 56.32 | 53 | + | − | + | + | − | − |
| 3 | F | 46 | 8 | 127 | 60 | 52.66 | 43 | + | − | + | − | − | − |
| 4 | M | 39 | 12 | 171 | 370 | 17.80 | 12 | − | − | − | − | − | − |
| 5 | F | 16 | 12 | 214 | Unknown | 20.70 | 28 | + | − | + | − | − | − |
| 6 | F | 23 | 21 | 350 | 70 | 205.10 | 128 | + | + | + | + | + | + |
| 7 | F | 24 | 22 | 407 | 270 | 53.20 | 33 | + | − | + | − | − | − |
| 8 | F | 31 | 24 | 414 | 170 | 62.90 | 41 | + | − | + | + | − | − |
| 9 | F | 17 | 12 | 162 | 90 | 31.40 | 29 | − | − | + | − | − | − |
| 10 | M | 38 | 24 | 429 | 80 | 173.16 | 108 | + | + | + | + | + | + |
| 11 | M | 24 | 10 | 132 | Unknown | 58.00 | 46 | + | − | + | − | − | − |
| 12 | F | 20 | 8 | 167 | 40 | 82.30 | 82 | − | − | + | − | − | − |
| 13 | M | 44 | 12 | 203 | 60 | 42.00 | 40 | − | − | + | − | − | − |
| 14 | F | 28 | 9 | 164 | 90 | 56.00 | 56 | − | − | + | − | − | − |
| 15 | F | 21 | 21 | 339 | 150 | 77.00 | 70 | − | − | + | − | − | − |
| 16 | F | 23 | 19 | 365 | 220 | 45.00 | 48 | − | − | + | − | − | + |
| 17 | F | 28 | 22 | 407 | Unknown | 65.00 | 60 | − | + | + | − | − | − |
| 18 | M | 18 | 22 | 282 | 140 | 40.00 | 38 | + | − | + | − | − | − |
M, male; F, female; HTN, hypertension (≥180 mmHg); tachycardia, ≥120 b.p.m.; tachypnea, ≥24 breaths per min. +, presence; −, absence.
The PLC and PCC at admission (n = 18) and at 12–24 h after admission (n = 10), respectively, were plotted. We analyzed the correlation between the PLC and the PCC. In addition, we investigated the trend in these concentrations. We analyzed the correlation between the respective changes of the PLC and the PCC (subtract the PLC at 12–24 h after admission from the PLC at admission, and subtract the PCC at 12–24 h after admission from the PCC at admission) in the 10 patients whose PLC and PCC were examined at the two time points. Statistical analysis software (Dr. spss II for Windows, 11.0.1J; SPSS Inc., Tokyo, Japan) was used for data analysis (Pearson product–moment correlation coefficient). Our hospital's institutional ethics committee approved this study.
Results
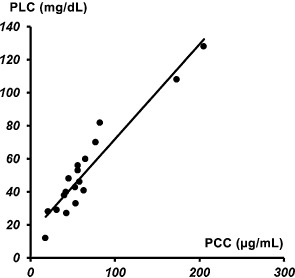
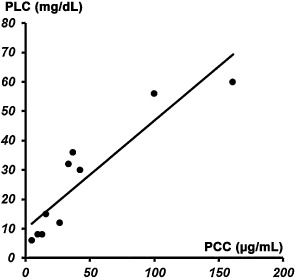
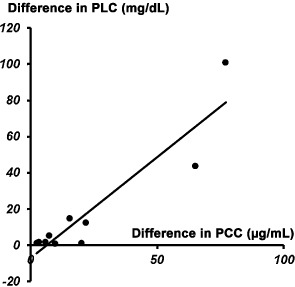
Figure 1A depicts the correlation between the PLC and the PCC at admission (n = 18). The correlation coefficient was 0.95. Figure 1B illustrates the correlation between the PLC and the PCC at 12–24 h after admission (n = 10). The correlation coefficient was 0.91. Figure 2 depicts the correlation between the respective changes of the PLC and the PCC (n = 10). The correlation coefficient was 0.91. These results indicated a strong positive correlation between the PLC and the PCC.
Figure 1A.

Correlation graph of the plasma lactate concentration (PLC) and the plasma caffeine concentration (PCC) in patients with severe caffeine poisoning at admission to the emergency department (n = 18).
Figure 1B.

Correlation graph of the plasma lactate concentration (PLC) and the plasma caffeine concentration (PCC) in patients with severe caffeine poisoning at 12–24 h after admission to the emergency department (n = 10).
Figure 2.

Correlation graph between the respective changes of the plasma lactate concentration (PLC) and the plasma caffeine concentration (PCC) in patients admitted to the emergency department with severe caffeine poisoning (n = 10). Difference in PLC was calculated by subtracting the PLC at 12–24 h after admission from the PLC at admission. Difference in PCC was calculated by subtracting the PCC at 12–24 h after admission from the PCC at admission.
Discussion
Caffeine is a natural alkaloid methylxanthine found in various plants, such as coffee or tea plants.1 Many caffeine‐containing products are sold over the counter in tablet form and used to counter physical and mental fatigue. These products are very popular drugs worldwide. Caffeine is well absorbed in the body and reaches its peak levels in blood within 15–45 min following ingestion.2 The liver quickly metabolizes caffeine into active stimulants such as theophylline. Approximately 85% of a dose is excreted in the urine within 48 h. Although the plasma half‐life of caffeine is reported to be 2–10 h (mean, 4 h) in adults, alcohol and some medicines have prolonged plasma half‐lives.1, 2 Over a brief time, ingestion of 3–10 g caffeine or a PCC of >80 μg/mL might cause death.1, 2
At moderate doses, caffeine acts as a competitive antagonist on adenosine receptors. Adenosine acts through specific receptors and is found in the human body, but acts as a negative inotropic and chronotropic substance both in brain‐modulating systems and in the heart.1, 3 At high doses, caffeine inhibits the intracellular enzyme phosphodiesterase, which converts cyclic adenosine monophosphate into its non‐cyclic form. Through this action, caffeine interacts with the sympathetic nervous system causing prolonged and intensified beta‐receptor activation with positive inotropic and chronotropic effects.1 Therefore, severe caffeine poisoning is relatively rare, but it is very lethal.1, 7, 8 The severe symptoms of poisoning that have been reported include electrolyte abnormality (hypokalemia and hyponatremia), lethal arrhythmias (ventricular arrhythmias and ventricular fibrillation), hypertension, respiratory failure, seizures, and rhabdomyolysis.7, 8, 9, 10 The PCC is the most important factor for judging the severity of caffeine poisoning. However, measurement of the PCC in the ED is impractical. Therefore, we believe that it is necessary to have a convenient and realistic indicator of PCC in the ED.
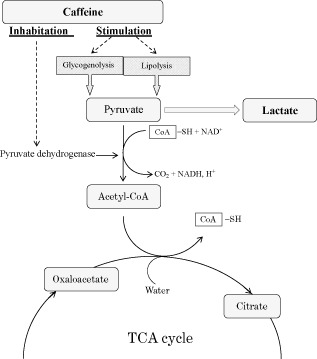
Schmidt et al. reported a case of caffeine poisoning that involved an increase in the PLC.6 The PLC is a widely used indicator of circulatory collapse, ischemia, and other critical conditions in ED patients. This phenomenon was clarified, in that caffeine gives rise to excessive sympathetic stimulation, with increased glycogenolysis and lipolysis and a secondary increase in pyruvate. If pyruvate does not enter the aerobic pathway, it is converted to lactate instead, causing lactatemia. Other mechanisms involving inhibited pyruvate oxidation and/or inhibition of pyruvate dehydrogenase might also contribute to lactatemia (Fig. 3).
Figure 3.

Mechanisms underlying lactatemia in cases of severe caffeine poisoning. CoA, coenzyme A; SH, sulfhydryl; TCA, tricarboxylic acid.
We have encountered caffeine poisoning cases in which the PLC was increased. Thus, we examined the correlation between the PLC and the PCC. We found that there was a strong positive correlation between these factors. Furthermore, the PLC and the PCC decreased in parallel. These results are beneficial for ED clinical physicians, as it would permit them to determine the severity of caffeine poisoning in a patient. In addition, the PLC might be one of the indicators of hospitalization and discharge.
It is likely that the strong correlation between the two concentrations was due to the studied patients not presenting with shock, seizures, or hypoxia during the clinical course. These clinical conditions are factors for an increase in the PLC. Therefore, the PLC may be unsuitable for evaluating caffeine poisoning patients who show these clinical conditions prehospital. However, caffeine poisoning patients presenting with shock, seizures, and hypoxia would be in a severe state of poisoning. Thus, the condition of these patients would be moot, and the PLC can be used to determine the severity of caffeine poisoning in other patients.
Conflict of Interest
None.
References
- 1. Rudolph T, Knudsen K. A case of fatal caffeine poisoning. Acta Anaesthesiol. Scand. 2010; 54: 521–523. [DOI] [PubMed] [Google Scholar]
- 2. Sepkowitz KA. Energy drinks and caffeine‐related adverse effects. JAMA 2013; 309: 243–244. [DOI] [PubMed] [Google Scholar]
- 3. Schuster HP. Resuscitation. Prognostic value of blood lactate in critically ill patients. Resuscitation 1984; 11: 141–146. [DOI] [PubMed] [Google Scholar]
- 4. Kruse JA, Carlson RW. Lactate metabolism. Crit. Care Clin. 1987; 3: 725–746. [PubMed] [Google Scholar]
- 5. Toffaletti J. Elevations in blood lactate: overview of use in critical care. Scand. J. Clin. Lab. Invest. Suppl. 1996; 224: 107–110. [DOI] [PubMed] [Google Scholar]
- 6. Schmidt A, Karlson‐Stiber C. Caffeine poisoning and lactate rise: an overlooked toxic effect? Acta Anaesthesiol. Scand. 2008; 52: 1012–1014. [DOI] [PubMed] [Google Scholar]
- 7. Mrvos RM, Reilly PE, Dean BS, Krenzelok EP. Massive caffeine ingestion resulting in death. Vet. Hum. Toxicol. 1989; 31: 571–572. [PubMed] [Google Scholar]
- 8. Waring WS, Laing WJ, Good AM, Malkowska AM. Acute caffeine ingestion: clinical features in patients attending the emergency department and Scottish poison centre enquiries between 2000 and 2008. Scott. Med. J. 2009; 54: 3–6. [DOI] [PubMed] [Google Scholar]
- 9. Kamijo Y, Soma K, Asari Y, Asari Y, Ohwada T. Severe rhabdomyolysis following massive ingestion of oolong tea: caffeine intoxication with coexisting hyponatremia. Vet. Hum. Toxicol. 1999; 41: 381–383. [PubMed] [Google Scholar]
- 10. Eichner ER. Overcaffeination: low potassium and other perils. Curr. Sports Med. Rep. 2011; 10: 122–123. [DOI] [PubMed] [Google Scholar]


