Abstract
Purpose
To evaluate the disease extent on ultra-widefield fundus autofluorescence (UWF-FAF) in patients with ABCA4-Stargardt disease (STGD) and correlate this data with functional outcome measures.
Design
Retrospective cross sectional study
Setting
Kellogg Eye Center, University of Michigan
Study population
Sixty-five patients with clinical diagnosis and proven pathogenic variants in the ABCA4 gene.
Observational procedures
The UWF-FAF images were obtained using Optos 200-degrees and classified into three types. Functional testing included: kinetic widefield perimetry, full-field electroretinogram (ffERG) and visual acuity (VA). All results were evaluated with respect to UWF-FAF classification.
Main outcome measures
Classification of UWF-FAF; area comprising the I4e, III4e, and IV4e isopters; ffERG patterns; and VA.
Results
For UWF-FAF, 27 subjects (41.5%) were classified as type I; 17 (26.2 %) as type II; and 21 (32.4%) as type III. The area of each isopter correlated inversely with the extent of the disease and all isopters were able to detect differences among UWF-FAF types (IV4e, p = 0.0013; III4e, p = 0.0003; I4e, p < 0.0001= 3.93e−8). ffERG patterns and VA were also different among the three UWF-FAF types (p < 0.001= 6.61e-6 and p < 0.001= 7.3e−5, respectively).
Conclusion
Patients with widespread disease presented with more constriction of peripheral visual fields, had more dysfunction on ffERG and worse VA compared to patients with disease confined to the macula. UWF-FAF images may provide information for estimating peripheral and central visual function in STGD.
INTRODUCTION
Stargardt disease (STGD) is the most common inherited macular dystrophy in both children and adults. 1–4 It is caused by pathogenic variants in the ABCA4 gene that lead to the toxic accumulation of lipofuscin in the retinal pigment epithelium (RPE). 5–8 Clinically, patients with STGD present with bilateral central vision loss and variable degrees of macular atrophy, with or without flecks. 2,4,9,10 However, the disease is not limited to the macula. Over time, the disease progresses centrifugally from the macula to the far periphery along the nasal, temporal, superior, and inferior meridians, with variable rates of progression. 11–15
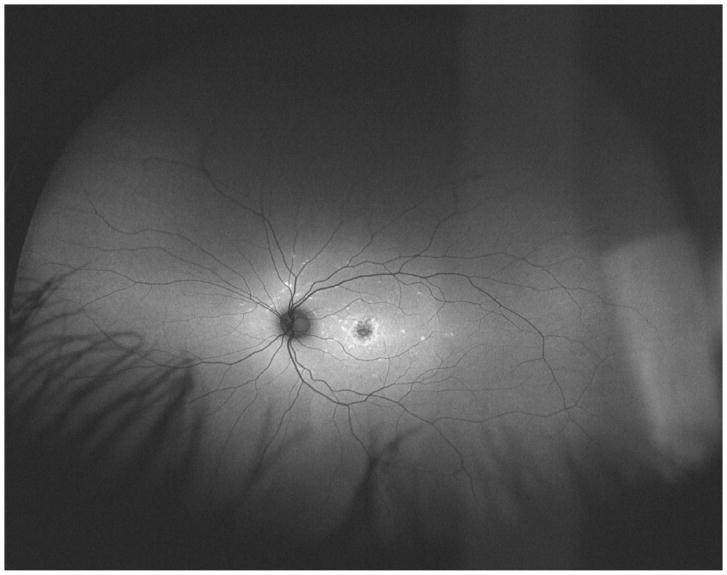
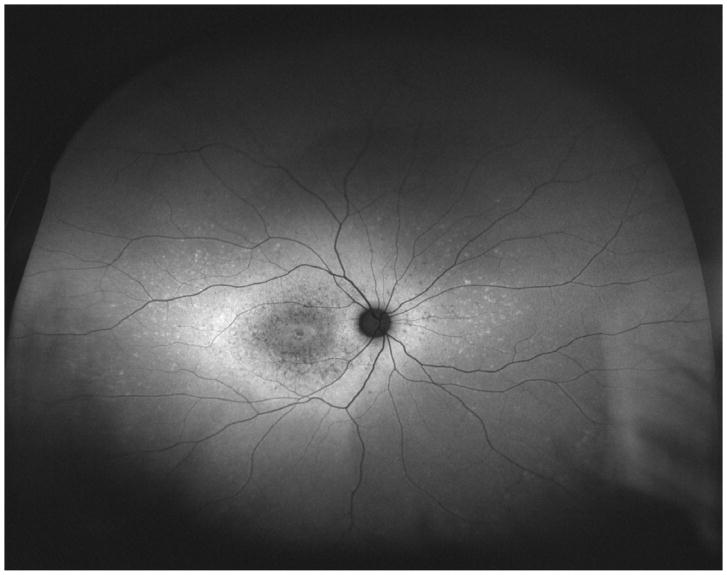
Studies using fundus autofluorescence imaging (FAF) have demonstrated different patterns of distribution of lipofuscin accumulation and RPE atrophy in STGD patients.16–19 Using standard 30-degree FAF, Fujinami et al. described three different patterns of FAF: type 1, consisting of localized low signal at the fovea surrounded by a homogeneous background of autofluorescence; type 2, consisting of localized low signal at the macula surrounded by widespread foci of high and low signals extending anteriorly to the vascular arcades; and type 3, consisting of multiple areas of low signal throughout the posterior pole, extending beyond the vascular arcades. 16 More recently, Klufas et al. used ultra-widefield FAF (UWF-FAF) to describe peripheral changes that would not have been detected using 30 or 50-degree FAF and proposed a new classification based on this method: type I, consisting of lesions confined to the macula without peripheral changes; type II, consisting of central atrophy with peripheral flecks only; and type III, consisting of central atrophy, with varying degrees of flecks and atrophy in the periphery.18
The impact of the peripheral changes observed in patients with STGD remains unclear. Klufas et al. suggested that more widespread disease, represented by type III, was associated with cone and rod loss on electroretinogram (ERG); however, this study had limited functional data. 18 Others have shown that patients with more functional loss on ERG at their initial assessment tended to evolve with a faster rate of atrophy enlargement detected on FAF over time and faster central scotoma progression on kinetic perimetry.14,20 Understanding the relationship between the spatial extent of FAF abnormalities and functional outcomes may allow us to use FAF to monitor disease progression and predict visual prognosis. Furthermore, FAF may be useful as an outcome measure in interventions such as vitamin A dimerization, lipofuscin removal, and gene therapy, and may also help in selecting appropriate retinal locations for the delivery of gene therapy. The aim of this study was to compare functional outcome measures among patients with STGD with changes confined to the macula and patients with both macular and peripheral changes based on UWF-FAF.
METHODS
This retrospective cross sectional study was performed at the Kellogg Eye Center, University of Michigan. The study was approved by the Michigan Institutional Review Board and conducted according to the Declaration of Helsinki.
Patient selection
We included patients with both a clinical and genetic molecular diagnosis of STGD who had UWF-FAF imaging available. The clinical diagnosis was established by the presence of central vision dysfunction and bilateral macular atrophy, with or without surrounding flecks on fundus exam. Genetic molecular diagnosis was established by the detection of two or more variants in the ABCA4 gene that were classified by the genetic testing laboratory and in silico tools as either pathogenic or likely pathogenic. For those on whom segregation was performed, variants were shown to be in trans. Patients with only one variant in the ABCA4 gene and/or those who also had pathogenic or likely pathogenic variants in autosomal dominant retinal degeneration genes were excluded.
Study protocol
Review of electronic medical records was performed, and clinical and functional data were collected. Clinical data included age, gender, age of onset (estimated by the age when patients first noticed visual impairment or when they were clinically diagnosed), and disease duration (estimated by the time between age of onset and the date when the UWF-FAF imaging was acquired). Functional data included visual acuity on the Snellen chart, peripheral visual fields acquired by widefield kinetic perimetry (Goldmann visual field), and full-field electroretinogram (ffERG). Peripheral visual field outcomes were calculated by measuring the area contained by the I4e, III4e, and IV4e isopters (minus defined scotomata) in planimetric square centimeters (cm2). The measurements were obtained with digital planimetry (Placom 45C digital planimeter; EngineerSupply, Lynchburg, Virginia, USA). Patients with poor fixation and/or cooperation during the testing and children younger than 10 years old were excluded. The ffERG was performed compliant with the standards of the International Society for Clinical Electrophysiology of Vision (ISCEV). The results from the ffERG were classified into three patterns, according to previously reported classification: pattern 1 presented with normal photopic and scotopic responses, pattern 2 presented with reduced photopic responses only, and pattern 3 presented with reduced scotopic and photopic responses. 21 All functional data corresponded to the visit when UWF-FAF was acquired, except the ffERG, which was performed in the screening visit (not necessarily when the UWF-FAF images were obtained).
WF-FAF Imaging
UWF-FAF imaging was obtained using Optos 200 Tx (Optos PLC, Dunefermline, United Kingdom), which reaches 200 degrees using a 532 nm excitation. The images were categorized into the UWF-FAF types previously described: type I represented by central atrophy with or without flecks limited to the posterior pole (55-degree); type II represented by central atrophy with flecks only extending beyond the posterior pole; and type III represented by central atrophy, varying degrees of flecks, and the presence of atrophy in the periphery. 18 The latter was divided into three subtypes of peripheral atrophy patterns: type IIIa, with mild to moderate atrophy (punctate) extending beyond the equator; type IIIb, with severe atrophy extending to the equator; and type IIIc, with severe atrophy extending beyond to the equator.18
Statistical analysis
Data were summarized numerically with counts and percentages, means and standard deviations, or Tukey’s five number summaries, as appropriate. Stacked bar charts and side-by-side boxplots were used to compare distributions across UWF-FAF types.
Linear models were used to assess the relationship between continuous response variables and disease classification. For eye-based measures (visual acuity, visual fields) a random effect term was included to account for correlated measurements within an individual. An overall F-test and pairwise t-tests with Tukey-Kramer adjustment were conducted to determine if classification means were statistically different. All tests were performed at 0.05.
Statistical analyses performed in R, version 3.4.0 (R Foundation for Statistical Computing, Vienna, Austria).
RESULTS
Clinical analysis
A total of sixty-five patients, who had genetic and clinical diagnosis of STGD as well as UWF-FAF available, were included in the analysis. Patients were classified into types based on UWF-FAF imaging. Twenty-seven subjects (41.5%) were classified as type I; 17 (26.2 %) as type II; 17 (26.2%) as type IIIa; 4 (6.2%) as type IIIb; and none as type IIIc. For statistical analysis purposes, types IIIa, IIIb and IIIc were collapsed together due to the small number of patients comprising these distinct subtypes. Of note, the assigned UWF-FAF classification was the same in both eyes of all patients in this cohort. Patients’ demographics are presented in the table. The total cohort had 33 (50.8%) males. There was no statistically significant difference in age at patient presentation among UWF-FAF types. Patients with UWF-FAF type III had an earlier onset of disease (p < 0.001, post-hoc) and longer disease duration (p=0.038, post-hoc) compared to patients with UWF-FAF type I.
Table.
Demographics accordingly to the ultra-widefield fundus autofluorescence imaging classification.
| Type I (n = 27) | Type II (n = 17) | Type III (n = 21) | p-value Pearson’s chi-squared or ANOVA Fp - value | |
|---|---|---|---|---|
| Gender, % male | 66.7% | 35.3% | 42.9% | 0.09 |
| Age at imaging (years) | 37.7 ± 16.2 | 35.2 ± 22.3 | 36.4 ± 19.4 | 0.92 |
| Age at onset (years) | 25.9 ± 12.5 | 22.1 ± 16.6 | 14.9 ± 12.0 | 0.02 |
| Disease duration (years) | 11.8 ± 11.0 | 13.1 ± 13.3 | 21.6 ± 15.9 | 0.04 |
Functional analysis
Visual function was evaluated using visual acuity, widefield kinetic perimetry, and ffERG. Results from both eyes (n=130) were individually analyzed for visual acuity and visual fields. ffERG classifications were the same for both eyes in all patients. Two patients (both classified as UWF-FAF type I) did not have ffERG results available.
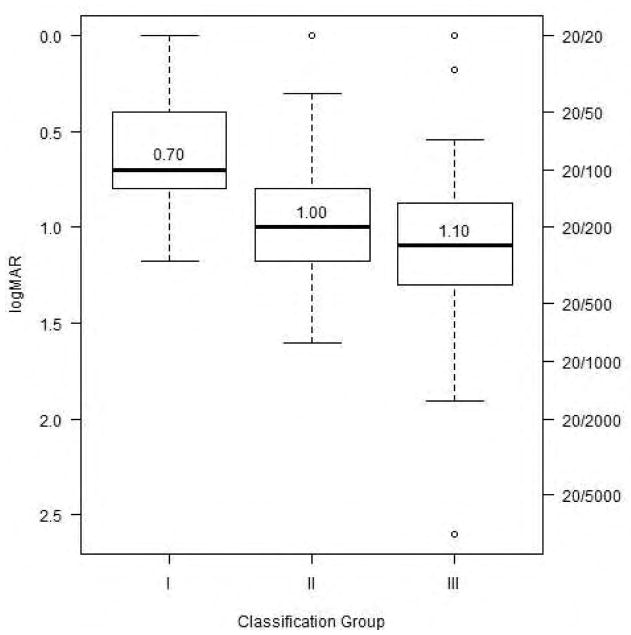
We compared the visual acuity among the three UWF-FAF types. Figure 1 illustrates the difference in mean visual acuities among the UWF-FAF types. There were significant differences among the UWF-FAF types (p < 0.001= 7.3e−5). Patients with type II and type III disease had markedly decreased visual acuity compared to patients with type I (p = 0.031 and p < 0.0001, respectively).
Figure 1.
Side-by-side boxplots of distributions of visual acuity in each ultra-widefield fundus autofluorescence type. Lower median visual acuity is associated with higher classification group.
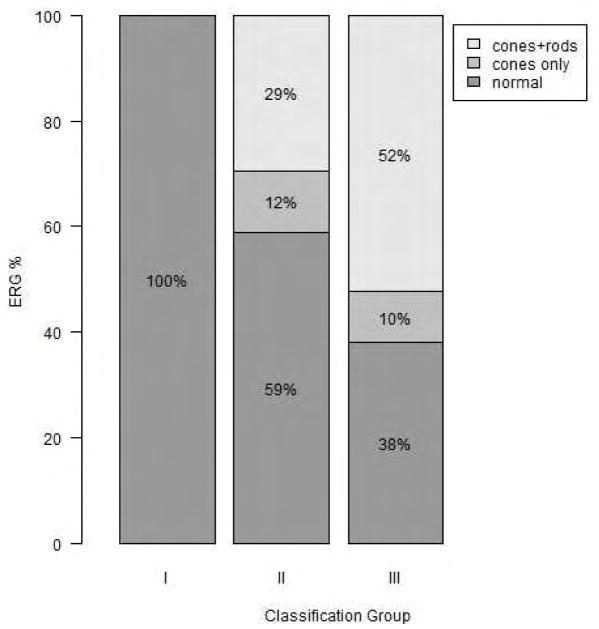
The distributions of results from ffERG were also statistically significantly different among the three UWF-FAF types (p < 0.001= 6.61e-6). Normal ffERGs were present in 68.3% of the total cohort; 100% (25/25) of patients with UWF-FAF type I had normal ffERG readings; 58.8% (10/17) of patients with UWF-FAF type II had normal ffERGs, and 38.1% (8/21) of patients with UWF-FAF type III had normal ffERG. Photopic only dysfunction was the rarest ffERG finding, present in only 11.7% (2/17) of the patients with UWF-FAF type II and 9.5% (2/21) of the patients with UWF-FAF type III. Combined photopic and scotopic dysfunction was present in 29.4% (5/17) and 52.4% (11/21) of patients with UWF-FAF types II and III, respectively. (Figure 2)
Figure 2.
Stacked barplot of distributions of full field electroretinogram patterns in each ultra-widefield fundus autofluorescence type. Normal full field electroretinogram is associated with lower classification group.
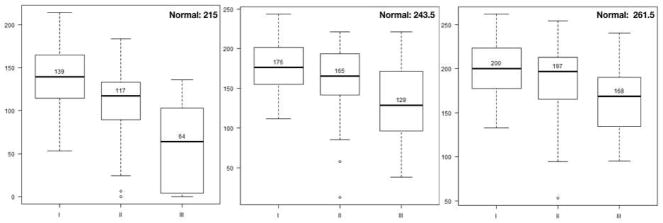
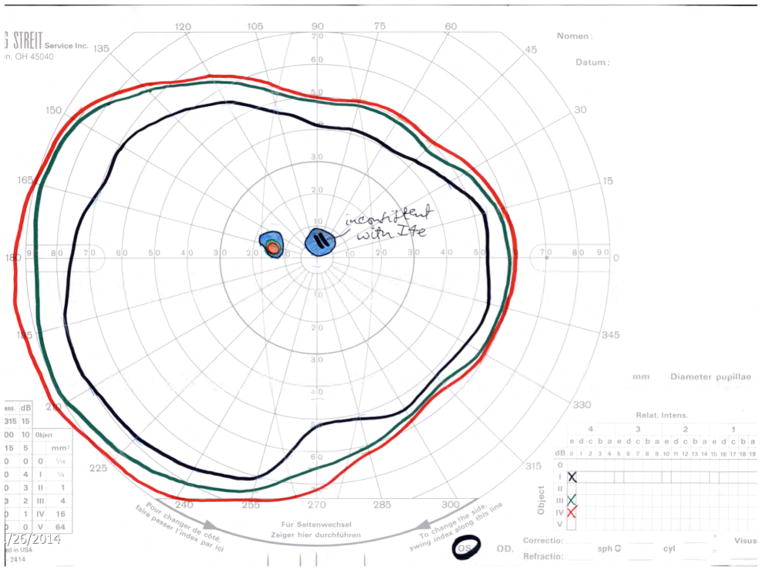
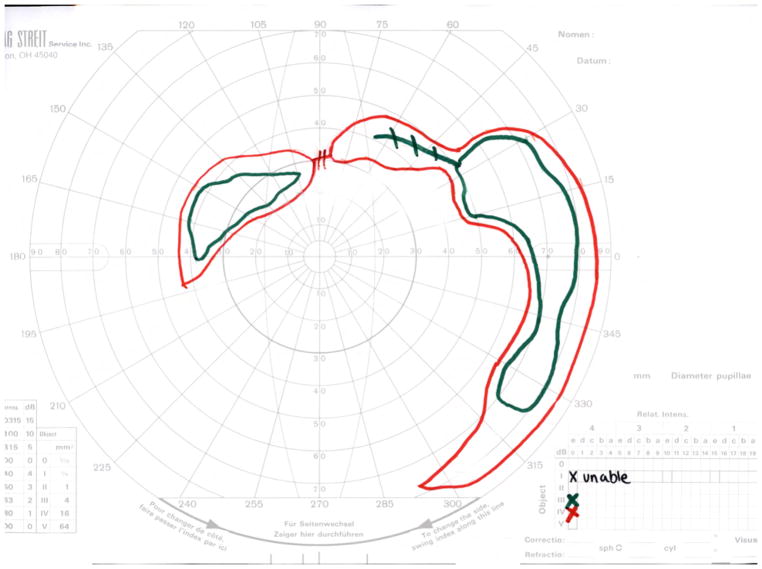
Widefield kinetic perimetry was used to assess the peripheral visual fields. In this study, all isopters were able to detect differences among UWF-FAF types (IV4e: p = 0.0013, III4e: p = 0.0003, I4e: p < 0.0001= 3.93e−8). Figure 3 depicts mean visual field areas in the three UWF-FAF types. Markedly constricted visual fields were detected using the two larger isopters, IV4e and III4e, in patients with UWF-FAF type III compared to patients with type I (p < 0.001 for each). The smallest isopter, I4e, detected more visual field loss in patients with UWF-FAF type III than in patients with type II (p = 0.0012), which in turn was greater than type I (p = 0.034). In six patients, the smaller I4e isopter was not detected (0 cm2 was used in analysis), but the larger isopters were all perceived. Five of these patients were classified as UWF-FAF type III, and one was classified as type II. The visual acuity was less than 20/125 in all six cases. Figure 4 illustrates the three UWF-FAF types with their corresponding visual fields.
Figure 3.
Side-by-side boxplots of distributions of peripheral visual fields areas in each ultra-widefield fundus autofluorescence type. Panels display different isopters: IV4e is on left; III4e is in middle; I4e is on right. For each isopter, lower median visual field area is associated with higher classification group. Note normal value for each isopter on top right of each panel.
Figure 4.
Ultra-widefield fundus autofluorescence types with corresponding representation of visual fields of three different patients. Upper left. Ultra-widefield fundus autofluorescence type I showing hypoautofluorescence centered in the fovea indicative of macular atrophy with surrounding sparse hyperautofluorescent flecks within the posterior pole. Bottom left. Visual field corresponding to the ultra-widefield fundus autofluorescence type I outlined above showing the presence of a central scotoma. Upper middle. Ultra-widefield fundus autofluorescence type II showing hypoautofluorescence centered in the fovea indicating macular atrophy with surrounding widespread hyperautofluorescent flecks extending beyond the vascular arcades. Bottom middle. Visual field corresponding to the ultra-widefield fundus autofluorescence type II showing the presence of central scotoma and mild constriction of all three tested isopters. Upper right. Ultra-widefield fundus autofluorescence type III showing widespread patches of hypoautofluorescence with surrounding widespread mottled hypoautofluorescence extending to the periphery. Bottom right. Visual field corresponding to the ultra-widefield fundus autofluorescence type III showing severe constriction of all three tested isopters with peripheral islands of preserved visual function with the IV4e and III4e isopters.
DISCUSSION
In the present study, we evaluated the disease extent on UWF-FAF in patients with STGD with proven mutations in the ABCA4 gene and correlated this data with functional outcome measures. The results demonstrated that patients with disease extending beyond the macula had more constricted visual fields, more dysfunction on ffERG, and worse visual acuity than patients with disease confined to the macula.
Associations between peripheral abnormalities on UWF-FAF and widefield kinetic perimetry in patients with STGD were evaluated in this study. Peripheral visual fields have been used as a functional outcome measure in patients with STGD; however, to the best of our knowledge, this approach has been limited to the evaluation of the central scotoma. Since macular involvement is the hallmark of STGD, the evaluation of the peripheral vision has been under-investigated. Overall, the areas of each tested isopter (IV4e, III4e and I4e) correlated inversely with the extent of the disease detected on UWF-FAF. This finding was more prominent and statistically significant when comparing patients with UWF-FAF type I, who had disease confined to the macula, with patients with UWF-FAF type III, who had both flecks and atrophic changes in the periphery.
Although there is a lack of data published on this topic in STGD, the association between abnormal autofluorescence on UWF-FAF and visual field defects has already been described in retinitis pigmentosa (RP), cone dystrophies, and cone-rod dystrophies.22–24 In patients with RP, the area of abnormal hypoautofluorescence correlated inversely with the visual field areas, suggesting that the extent of retinal degeneration in the periphery seen on UWF-FAF impacts peripheral vision. 23 Likewise, the abnormal autofluorescence centered in the macula in patients with cone and cone-rod dystrophy was also correlated with the I4e visual field area in those patients.22
In our study, the areas of the 2 larger isopters (IV4e and III4e) of patients with UWF-FAF type II were not statistically different from those of patients with type I; while there was a trend towards a difference in the area between patients with type I and patients with type III, although not statistically different. This suggests that the functional vision of patients with UWF-FAF type II was similar to that of patients with disease confined to the macula (UWF-FAF type I). The area of the smallest isopter (I4e) was significantly different between UWF-FAF types I and II and between types II and III. Thus, the presence of flecks alone in the periphery seems to mildly impact the peripheral visual fields. Verdina et al demonstrated that macular flecks on FAF imaging have less sensitivity on microperimetry than adjacent areas without flecks.25 Therefore, it is possible that widefield kinetic perimetry is not sensitive enough to detect the visual dysfunction due to the presence of flecks. These small losses in sensitivity may be inconsequential to the patient’s peripheral vision function.
Central visual acuity also correlated with the extent of the disease. This association between visual acuity and disease extent is already well established. 16,26 However, exceptions may occur in patients who have foveal sparing. Foveal sparing occurs mainly in patients with a late age of onset whose FAF depicts parafoveal atrophy and flecks either limited to the posterior pole or extending beyond the arcades. Cases with extensive widespread atrophy with concomitant foveal sparing have also been described, though less frequently. 18,27,28 Foveal sparing was not evaluated in this cohort.
Although most patients in our cohort presented with decreased visual acuity (20/200 or worse), most of them could still detect peripheral visual stimuli. This emphasizes one of the several limitations associated with the measurement of central visual acuity in patients with STGD. Visual acuity may oscillate due to shifts of the preferred retinal locus and may also reach a plateau in the majority of patients at 20/200. 29–32 The measurement of the area of central scotomas in patients with STGD is also challenging because fixation is decreased. 31,33,34 Microperimetry has proven to be valuable in measuring macular function and in detecting disease progression in patients with STGD. 31,35–39 However, its utility is limited to the macular region. Although STGD universally starts in the macula, over time the disease progresses toward the periphery. Cideciyan et al demonstrated the extent of the leading disease front (transition from heterogeneity to homogeneity signals) from 19 to 75 degrees beyond the optic nerve using near infrared reduced illuminance autofluorescence imaging (NIR-RAFI) in STGD. 15 Therefore, in patients whose transition areas of progression are located outside the posterior pole, the widefield kinetic perimetry may be suitable to follow these peripheral changes. Moreover, given that in STGD the area of the central scotoma usually exceeds the area of hypoautofluorescent abnormalities in the posterior pole, 31 it’s also possible that the peripheral areas of abnormal hypofluorescence may be underestimated on the peripheral visual fields. Thus, the UWF-FAF alone may not be adequate to estimate the areas of peripheral vision loss and widefield kinetic perimetry may be still necessary.
This study demonstrated that normal cone and rod function on ffERG was more prevalent (100%) in patients with disease confined to the macula (UWF-FAF type I) while cone and rod-dysfunction was more prevalent (52%) in patients with atrophy extending to the periphery (UWF-FAF type III). This finding is consistent with previous studies that established an association between the patterns of functional loss on ffERG and the extent of atrophy. 14,20,40 McBain et al reported that the ffERG at the baseline is the best predictor of the rate of RPE atrophy expansion: patients with macular and cone-rod dysfunction at baseline had the fastest rate of atrophy enlargement (1.97mm2/year), followed by patients with macular and cone dysfunction only (1.89mm2/year), and then by patients with macular dysfunction only (1.09mm2/year).20 In addition, Chen et al found that the larger the atrophy, the poorer the baseline ERG response had been in patients with STGD. 40
Patients with UWF-FAF type II presented with all the three ERG patterns: the majority (58%) had normal ERG, and the minority (11%) had dysfunction of cones and rods. This finding, along with evidence from widefield kinetic perimetry, disease duration, and age of onset, suggests that patients with UWF-FAF type II behaved more like type I than type III.
The age of onset and disease duration of each UWF-FAF type showed significant differences among the groups. We found that patients with disease confined to the macula (type I) had a later age of onset and shorter disease duration than did patients with widespread disease (type III). Our findings are in accordance with other studies, which demonstrate a positive correlation between duration of disease and atrophy extent. 2,4,16,40
It is noteworthy that Progstar report number two 26 found peripheral abnormalities in only 1.6% of its patients, while peripheral changes were detected in 58.6% of the patients in our study (UWF-FAF types II and III). We believe this discrepancy may be due to Progstar’s use of 30-degree FAF imaging, which could miss lesions beyond the posterior pole. We also found that many of our patients (41.5%) had atrophy with or without flecks limited to the posterior pole (UWF-FAF type I). The frequency and distribution of flecks and atrophic changes throughout the posterior pole and the periphery is variable in previously published papers with different methods of feature identification (color or FAF) in STGD. 14,16,18,21,41 Using 30-degree FAF, Fujinami et al found that patients with type I were the second most prevalent, while Klufas et al and Zahid et al found it to be the least prevalent. 16,18,42 Although UWF-FAF and 30-degree FAF imaging are not necessarily comparable for types II and III, it is reasonable to assume that type I is the same in both classifications. Therefore, rather than being due to imaging type, this discrepancy may be due to the progressive nature of this condition. Although the natural history of the progression of atrophy in STGD is still under investigation,30 it is known that the disease progresses at different rates over time and that the FAF patterns can shift over time. 11,12,15,16,20,43 For instance, Fujinami et al demonstrated that 42% of patients from type I progressed to type II and 12% from type II progressed to type III after a mean follow-up of 9.1 years. 16
One limitation of our study is its retrospective design and lack of follow-up data. Moreover, although the widefield kinetic perimetry testing followed the same strategy and standards for all patients, we did not account for test-retest variability measurements for each individual patient. 44–46 In addition, by grouping subtypes IIIa, IIIb and IIIc, this study was unable to determine whether the extent or the severity of atrophy in the periphery was responsible for the peripheral visual field loss of our patients.
Our results suggest that the presence of peripheral changes observed on UWF-FAF impacts the retinal function. Patients with widespread disease may progress with constriction of peripheral visual fields in addition to central vision loss. Based on our findings, the use of UWF-FAF images may provide useful information for estimating and prognosticating both peripheral and central visual function in patients with STGD. In addition, the loss of peripheral visual field in a subset of patients in our study contradicts the conventional wisdom that STGD is a maculopathy with preservation of peripheral vision, which may affect patient counseling. However, longitudinal studies addressing peripheral visual field changes over time and their correlation with atrophy progression rates are warranted to establish widefield kinetic perimetry as a reliable functional outcome measure.
Supplementary Material
Acknowledgments
This research was supported by the Foundation Fighting Blindness grant CF-CL-0616-0698-UMICH and by the National Institute of Health grant K23EY026985.
Footnotes
Disclosure Statement: The authors have nothing to disclose.
Publisher's Disclaimer: This is a PDF file of an unedited manuscript that has been accepted for publication. As a service to our customers we are providing this early version of the manuscript. The manuscript will undergo copyediting, typesetting, and review of the resulting proof before it is published in its final citable form. Please note that during the production process errors may be discovered which could affect the content, and all legal disclaimers that apply to the journal pertain.
References
- 1.Michaelides M, Hunt DM, Moore AT. The genetics of inherited macular dystrophies. J Med Genet. 2003;40(9):641–650. doi: 10.1136/jmg.40.9.641. [DOI] [PMC free article] [PubMed] [Google Scholar]
- 2.Fujinami K, Zernant J, Chana RK, et al. Clinical and molecular characteristics of childhood-onset Stargardt disease. Ophthalmology. 2015;122(2):326–334. doi: 10.1016/j.ophtha.2014.08.012. [DOI] [PMC free article] [PubMed] [Google Scholar]
- 3.Lambertus S, van Huet RA, Bax NM, et al. Early-onset stargardt disease: phenotypic and genotypic characteristics. Ophthalmology. 2015;122(2):335–344. doi: 10.1016/j.ophtha.2014.08.032. [DOI] [PubMed] [Google Scholar]
- 4.Westeneng-van Haaften SC, Boon CJ, Cremers FP, et al. Clinical and genetic characteristics of late-onset Stargardt’s disease. Ophthalmology. 2012;119(6):1199–1210. doi: 10.1016/j.ophtha.2012.01.005. [DOI] [PubMed] [Google Scholar]
- 5.Allikmets R, Singh N, Sun H, et al. A photoreceptor cell-specific ATP-binding transporter gene (ABCR) is mutated in recessive Stargardt macular dystrophy. Nat Genet. 1997;15(3):236–246. doi: 10.1038/ng0397-236. [DOI] [PubMed] [Google Scholar]
- 6.Westerfeld C, Mukai S. Stargardt’s disease and the ABCR gene. Semin Ophthalmol. 2008;23(1):59–65. doi: 10.1080/08820530701745249. [DOI] [PubMed] [Google Scholar]
- 7.Molday RS. Insights into the Molecular Properties of ABCA4 and Its Role in the Visual Cycle and Stargardt Disease. Prog Mol Biol Transl Sci. 2015;134:415–431. doi: 10.1016/bs.pmbts.2015.06.008. [DOI] [PubMed] [Google Scholar]
- 8.Glazer LC, Dryja TP. Understanding the etiology of Stargardt’s disease. Ophthalmol Clin North Am. 2002;15(1):93–100. viii. doi: 10.1016/s0896-1549(01)00011-6. [DOI] [PubMed] [Google Scholar]
- 9.Cideciyan AV, Aleman TS, Swider M, et al. Mutations in ABCA4 result in accumulation of lipofuscin before slowing of the retinoid cycle: a reappraisal of the human disease sequence. Hum Mol Genet. 2004;13(5):525–534. doi: 10.1093/hmg/ddh048. [DOI] [PubMed] [Google Scholar]
- 10.Tanna P, Strauss RW, Fujinami K, Michaelides M. Stargardt disease: clinical features, molecular genetics, animal models and therapeutic options. Br J Ophthalmol. 2017;101(1):25–30. doi: 10.1136/bjophthalmol-2016-308823. [DOI] [PMC free article] [PubMed] [Google Scholar]
- 11.Cukras CA, Wong WT, Caruso R, et al. Centrifugal expansion of fundus autofluorescence patterns in Stargardt disease over time. Arch Ophthalmol. 2012;130(2):171–179. doi: 10.1001/archophthalmol.2011.332. [DOI] [PMC free article] [PubMed] [Google Scholar]
- 12.Cideciyan AV, Swider M, Aleman TS, et al. ABCA4 disease progression and a proposed strategy for gene therapy. Hum Mol Genet. 2009;18(5):931–941. doi: 10.1093/hmg/ddn421. [DOI] [PMC free article] [PubMed] [Google Scholar]
- 13.Walia S, Fishman GA. Natural history of phenotypic changes in Stargardt macular dystrophy. Ophthalmic Genet. 2009;30(2):63–68. doi: 10.1080/13816810802695550. [DOI] [PubMed] [Google Scholar]
- 14.Zahid S, Jayasundera T, Rhoades W, et al. Clinical phenotypes and prognostic full-field electroretinographic findings in Stargardt disease. Am J Ophthalmol. 2013;155(3):465–473. e463. doi: 10.1016/j.ajo.2012.09.011. [DOI] [PMC free article] [PubMed] [Google Scholar]
- 15.Cideciyan AV, Swider M, Schwartz SB, Stone EM, Jacobson SG. Predicting Progression of ABCA4-Associated Retinal Degenerations Based on Longitudinal Measurements of the Leading Disease Front. Invest Ophthalmol Vis Sci. 2015;56(10):5946–5955. doi: 10.1167/iovs.15-17698. [DOI] [PMC free article] [PubMed] [Google Scholar]
- 16.Fujinami K, Lois N, Mukherjee R, et al. A longitudinal study of Stargardt disease: quantitative assessment of fundus autofluorescence, progression, and genotype correlations. Invest Ophthalmol Vis Sci. 2013;54(13):8181–8190. doi: 10.1167/iovs.13-12104. [DOI] [PubMed] [Google Scholar]
- 17.Gomes NL, Greenstein VC, Carlson JN, et al. A comparison of fundus autofluorescence and retinal structure in patients with Stargardt disease. Invest Ophthalmol Vis Sci. 2009;50(8):3953–3959. doi: 10.1167/iovs.08-2657. [DOI] [PMC free article] [PubMed] [Google Scholar]
- 18.Klufas MA, Tsui I, Sadda SR, Hosseini H, Schwartz SD. Ultrawidefield Autofluoresence in Abca4 Stargardt Disease. Retina. doi: 10.1097/IAE.0000000000001567. [DOI] [PubMed] [Google Scholar]
- 19.Lois N, Halfyard AS, Bird AC, Holder GE, Fitzke FW. Fundus autofluorescence in Stargardt macular dystrophy-fundus flavimaculatus. Am J Ophthalmol. 2004;138(1):55–63. doi: 10.1016/j.ajo.2004.02.056. [DOI] [PubMed] [Google Scholar]
- 20.McBain VA, Townend J, Lois N. Progression of retinal pigment epithelial atrophy in stargardt disease. Am J Ophthalmol. 2012;154(1):146–154. doi: 10.1016/j.ajo.2012.01.019. [DOI] [PubMed] [Google Scholar]
- 21.Lois N, Holder GE, Bunce C, Fitzke FW, Bird AC. Phenotypic subtypes of Stargardt macular dystrophy-fundus flavimaculatus. Arch Ophthalmol. 2001;119(3):359–369. doi: 10.1001/archopht.119.3.359. [DOI] [PubMed] [Google Scholar]
- 22.Oishi M, Oishi A, Ogino K, et al. Wide-field fundus autofluorescence abnormalities and visual function in patients with cone and cone-rod dystrophies. Invest Ophthalmol Vis Sci. 2014;55(6):3572–3577. doi: 10.1167/iovs.14-13912. [DOI] [PubMed] [Google Scholar]
- 23.Oishi A, Oishi M, Ogino K, Morooka S, Yoshimura N. Wide-Field Fundus Autofluorescence for Retinitis Pigmentosa and Cone/Cone-Rod Dystrophy. Adv Exp Med Biol. 2016;854:307–313. doi: 10.1007/978-3-319-17121-0_41. [DOI] [PubMed] [Google Scholar]
- 24.Robson AG, Saihan Z, Jenkins SA, et al. Functional characterisation and serial imaging of abnormal fundus autofluorescence in patients with retinitis pigmentosa and normal visual acuity. Br J Ophthalmol. 2006;90(4):472–479. doi: 10.1136/bjo.2005.082487. [DOI] [PMC free article] [PubMed] [Google Scholar]
- 25.Verdina T, Tsang SH, Greenstein VC, et al. Functional Analysis of Retinal Flecks in Stargardt Disease. J Clin Exp Ophthalmol. 2012:3. doi: 10.4172/2155-9570.1000233. [DOI] [PMC free article] [PubMed] [Google Scholar]
- 26.Kong X, Strauss RW, Michaelides M, et al. Visual Acuity Loss and Associated Risk Factors in the Retrospective Progression of Stargardt Disease Study (ProgStar Report No. 2) Ophthalmology. 2016;123(9):1887–1897. doi: 10.1016/j.ophtha.2016.05.027. [DOI] [PubMed] [Google Scholar]
- 27.van Huet RA, Bax NM, Westeneng-Van Haaften SC, et al. Foveal sparing in Stargardt disease. Invest Ophthalmol Vis Sci. 2014;55(11):7467–7478. doi: 10.1167/iovs.13-13825. [DOI] [PubMed] [Google Scholar]
- 28.Fujinami K, Sergouniotis PI, Davidson AE, et al. Clinical and molecular analysis of Stargardt disease with preserved foveal structure and function. Am J Ophthalmol. 2013;156(3):487–501. e481. doi: 10.1016/j.ajo.2013.05.003. [DOI] [PubMed] [Google Scholar]
- 29.Testa F, Melillo P, Di Iorio V, et al. Macular function and morphologic features in juvenile stargardt disease: longitudinal study. Ophthalmology. 2014;121(12):2399–2405. doi: 10.1016/j.ophtha.2014.06.032. [DOI] [PMC free article] [PubMed] [Google Scholar]
- 30.Strauss RW, Ho A, Munoz B, et al. The Natural History of the Progression of Atrophy Secondary to Stargardt Disease (ProgStar) Studies: Design and Baseline Characteristics: ProgStar Report No. 1. Ophthalmology. 2016;123(4):817–828. doi: 10.1016/j.ophtha.2015.12.009. [DOI] [PubMed] [Google Scholar]
- 31.Bernstein A, Sunness JS, Applegate CA, Tegins EO. Mapping the Dense Scotoma and Its Enlargement in Stargardt Disease. Retina. 2016;36(9):1741–1750. doi: 10.1097/IAE.0000000000001003. [DOI] [PMC free article] [PubMed] [Google Scholar]
- 32.Kong X, Strauss RW, Cideciyan AV, et al. Visual Acuity Change over 12 Months in the Prospective Progression of Atrophy Secondary to Stargardt Disease (ProgStar) Study: ProgStar Report Number 6. Ophthalmology. doi: 10.1016/j.ophtha.2017.04.026. [DOI] [PubMed] [Google Scholar]
- 33.Sunness JS, Applegate CA, Haselwood D, Rubin GS. Fixation patterns and reading rates in eyes with central scotomas from advanced atrophic age-related macular degeneration and Stargardt disease. Ophthalmology. 1996;103(9):1458–1466. doi: 10.1016/s0161-6420(96)30483-1. [DOI] [PMC free article] [PubMed] [Google Scholar]
- 34.Sunness JS. What you see is not always what you get in atrophic macular disease. Retin Cases Brief Rep. 2008;2(3):205–208. doi: 10.1097/ICB.0b013e31806011e6. [DOI] [PubMed] [Google Scholar]
- 35.Cideciyan AV, Swider M, Aleman TS, et al. Macular function in macular degenerations: repeatability of microperimetry as a potential outcome measure for ABCA4-associated retinopathy trials. Invest Ophthalmol Vis Sci. 2012;53(2):841–852. doi: 10.1167/iovs.11-8415. [DOI] [PMC free article] [PubMed] [Google Scholar]
- 36.Meleth AD, Mettu P, Agron E, et al. Changes in retinal sensitivity in geographic atrophy progression as measured by microperimetry. Invest Ophthalmol Vis Sci. 2011;52(2):1119–1126. doi: 10.1167/iovs.10-6075. [DOI] [PMC free article] [PubMed] [Google Scholar]
- 37.Verdina T, Greenstein VC, Sodi A, et al. Multimodal analysis of the Preferred Retinal Location and the Transition Zone in patients with Stargardt Disease. Graefes Arch Clin Exp Ophthalmol. 2017;255(7):1307–1317. doi: 10.1007/s00417-017-3637-6. [DOI] [PMC free article] [PubMed] [Google Scholar]
- 38.Mori F, Ishiko S, Kitaya N, et al. Scotoma and fixation patterns using scanning laser ophthalmoscope microperimetry in patients with macular dystrophy. Am J Ophthalmol. 2001;132(6):897–902. doi: 10.1016/s0002-9394(01)01216-8. [DOI] [PubMed] [Google Scholar]
- 39.Schonbach EM, Wolfson Y, Strauss RW, et al. Macular Sensitivity Measured With Microperimetry in Stargardt Disease in the Progression of Atrophy Secondary to Stargardt Disease (ProgStar) Study: Report No. 7. JAMA Ophthalmol. 2017;135(7):696–703. doi: 10.1001/jamaophthalmol.2017.1162. [DOI] [PMC free article] [PubMed] [Google Scholar]
- 40.Chen B, Tosha C, Gorin MB, Nusinowitz S. Analysis of autofluorescent retinal images and measurement of atrophic lesion growth in Stargardt disease. Exp Eye Res. 2010;91(2):143–152. doi: 10.1016/j.exer.2010.03.021. [DOI] [PubMed] [Google Scholar]
- 41.Fishman GA. Fundus flavimaculatus. A clinical classification. Arch Ophthalmol. 1976;94(12):2061–2067. doi: 10.1001/archopht.1976.03910040721003. [DOI] [PubMed] [Google Scholar]
- 42.Zahid S, Peeler C, Khan N, et al. Digital quantification of Goldmann visual fields (GVFs) as a means for genotype-phenotype comparisons and detection of progression in retinal degenerations. Adv Exp Med Biol. 2014;801:131–137. doi: 10.1007/978-1-4614-3209-8_17. [DOI] [PMC free article] [PubMed] [Google Scholar]
- 43.Strauss RW, Munoz B, Ho A, et al. Incidence of Atrophic Lesions in Stargardt Disease in the Progression of Atrophy Secondary to Stargardt Disease (ProgStar) Study: Report No. 5. JAMA Ophthalmol. 2017;135(7):687–695. doi: 10.1001/jamaophthalmol.2017.1121. [DOI] [PMC free article] [PubMed] [Google Scholar]
- 44.Cideciyan AV, Swider M, Aleman TS, et al. ABCA4-associated retinal degenerations spare structure and function of the human parapapillary retina. Invest Ophthalmol Vis Sci. 2005;46(12):4739–4746. doi: 10.1167/iovs.05-0805. [DOI] [PMC free article] [PubMed] [Google Scholar]
- 45.Greenstein VC, Santos RA, Tsang SH, et al. Preferred retinal locus in macular disease: characteristics and clinical implications. Retina. 2008;28(9):1234–1240. doi: 10.1097/IAE.0b013e31817c1b47. [DOI] [PMC free article] [PubMed] [Google Scholar]
- 46.Bethlehem RA, Dumoulin SO, Dalmaijer ES, et al. Decreased fixation stability of the preferred retinal location in juvenile macular degeneration. PLoS One. 2014;9(6):e100171. doi: 10.1371/journal.pone.0100171. [DOI] [PMC free article] [PubMed] [Google Scholar]
Associated Data
This section collects any data citations, data availability statements, or supplementary materials included in this article.


