

Abstract
The era of highly active antiretroviral therapy (HAART) has controlled AIDS and its related disorders considerably; however, prevalence of HIV-1-associated neurocognitive disorders (HAND) has been on the rise in the post-HAART era. In view of these developments, we investigated whether a HAART drug combination of 3’-Azido-2’, 3’-deoxythymidine (AZT) and Indinavir (IDV) can alter the functionality of the blood-brain barrier (BBB) endothelial cells, thereby exacerbating this condition. Viability of hCMEC/D3 cells (in vitro model of BBB) that were exposed to these drugs was significantly reduced after 72 hr treatment, in a dose-dependent manner. Reactive oxygen species (ROS) were highly elevated after the exposure, indicating that mechanisms that induce oxidative stress were involved. Measures of oxidative stress parameters, such as glutathione (GSH) and malondialdehyde (MDA), were found to be altered in the treated groups. Loss of mitochondrial membrane potential (Ψm), as assessed with fluorescent microscopy and decreased levels of ATP, indicated that cytoxicity was mediated through mitochondrial dysfunction. Furthermore, AZT + IDV treatment caused apoptosis in endothelial cells, as assessed by the expression of cytochrome c and procaspase-3 proteins. Pretreatment with thiol antioxidant N-acetylcysteine amide (NACA) reversed some of the pro-oxidant effects of AZT+IDV. Results from our in vitro studies indicate that the AZT + IDV combination may affect the BBB in HIV infected individuals treated with HAART drugs.
Keywords: AZT, indinavir, HAART, oxidative stress, blood-brain barrier, mitochondrial dysfunction, N-acetylcysteine amide
Introduction
Human immunodeficiency virus-1 (HIV-1) infection is associated with a high prevalence of disorders related to the central nervous system [1-3]. About one third of the infected population develops HIV-1-associated neurocognitive disorders (HAND) like dementia, motor impairments, and behavioral dysfunctions [4,5]. The introduction of highly active antiretroviral therapy (HAART), the combination of three or more classes of antiretroviral drugs to suppress viral replication, has led to a considerable decline in the HIV disease progression rates and related opportunistic infections [6]. Despite these significant improvements in health conditions, HAND remains as a significant public health concern [7-10].
The blood-brain barrier (BBB), a physical and metabolic barrier between the central nervous system and the systemic circulation, helps regulate and protect the microenvironment of the brain [11,12]. Dysfunction of the BBB has been reported in a variety of neurological disorders, including brain and spinal cord trauma [13,14], multiple sclerosis [15], HIV-1-associated dementia [16], Alzheimer’s disease [17] obesity [18], diabetes [19,20], lysosomal storage diseases [21,22], and Parkinson’s disease [23]. A mild disruption of the BBB is frequently seen in AIDS patients with neurological disorders, as compared to AIDS patients without dementia or seronegative control [24]. Studies from our lab and other studies have shown that viral proteins like glyco protein (gp120) and transregulatory protein (Tat) can induce oxidative stress and alter the integrity of the BBB [25,26]. Methamphetamine and alcohol have also been reported in in vitro studies to induce oxidative stress and disrupt the BBB layer [27,28].
Accumulated evidence is suggesting that prolonged use of HAART to treat HIV patients may contribute to an overall increase in amyloid and hyperphosphorylated Tau deposition, two of the key hallmarks of neurocognitive disorders like Alzheimer’s disease [29,30]. Recent studies have also shown that neurocognition improved significantly following discontinuation of HAART in subjects with a preserved immune function [31]. Previously, according to the International U.S. AIDS Panel, no known adverse effects have been reported in patients treated with a combination of 3’-azido-2’, 3’-deoxythymidine (AZT), and indinavir (IDV) (one of the most common therapeutic regimens recommended in HAART) [32]. However, several toxicities related to these drugs have been recently reported. AZT and IDV have been shown in various studies to cause hepatic steatosis, lactic acidosis, encephalopathy, lipodystrophy, peripheral neuropathy, and myopathy [33-35]. One of the major toxicities of these drugs involves the impairment of the function of vascular endothelium [36,37]. Loss of proper endothelial function is an indicator of vascular diseases and is often seen in the development of atherosclerosis in HAART-treated patients [38]. Increased reactive oxygen species (ROS) and a decrease in antioxidants contribute to endothelial damage in HAART patients [39]. Most of these studies have been directed towards exploring the effect of HAART drugs on cardiovascular endothelium. However, no known studies have been conducted to determine the effect of these drugs on the BBB and their impact on neurocognition in HAART patients.
In this current study, we hypothesized that the antiretroviral drugs AZT and IDV cause endothelial dysfunction in the BBB through oxidative stress and mitochondrial dysfunction, thereby exacerbating HIV-1-associated neurocognitive disorders. We used immortalized human brain endothelial capillary cells (hCMEC/D3) as a model to elucidate the effects and the potential molecular mechanisms involved in HAART drug induce toxicity on the BBB. N-acetylcysteine amide (NACA) a low molecular weight thiol antioxidant has been shown to protect in vitro and in vivo against Methamphetamine and HIV proteins induced oxidative stress [40,25]. The ability of NACA to confer protection against AZT+IDV induced oxidative stress was also investigated. This study may provide important information about the effect of antiviral drugs on BBB in AIDS patients with HAND, and can help in developing therapeutic strategies for the prevention and treatment of HIV-1-associated neurocognitive disorders.
Materials and Methods
Materials
N-(1-pyrenyl)-maleimide (NPM) was purchased from Sigma (St. Louis, MO). N-acetylcysteine amide was provided by Dr. Glenn Goldstein (David Pharmaceuticals, NewYork, NY, USA). High-performance liquid chromatography (HPLC) grade solvents were purchased from Fisher Scientific (Fair Lawn, NJ). AZT and IDV were a gift from the National Institutes of Health AIDS Research and Reference Reagent Program. JC-1 dye (5,5′,6,6′,-tetrachloro-1,1′,3,3′,-tetraethylben- zimidazolyl carbocyanine iodide) and Fura-2AM were purchased from Invitrogen (San Diego, CA). Calcein AM was purchased from Biotium, Inc, CA. All other chemicals were purchased from Sigma (St. Louis, MO), unless stated otherwise.
Methods
Culture of human brain microvascular endothelial cells (hCMEC/D3)
As an in vitro BBB model, immortalized human brain endothelial cells, hCMEC/D3 (a gift from Dr. Pierre Couraud), were plated on 25 cm2 tissue culture flasks and maintained in EBM-2 medium in humidified 5% CO2/95% air at 37 °C. The culture medium was changed twice a week and endothelial cells at passages 28 34 were used in this study. A serum-free and growth-factor-free medium was used in the experiments. All assays were performed in triplicate and each experiment was repeated three times. The EBM-2 medium (Lonza, Walkersville, MD), was supplemented with VEGF (Vascular endothelial growth factor), IGF-1 (Insulin like growth factor-1), EGF (Endothelial growth factor), basic FGF (Fibroblast growth factor), hydrocortisone, ascorbate, gentamycin and 2.5% fetal bovine serum (FBS), as recommended by the manufacturer.
Cytotoxicity assay
hCMEC/D3 cells were seeded in a 96-well plate, at densities of approximately 8×10³ cells per well, and were allowed to attach for 24 hr. The media was then discarded, and the cells were treated with AZT + IDV combination for 24 hr and 72 hr in a serum-free media. The cells were then washed three times with PBS, and 100 μl of 0.4 μM Calcein AM (Biotium Inc.) in PBS was added to each well for 30 min at 37 °C. The fluorescence was measured with an excitation wavelength at 485 nm and an emission wavelength of 530 nm, using a microplate reader (Fluostar, BMG Labtechnologies, Durham, NC, USA).
Reactive oxygen species (ROS) measurement
Intracellular ROS generation was measured using a well characterized probe, 2′,7′,-dichlorofluorescein diacetate (DCFH2-DA) [41]. DCFH2-DA is hydrolyzed by esterases to dichlorofluorescein (DCFH2), which is trapped within the cell. This nonfluorescent molecule is then oxidized to fluorescent dichlorofluorescein (DCF) by the action of cellular oxidants. The cells were exposed to the drugs for 48 hr. Protective effects of NACA were studied by first preincubating cells with NACA for 1 hr and were treated with AZT+ IDV for the required time period. A DCFH2-DA stock solution (in DMSO) of 1mg/ml was diluted in serum-free media to yield a 100 μM working solution. Cells were washed twice with PBS and then incubated with a DCFH2-DA working solution for half an hour in a dark environment (37 °C incubator). The cells were washed with PBS and then fluorescence was measured using a microplate reader.
Determination of glutathione (GSH) levels
The level of GSH in the cells was determined by RP-HPLC, according to the method developed in our laboratory [42]. The HPLC system (Thermo Electron Corporation) consisted of a Finnigan Spectra System vacuum membrane degasser (model SCM1000), a gradient pump (model P2000), autosampler (model AS3000), and a fluorescence detector (model FL3000) with λex=330 nm and λem=376 nm. The HPLC column used was a Reliasil ODS-1 C18 column (5-μm packing material) with 250×4.6 mm i.d (Column Engineering, Ontario, CA). The mobile phase (70% acetonitrile and 30% water) was adjusted to a pH of 2 with acetic acid and o-phosphoric acid. The NPM derivatives of GSH were eluted from the column isocratically at a flow rate of 1 ml/min. The cell pellets obtained were homogenized in 1 ml of serine borate buffer (SBB,100 mM Tris buffer containing 10 mM borate and 5 mM serine with 1 mM diethylene triaminepentacetic acid; Ph=7.4), centrifuged, and 250 μl of the supernatant were added to 750 μl of 1 mM NPM. The resulting solution was incubated at room temperature for 5 min, and the reaction was stopped by adding 10 μl of 2N HCl. The samples were then filtered through a 0.45 μm filter and injected into the HPLC system.
Determination of malondialdehyde (MDA)
The MDA levels were determined according to the method described elsewhere [43]. Briefly, 550 μl of 5% trichloroacetic acid (TCA) and 100 μl of 500 ppm butylated hydroxytoluene (BHT) in methanol were added to 350 μl of the cell homogenates, and boiled for 30 min in a water bath. After cooling on ice, the mixtures were centrifuged, and the supernatant was collected and mixed 1:1 with saturated thiobarbituric acid (TBA). The mixture was again heated in a water bath for 30 min, followed by cooling on ice. 500 μl of the mixture were extracted with 1 ml of n-butanol and centrifuged to facilitate the separation of phases. The resulting organic layers were first filtered through 0.45 μm filters and then injected into the HPLC system (Shimadzu, US), which consisted of a pump (model LC-6A), a Rheodyne injection valve and a fluorescence detector (model RF 535). The column was a 100 × 4.6 mm i.d C18 column (3 μm packing material, Astec, Bellefonte, PA). The mobile phase used contained 69.4% sodium phosphate buffer, 30% acetonitrile, and 0.6% tetrahydrofuran. The fluorescent product was monitored at λex= 515 nm and λem= 550 nm. Malondialdehyde bis (dimethyl acetal), which gives malondialdehyde on acid treatment, was used as a standard.
Measurement of mitochondrial membrane potential (ΔΨm)
Mitochondrial membrane potential was determined using potentiometric fluorescent dye JC-1 (5,5′,6,6′,-tetrachloro-1,1′,3,3′,-tetraethylbenzimidazolyl carbocyanine iodide; Invitrogen, San Diego, CA, USA). hCMEC/D3 cells were cultured in glass bottom petri dishes and were treated with AZT + IDV for 72 hr. The cells were washed twice with PBS and then incubated with JC-1 dye (1 μg/ 1 ml) in media for 30 min. The cells were then washed and placed under a fluorescent microscope in phenol red free media. The stained cells were observed with an Olympus IX51 inverted microscope at 400× total magnification with a UPLFLN 60 × NA 1.25 objective. FITC (EX 482/35 506DM EM536/40) and TexasRed (EX 562/40 593DM EM 692/40) filters were used (Brightline). Images were captured with a Hamamatsu ORCA285 CCD camera. The shutters, filters and camera were controlled using SlideBook software (Intelligent Imaging Innovations, Denver, CO).
Measurement of ATP levels
Total ATP was quantified using a commercially available luciferin–luciferase assay kit (ENLITEN ATP assay kit, Promega, WI). A series of dilutions ranging from 0 to 1×10-13 M of the ATP stock standard were made using ATP free water supplied in the kit. Using sterile disposable tips, 100 μl aliquots of standards were pipetted into a clean 96-well microplate. Additionally, 100 μl of cell lysate containing an equal amount of protein was placed into the 96 well microplate. Once all of the standards and samples were pipetted, 100 μl aliquots of luciferin–luciferase mixture from the ATP assay kit were dispensed into the wells. Luminescence was measured after 15 min at 37°C using a luminometer (Fluostar, BMG Labtechnologies, Durham, NC, USA). The mean value of the luminescence was calculated for each treatment and plotted.
Western blot analysis
Cell homogenates were prepared in a lysis buffer (0.5% triton-x-100, 50 mM NaCl, 10 mM Tris, 1 mM EDTA, 1 mM EGTA, 2 mM sodium vanadate, 0.2 mM PMSF, 1 mM HEPES, 1 μg/ml leupeptin, and 1 μg/ml aprotinin). The cytosolic extracts were cleared by centrifugation at 12,000 xg for 15 min at 4°C, and the protein concentration was estimated using a Bio-Rad 250 protein assay kit (Bio-Rad, Hercules, CA). Protein samples (40 μg) were resolved by electrophoresis on a 12% sodium dodecyl sulfate (SDS) polyacrylamide gel (120v, 1.5 hr) in a running gel buffer containing 25 mM Tris, pH 8.3, 162 mM glycine, and 0.1% SDS. The samples were transferred to nylon membrane for 1 hr and 20 min at 350 mA. The membranes were incubated overnight in a mixture of T-TBS with 0.1% tween in 2% milk and the respective antibodies caspase-3 (Santa Cruz biotechnology, Santa Cruz, CA) and cytochrome c and GAPDH (Cell Signaling Technology, Inc, Danvers, MA) in 1:1000 dilution. Subsequently, the membrane was incubated in the respective secondary antibody (1:10,000) for 1 hr at room temperature. Final visualization was carried out with the enhanced chemiluminescence kit (Bio-Rad, Hercules, CA). The protein bands were quantified by densitometry [44].
Apoptosis measurement
Apoptosis was quantified using the ethidium bromide and acridine orange assay [45]. Briefly, control and treated cells (106) were transferred to microcentrifuge tubes and pelleted for 10 min at 1,000 ×g. After centrifugation, the cell-rich pellets were resuspended in a mixture containing 2 μl of ethidium bromide (100 μg/ml) and 2 μl of acridine orange (100 μg/ml). Live, apoptotic, and necrotic cells were differentiated from each other using fluorescence microscopy on the basis of definitive nuclear and cytosolic fluorescence and distinct morphological changes, including membrane blebbing, nuclear and cytosolic condensation, and nuclear fragmentation.
Measurement of intracellular calcium concentrations ([Ca2+]in)
hCMEC/D3 cells were briefly plated on glass-bottom dishes and allowed to attach for 24 hr. The cells were exposed to different concentrations of AZT + IDV combination for 72 hr. The cells were washed with PBS and were incubated for 20 min to allow efficient loading of membrane permeable Fura-2 AM in a serum-free media. The entire medium was then removed and the cells were washed with PBS twice to eliminate extracellular Fura-2AM. Following this wash, serum-free medium was added to the cells, which were then allowed to reach homeostasis by incubation for the remaining 20 min at 37 °C. The cells were then placed on the stage of an inverted fluorescence microscope (InCyt Basic IM Fluorescence Imaging System, Intracellular Imaging Inc.). The cells were excited at 340 nm and 380 nm while emission was monitored at 510 nm at an acquisition rate of 10 Hz. The ratio of fluorescence measured after excitation at the two wavelengths (F340/F380) was proportional to the free calcium concentration. In each independent experiment, 25 cells were selected to measure the [Ca2+]in and averaged [46].
Trans-endothelial electric resistance (TEER) measurement
Trans-endothelial electric resistance (TEER) measurement by an EVOM voltohmmeter (World Precision Instrument, Sarasota, FL, USA) assessed the tightness of the hCMEC/D3 monolayer. hCMEC/D3 cells were seeded onto collagen-coated inserts with a pore size of 0.4 μm at densities of 15×103/well, and allowed to culture until a monolayer formed (4–7 days). The cell monolayer was then treated with AZT + IDV or a serum-free media for 72 hr. After this, the media was replaced with 150 μl of fresh medium. The insert containing the cell monolayer was then transferred in to a fresh plate containing 500 μl of serum-free medium. The TEER reading was recorded immediately. TEER values were calculated as: Resistance×0.33 Ωcm2 (insert surface area) and were expressed as a percentage of control. Thus, resistance is inversely proportional to the effective membrane [40].
Dextran permeability study
hCMEC/D3 cells were seeded onto collagen-coated inserts with a pore size of 0.4 μm at densities of 15 × 103/well, and allowed to culture until a monolayer formed. The cell monolayer was then treated with AZT or serum-free media for 72 hr. After this, the medium in the insert was replaced with 150 μl of FITC labeled dextran, and was transferred to a fresh plate well, containing 500 μl of serum-free medium. The plates were incubated for 30 min at room temperature, and 100 μl of the plate’s well solution were removed and transferred to a 96-well plate. Fluorescence was read with a 485 nm excitation and 530 nm emission, using a microplate reader (Fluostar, BMG Labtechnologies, Durham, NC, USA) [40].
Determination of protein
Protein levels of the cell samples were measured by the Bradford method [47]. Concentrated Coomassie Blue (Bio-Rad, Hercules, CA) was diluted 1:5 (v/v) with distilled water. 20 μl of the diluted cell homogenate were then added to 1.5 ml of this diluted dye, and absorbance was measured at 595 nm using a UV spectrophotometer (Shimadzu Scientific Instruments, Columbia, MD). Bovine serum albumin (BSA) was used as the protein standard.
Statistical analysis
Group comparisons were performed using the one-way analysis of variance (ANOVA) test and the TUKEYS post hoc test. Statistical analyses were made using GraphPad Prism 5.01 (GraphPad Software Inc., La Jolla, CA). Statistical significance was set at p < 0.05.
Results
Antiretroviral drugs decrease cell viability
To determine whether the HAART drug combination affects the viability of endothelial cells, we treated hCMEC/D3 cells with AZT + IDV. Effects of AZT + IDV on cell viability of hCMEC/D3 were determined by using the calcein AM assay. Cells were treated with drug combinations ranging from 5 μM to 200 μM, used in previously reported studies with immortalized endothelial cells [48]. Treatment with drugs for 24 hr did not show a significant trend by ANOVA, except for the 50 μM, 100 μM, and 200 μM treated groups (p<0.05). However, analysis of individual differences with Tukey’s post test showed that only the highest concentration (200μM) was different from that of the 50μM and 100 μM treated groups (p<0.05), and produced a moderate decrease in cell viability (~ 21% decrease) (Fig.1A). Treatment with AZT + IDV induced a more prominent decrease in viability after 72 hr (Fig.1B), in a dose-dependent manner. 50 μM, 100 μM, and 200 μM concentrations of AZT + IDV caused an increase in cell death (approximately 21%, 43%, and 65%, respectively, at p<0.05), and, hence, these concentrations of AZT + IDV were used for further studies. Cells treated with 100 μM of AZT or IDV alone showed that AZT was more toxic than IDV in these cells (p<0.05). IDV and AZT alone treated cells showed a decrease in viability of 23% and 34%, respectively, whereas cells treated with an AZT + IDV combination showed only a 43% decrease in viability (Fig. 1C).
Fig. 1.
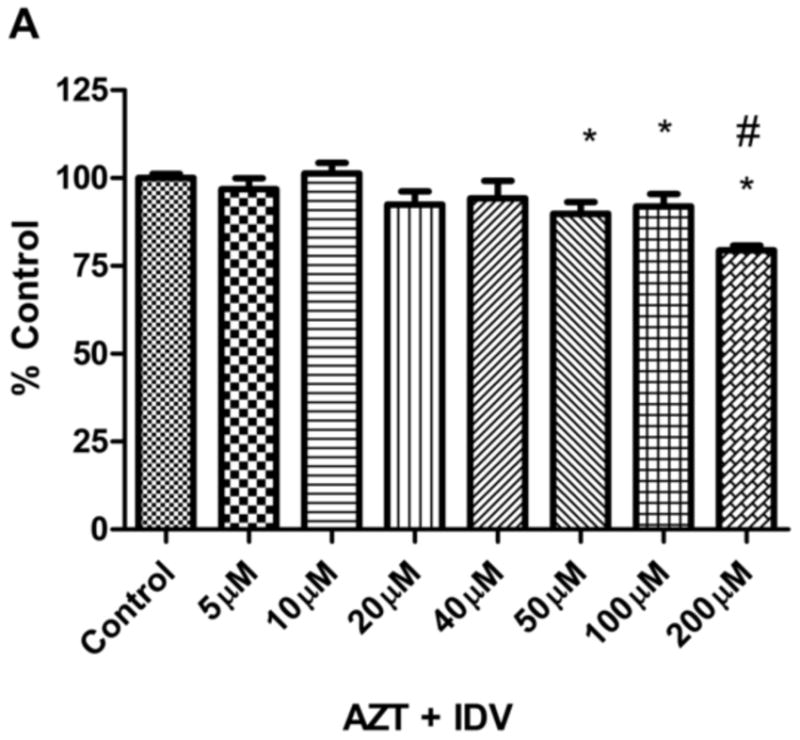

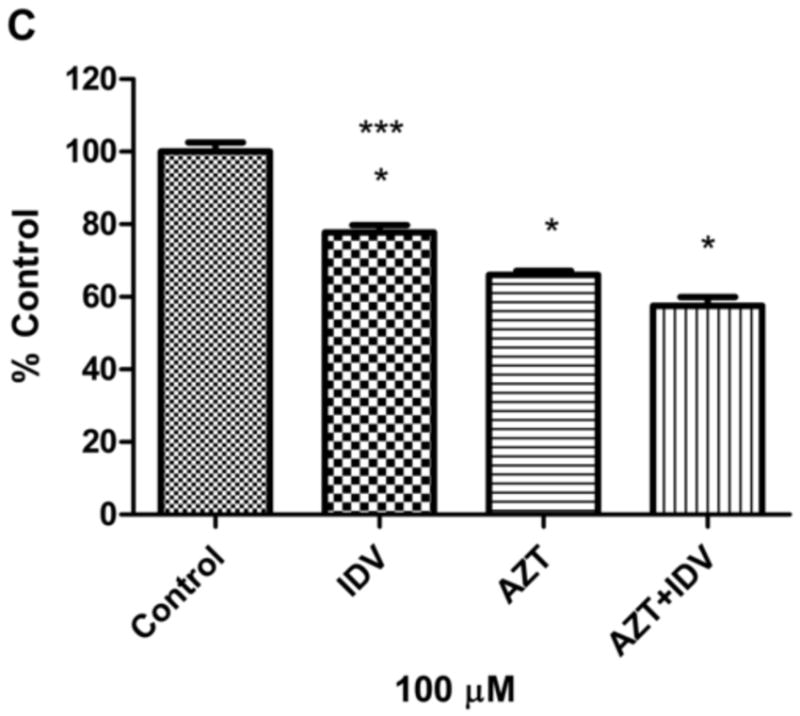
Effects of (A) AZT + IDV treatment for 24 hr (5 μM-200 μM) (B) AZT + IDV treatment for 72 hr (5 μM-200 μM) and (C) AZT or IDV alone and in combination treatment (100 μM) for 72 hr on hCMEC/D3 cell death as indicated by uptake of calcein. Results are expressed as mean percent of controls (±SEM; n=5). * Statistical differences (p<0.05) as compared to untreated control. # Statistical difference (p<0.05) compared to 50 μM and 100 μM group. *** Statistical difference (p<0.05) compared to AZT treated group.
Effects of HAART on reactive oxygen species (ROS) production
To examine the role of oxidative stress in endothelial cell death, we measured the levels of ROS in endothelial cells treated with drugs using the DCFH2-DA fluorescent assay. ROS are a highly transient species and in order to measure them, an intermediate time point of 48 hr was selected. Endothelial cells were incubated with AZT + IDV for 48 hr followed by washing to remove the drugs. Re-incubation of hCMEC/D3 cells in the presence of the dye DCFH2-DA for 0.5 hr resulted in an increase in fluorescence compared to control. Treatment with AZT + IDV induced a 1.5 to 2 fold increase in ROS production after the 48-hr treatment (Fig. 2). Although the ROS levels were different than those of the control (p<0.05), no significant difference was observed between those of treated groups.
Fig. 2.
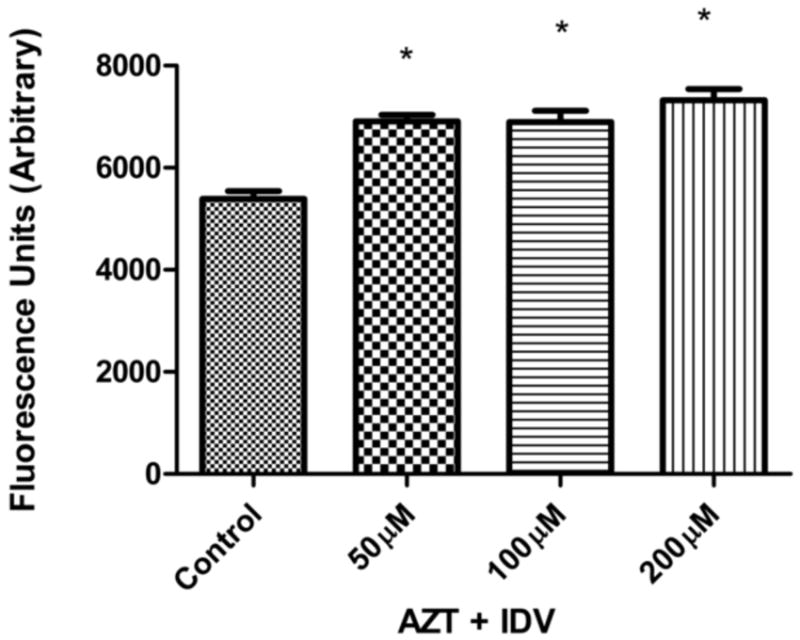
Reactive oxygen species (ROS) production induced in hCMEC/D3 treated with 50 μM, 100 μM and 200 μM, AZT +IDV for 48 hr. Cellular ROS levels were assessed using DCFH2-DA. Results expressed as mean values (±SEM; n=5). * Statistical differences (p<0.05) as compared to untreated control.
Effects of HAART drugs on GSH levels
Oxidative stress or high levels ROS generation leads to the decline in cellular antioxidants like GSH. The levels of GSH were measured after treatment with AZT+IDV to further assess the role of oxidative stress in cytotoxicity. The levels of glutathione in all treated groups were significantly lower than that of the control (Fig. 3). In the AZT + IDV treated groups, dose-dependent decreases in the GSH levels were observed. Cells treated with 200 μM AZT+IDV had a 65% decrease in GSH levels, as compared to controls, whereas those treated with 100 μM and 50 μM doses experienced decreases of 50 % and 40% with respect to that of the control (p<0.05).
Fig. 3.
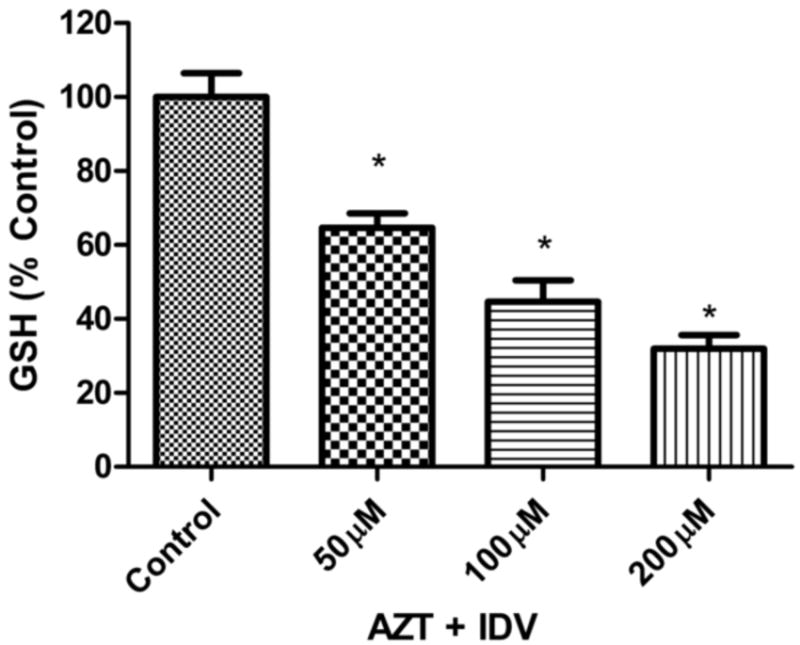
AZT + IDV (50 μM, 100 μM, and 200 μM) exposure lead to intracellular glutathione (GSH) decrease in dose -dependent manner. hCMEC/D3 were treated for 72 hr and GSH levels were measured using HPLC method described in Materials and Methods section. GSH levels were calculated per mg of protein and results expressed as mean percent of controls (±SEM; n=4). * Statistical differences (p<0.05) as compared to untreated control.
HAART effects on lipid peroxidation
An increase in ROS and a decrease in GSH led to high levels of reactions between free radicals and membrane lipids, causing lipid peroxidation in the cells. This was estimated by measuring the levels of malondialdehyde (MDA), a stable by-product of lipid peroxidation. MDA levels were significantly increased in all treated groups, as compared to control. MDA levels in the group treated with 50 μM (Fig. 4) were arithmetically higher, but this did not reach statistical significance. A 1.5- to 3-fold increases in MDA levels were observed in the cells treated with 100 μM and 200 μM doses of AZT+IDV, as compared to the controls (p <0.05).
Fig. 4.

Lipid peroxidation in hCMEC/D3 cells. AZT + IDV (50 μM, 100 μM, 200 μM) treatment for 72 hr caused oxidative stress resulting in an increase in malondialdehyde (MDA) levels, a lipid peroxidation metabolite. MDA levels were measured using HPLC method described in Materials and Methods section. MDA levels were calculated per mg of protein and results expressed as mean percent of controls (±SEM; n=4).). * Statistical differences (p<0.05) as compared to untreated control.
HAART drugs disrupt mitochondrial function
One important intracellular target of drugs is mitochondria, which is also a source of ROS inside cells. Any disruption in mitochondrial permeability and function can be assessed by measuring the changes in mitochondrial membrane potential (ΔΨm). The decrease in ΔΨm was demonstrated by using membrane permeable potentiometric dye, JC-1. Cells with mitochondrial dysfunction showed primarily green fluorescence, whereas healthy cells were differentiated with red and green fluorescence. As shown in Fig. 5, control cells stained both red and green, whereas a dose-dependent decrease in red fluorescence was seen in treated groups. Although the 200 μM treated group shows specks of red fluorescence, these images do not merge into the cytoplasmic area of cells (green fluorescence), as seen in previous groups, and appear to be floating dye aggregates. Decreases in the red fluorescence across treated groups indicated that AZT + IDV treatment suppressed ΔΨm in the BBB cells. These results support our hypothesis that AZT + IDV treatment depolarizes the mitochondria membrane potential, disrupting the mitochondrial function, and resulting in cell death. ATP levels were measured as another test for mitochondrial function. Treatment with AZT + IDV after 72 hr resulted in a dose-dependent decrease in ATP levels (Fig. 6). Compared to control, the ATP levels decreased 20-50 % in treated groups (p<0.05). These results also add to the evidence that HAART drugs affect mitochondrial function.
Fig. 5.
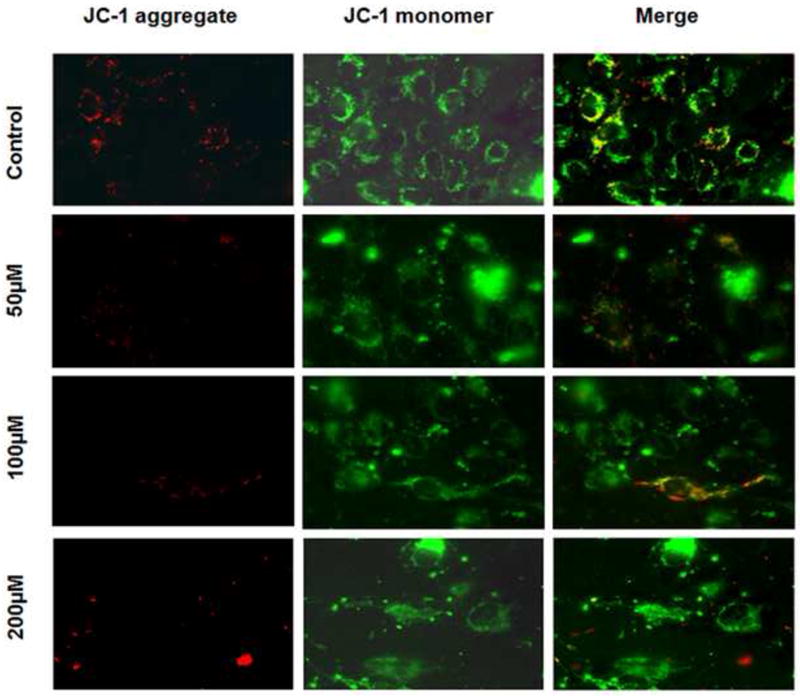
Analysis of mitochondrial membrane potential. ΔΨm was analyzed in adherent hCMEC/D3 after 72 hr of AZT+IDV treatment, using the potential-dependent aggregate-forming lipophilic cation JC-1 (5,5’,6,6’-tetrachloro-1,1’,3,3’-tetraethylbenzimidazole carbocyanide iodide). Left image represents JC-1 dye aggregation in mitochondria with intact membrane potential. Mitochondria exhibit red fluorescence if ΔΨm is preserved. Middle image represents JC-1 monomers exhibiting green fluorescence in cytoplasm of cells. Mitochondria in treated cells showed a dose-dependent decrease in red fluorescence due to loss of ΔΨm. Merged images are represented on extreme right.
Fig. 6.

ATP levels were measured with the bioluminescence assay (Promega) in AZT + IDV (50 μM, 100 μM, 200 μM) treated cells. Exposure to drugs showed a dose-dependent decrease in ATP levels. Results expressed as average values of luminescence (±SEM; n=4). * Statistical differences (p<0.05) as compared to untreated control.
Effect of HAART on apoptotic cell death
The disruption of mitochondrial membrane function is known to result in the release of the mitochondrial enzyme cytochrome c into the cytosol. The levels of cytochrome c release were measured to determine if changes in mitochondrial membrane potential correlate with the initiation of apoptosis. Fig. 7A shows levels of cytochrome c released from mitochondria into the cytoplasm. There was an increase (~1.5-2.0 fold) in cytochrome c release in 50 μM and 100 μM (p<0.05). Cytochrome c levels in 200 μM treated group were arithmetically higher, but were not significant when compared to that of the control. As additional evidence of apoptosis occurring after the treatment of endothelial cells treated with AZT + IDV, we measured the levels of procaspase-3 protein, as shown in Fig. 7B. Although there was a remarkable increase in the expression of procaspase-3 in all treatments, there was an even higher increase in the 50 μM - treated cells, as compared to other treated groups.
Fig. 7.
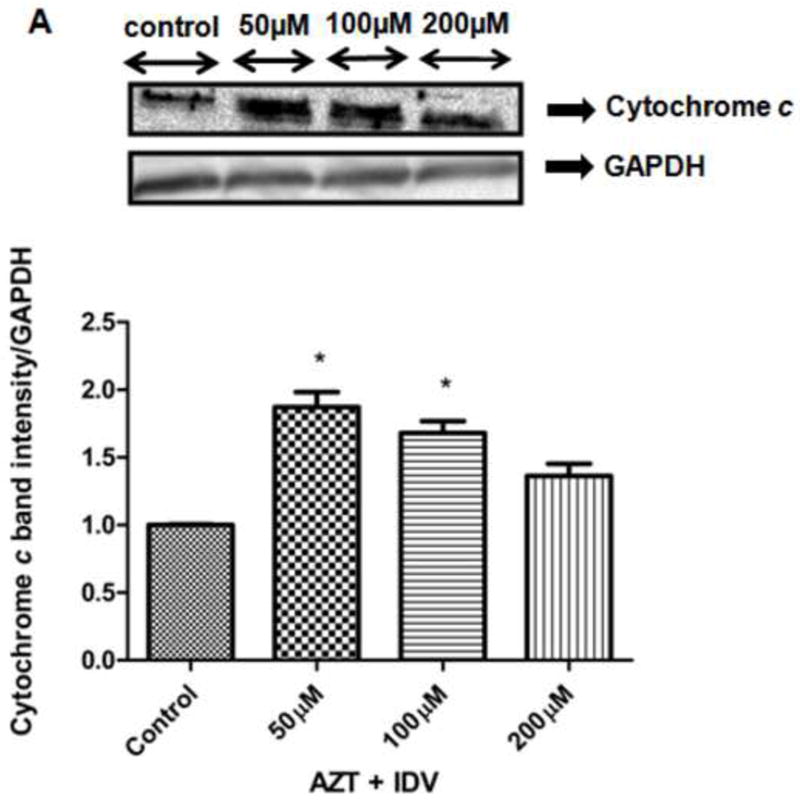
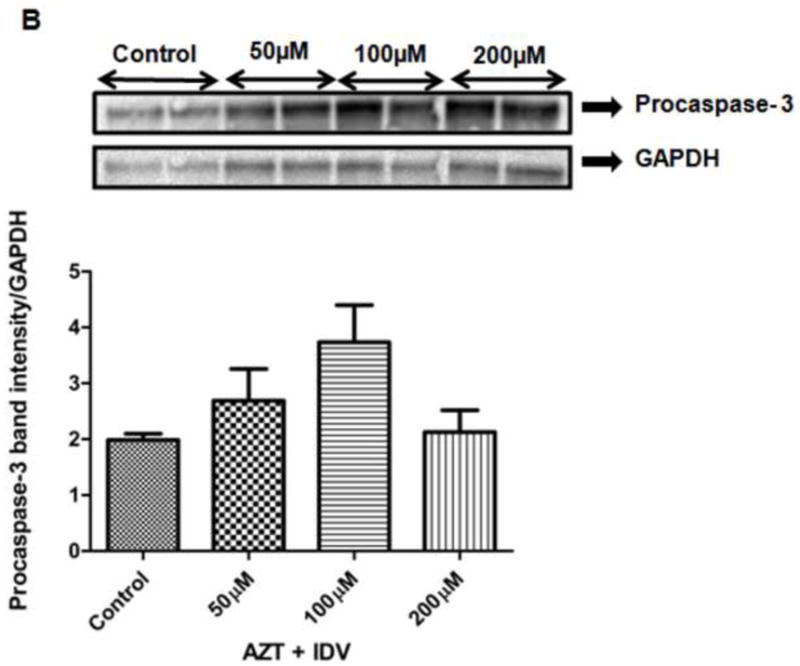
The expression of apoptosis-related proteins, (A) Cytochrome c (B) Procaspase-3 in both hCMEC/D3cells treated with AZT + IDV for 72 hr. Equal amounts of cellular protein were fractionated on 12% SDS-PAGE gels and transferred to nitrocellulose membranes as described in Materials and Methods. GAPDH was used as an internal control.
Apoptosis detection by acridine orange and ethidium bromide (AO/EB) staining
To corroborate that apoptosis had been induced by AZT+IDV, hCMEC/D3 cells were analyzed in the presence of acridine orange and ethidium bromide staining (AO/EB staining). Acridine orange is a vital dye that will stain both live and dead cells, whereas ethidium bromide will stain only those cells that have lost their membrane integrity. As a control, cells were cultured in a complete media and stained with AO/EB (Fig. 8A). Cells stained green represented viable cells, whereas yellow staining represented early apoptotic cells, and reddish or orange staining indicated late apoptotic cells. As shown in Fig. 8B, 50 μM treated hCMEC/D3 cells showed changes in cellular morphology, including chromatin condensation, membrane blebbing, and fragmented nuclei. Figs. 8C and 8D showed similar features for 50 μM treated cells (Fig. 8B), but had extra features of late stage apoptotic bodies when hCMEC/D3 cells were treated with 100 μM and 200 μM of the AZT + IDV treated group.
Fig. 8.

hCMEC/D3 cells were treated with AZT + IDV for 72 hr and were stained with AO/EB mixture. (A) Control and viable cells appearing only green due to acridine orange staining. (B) 50 μM treated hCMEC/D3 cells showing changes in cellular morphology for early apoptosis and appearing orange with ethidium staining. Dashed arrow indicates cells with chromatin condensation; rounded dotted arrow indicates cells with fragmented nuclei; dashed dotted arrow indicates cells with membrane blebbing. (C) 100 μM treated group showing morphological similar to 50 μM treated group with some late apoptotic features. Full white arrow indicates the presence of apoptotic bodies. (D) 200 μM treated group with cells showing chromatin condensation and late apoptotic features like apoptotic bodies. Necrotic cells appearing red with ethidium staining. Each experiment was performed in triplicate (n = 3) and generated similar morphological features.
Intracellular calcium [Ca2+]in mediates apoptosis
It is now known that intrinsic pathways in apoptosis involve the exchange of Ca2+ signals between the ER and the mitochondria that coordinate the precommitment phase of apoptosis. It has also been shown that oxidative stress increases the intracellular calcium concentration leading to activation of endonucleases, which degrade DNA and, ultimately, contribute to cell death. In order to explore the role of calcium in apoptosis by AZT + IDV, we assessed the levels of [Ca2+]in using fluorescent microscopy. We detected a 1.5-2.5 fold increase (p<0.05) in calcium levels in the 100 μM and 200 μM treated groups, when compared to levels in the control (Fig. 1S; Supplementary Material). Although the 50 μM treated group showed an increase in [Ca2+]in levels, these were not statistically different than those of the control, but 100 μM and 200 μM treated groups were different from 50 μM treated group (p<0.05). These results imply that [Ca2+]in mediates the mitochondrial permeability transition, thereby releasing intra-mitochondrial contents like cytochrome c during apoptosis.
Effects of HAART on the BBB integrity
Regulation of the flow of substances through intercellular spaces depends on the integrity of the BBB. Permeability studies, such as dextran cell permeability assay and TEER assays were used in this study to assess the integrity of a monolayer of endothelial cells as they simulate the integrity of the BBB. The resistance measured across the monolayer of cells showed a decrease in resistance of approximately 10-30% across the treated groups (Fig. 2SA). To further support these findings, we also measured the amount of FITC labeled dextran that leaked across the monolayer using fluorometry after treatment. In agreement with the data for TEER, there was a 10-60% increase in the permeability of the layer, as seen by the increase in fluorescence across the treated groups. In both of these studies, 100 μM and 200 μM treated groups were different from the control (p<0.05). Although 50 μM treated group was not significant when compared to control, they were arithmetically higher than control. Tukey post hoc analysis showed that the 100 μM and 200 μM treated groups was different from the 50 μM treated group (p<0.05). This indicated that intercellular junctions between the endothelial cells were compromised with HAART treatment (Fig. 2SB).
Effect of NACA on ROS levels
Our studies with AZT+IDV showed a dose dependent increase in ROS levels in endothelial cells. In order to test the effect of NACA on ROS production in AZT+IDV treated groups, cells were preincubated with 2 mM NACA for 1 hr. Fig. 3S shows the scavenging effect of NACA on free radicals in treated cells. NACA pretreated hCMEC/D3 cells had significantly lower levels of ROS when compared to that of the treated group (p<0.05) and it appeared to be almost equal to that of the control. These results suggest that the NACA may protect BBB from oxidative stress in AZT+IDV treated patients.
NACA effect on GSH levels
Depletion of cellular antioxidants like GSH is commonly observed in oxidatively challenged conditions. Thiol antioxidants are known to replenish cells with GSH levels in these situations, so we tested the ability of NACA to increase GSH levels in AZT+IDV treated. Fig.4S shows the effect of NACA on GSH levels in drug treated groups. GSH levels in endothelial cells in the NACA pretreated group had significantly high levels of GSH (approximately ~70% of the control) when compared to that of the AZT+IDV treated groups (p<0.05). These results suggest that NACA can prevent oxidative stress in cells by being uses as substitute to GSH for scavenging free radicals or indirectly by increasing the GSH levels.
Discussion
The advent of HAART therapy has significantly revolutionized the treatment of AIDS by increasing the lifespan of HIV-infected individuals, and creating a decline in AIDS-related neurological disorders [1-3]. Although HAART treatment has reduced the prevalence of opportunistic infections like cytomegalovirus and toxoplasmosis, the clinical impact of HAART toxicity on HIV-1-associated neurocognitive disorders is still controversial [8,9]. Most of the clinical studies report that cognitive impairment is still a significant clinical problem in HAART-treated patients [10,24]. Although several in vitro studies have shown that HIV proteins and methamphetamine can cause dysfunction in the BBB, the effect of HAART drugs on the BBB endothelial cells and its role in exacerbating HAND are not yet known. In this study, we have used the combination of AZT and IDV, one of the most commonly recommended HAART regimens, to elucidate their role in free radical generation and mitochondrial dysfunction mediated endothelial cell death.
Here, we present evidence that HAART drugs are toxic to BBB endothelial cells in a dose-dependent manner (Fig. 1). We suggest that the high AZT and IDV concentrations found to be active in our studies can be considered relevant. AZT + IDV combination is used for the treatment of HIV-infected AIDS patients at doses of about 500–1500 mg daily for a long survival period [49,50]. The concentrations used may be higher than the drug concentrations achieved in clinical studies, but the use of immortalized cell line as well as decrease in cell viability at lower concentrations like 40 μM at 72 hr time point indicate that exposure of cells to lower concentrations similar to that of physiologically relevant concentrations for longer intervals may result in the similar outcomes as seen with our study. Moreover Sussman et al. [51], have shown that even though the cells are exposed to higher concentrations (300 μM) of AZT, similar numbers of zidovudine molecules are incorporated into DNA in animal exposed to plasma concentration found in adult HIV patients indicating that exposure to higher concentration may result in similar effects observed with plasma levels. Endothelial cells exposed to individual drugs showed that AZT was more toxic than IDV. AZT, a nucleoside reverse transcriptase inhibitor, has been shown to decrease the levels of mitochondrial DNA in vivo and clinically [52,53] by inhibiting γ-DNA polymerase. The decrease in mtDNA inhibits the synthesis of adequate proteins for oxidative phosphorylation (OXPHOS). A subsequent energy loss and increase in production of reactive oxygen species (ROS) has been reported in other studies involving HAART treatment [54,55]. Our data is in agreement with those studies, as a significant, concentration-dependent increase in total ROS was also observed in our study, indicating an increase in the oxidative stress in response to the treatment (Fig. 2).
One of the important effects of oxidative stress and free radical generation is decreased levels of cellular antioxidants. GSH (γ-glutamyl-cysteinyl-glycine), a thiol antioxidant in cells, is mainly responsible for maintaining cellular redox status in endothelial cells. GSH scavenges free radicals and hydrogen peroxide, and neutralizes toxic metabolites by condensing with them both enzymatically and nonenzymatically [56]. Long-term AZT treatment has been shown to induce oxidative damage and deplete GSH in rats treated acutely and in cell cultures [57,47]. We observed a dose-dependent decrease in GSH levels after HAART treatment suggesting that AZT + IDV induced ROS production with subsequent decreases in GSH levels (Fig. 3). AZT + IDV may have caused an increase in levels of hydroperoxides that exceeded the metabolic capabilities of the glutathione system to maintain glutathione in the reduced form. In fact, mitochondria are highly dependent on glutathione to detoxify ROS and prevent oxidative damage [58].
A decrease in GSH and an increase in ROS tend to set off a cascade of further oxidative damage. BBB is an important target of oxidative because they are rich in polyunsaturated fatty acids (PUFAs). ROS attacks double bonds in PUFAs, thereby degrading the lipids and generating MDA as by product. MDA is a widely used oxidative stress parameter, reacting with deoxyadenosine and deoxyguanosine to form mutagenic DNA adducts [59,60]. Studies have shown that AZT treated mice have higher levels of plasma MDA, as compared to control mice [61]. Our results also indicated that AZT + IDV treatment increased the levels of lipid peroxidation metabolites because of oxidative damage (Fig. 4).
Mitochondria are logical targets for oxidative stress, based on their ability to generate free radicals, and may be primarily involved in oxidative stress associated with AIDS treatment. Under physiological conditions, reactive oxygen species are produced mainly by the mitochondria during OXPHOS, as electrons travel through the electron transport chain (ETC). During OXPHOS, electrons leak out of the ETC and result in the formation of superoxide instead of water. Superoxide is generated at complex I (NADH dehydrognase) and complex III (ubiquinone Q-cytochrome b). Any alteration in redox status of these complexes results in an excessive production of superoxide radical [62]. Mitochondrial hydrogen peroxide is also rapidly formed from superoxide by dismutation or by mitochondrial manganese superoxide dismutase. Hydroxyl radicals are known to form at sites where superoxide and hydrogen peroxide are formed in mitochondria [63]. The free radicals generated can act on mitochondrial proteins, lipids, and even mtDNA, thereby altering the electrochemical gradient across the mitochondria resulting in mitochondrial dysfunction [64,65]. An electrochemical gradient across mitochondrial inner membrane or mitochondrial membrane potential (ΔΨm) is important for mitochondrial electron transport and energy metabolism. A decrease in ΔΨm after treatment was detected and assessed in our studies by using fluorescent microscopy. In addition to this, we also observed a dose-dependent decrease in ATP levels after treatment. Loss of ΔΨm interferes with the production of ATP, the cell’s main source of energy, because mitochondria must have an electrochemical gradient to provide the driving force for ATP production. Decreases in ΔΨm and ATP levels seen in our study are consistent with disrupted mitochondrial function (Fig. 5&6).
Reactive oxygen and nitrogen species, decreased mitochondrial membrane potential, and oxidation of pyridine nucleotides and glutathione all promote mitochondrial damage and the onset of a phenomenon, mitochondrial permeability transition (MPT). MPT is a sudden increase in the permeability of the inner mitochondrial membrane, loss of ΔΨm, uncoupling of oxidative phosphorylation, mitochondrial swelling, and the release of intramitochondrial ions through the mitochondrial membrane transition pore (MPTP) [66]. Mitochondrial permeability transition (MPT), is recognized as an initiating phenomenon, important for both necrosis and apoptosis [67]. Swelling of the mitochondria due to increased permeability ruptures the outer membrane of the mitochondria releasing the cytochrome c into the cytoplasm. Cytochrome c can in turn cause apoptosis of cells by activating pro-apoptotic factors [68]. Endothelial cell apoptosis has been demonstrated in an atherosclerotic lesion and has been considered a mechanism for artherogensis in HAART-treated patients [69]. AZT treatment has induced apoptosis in placental cells and parathyroid cancer cells [70,49]. Contrary to these studies, AZT + IDV did not induce apoptosis at therapeutic concentrations in primary human umbilical cells and various other studies [71,50]. In addition to this, an emerging body of literature suggests that protease inhibitors may also be anti-apoptotic by inhibiting calpain [72]. In view of this confounding research, we tested whether AZT + IDV can induce apoptosis in hCMEC/D3 cells. Cytchrome c and procaspase 3 levels were elevated in cytosolic fractions of the treated groups when compared to those of the control groups. To further ascertain that AZT + IDV treatment induced apoptosis, cells were stained with an AO/EB mixture and observed under a fluorescent microscope. Treated cells showed changes in cellular morphology, including chromatin condensation, membrane blebbing, and fragmented nuclei and apoptotic bodies. Results from both studies provided sufficient support that AZT + IDV treated hCMEC/D3 cells were undergoing programmed cell death.
Apoptosis can be triggered by many different stimuli, including engagement of death receptors by cytokines (such as TNF-alpha and Fas ligand), toxins, and oxidative stress. Early events in apoptosis include the release of cytochrome c (from mitochondria) and calcium from endoplasmic reticulum in to the cytosol, which are necessary for apoptosis. A small amount of cytochrome c released from mitochondria can bind to and promote calcium conductance through Inositol-1,4,5–triphosphate (InsP3) receptors in the endoplasmic reticulum membrane. The released calcium then triggers a massive exodus of cytochrome c from all mitochondria in the cell, thereby activating the caspases and nuclease enzymes that finalize the apoptotic process [73]. Evidently, calcium uptake into the mitochondria is secondary to an increase in the cytoplasmic calcium concentration as a stimulus for the massive release of cytochrome c. Results from our studies show that mitochondrial dysfunction is followed by extensive release of intracellular calcium and cytochrome c. This might have caused the execution of cell death when exposed to a combination of AZT + IDV in blood-brain vascular endothelial cells.
A noticeable decrease in trans-endothelial electrical resistance (TEER) and an increase in dextran permeability provide evidence that HAART drugs can alter the permeability across the monolayer of endothelial cell layer. This is in agreement with results reported from previous studies [50]. Inflammatory mediators (histamine and thrombin) tend to increase centripetal tension and intercellular and matrix adhesion in the absence of a rise in cyclic adenine monophosphate. Thrombin triggers multiple signal pathways through activation of G proteins which can, in turn, activate phospholipase C. Activation leads to a series of signaling cascades ultimately leading to protein kinase C activation. These signals lead to activation of multiple protein kinases and phosphorlyation of their target proteins, filamin, myosin light chain kinase (MLCK), and tight junction (TJ) proteins [74,75]. Phosphorylation of these target proteins induces interendothelial gaps and monocyte migration across the BBB models [76]. The data obtained from our functional endpoint study does not provide any evidence to support the above mechanism but concurs with a previous study on endothelial cells, which showed that HAART drugs can induce gaps between endothelial cells.
In order to further support the fact that HAART drugs induced oxidative stress in hCMEC/D3 cells, the thiol antioxidant, NACA, was used to inhibit the effects of the drugs. The ROS levels in NACA pretreated cells were similar to control. NACA is thought to increase GSH levels in cells, both by providing the important GSH precursor cysteine, and by reducing GSSG back to GSH by thiol disulfide exchange [77]. According to Fig. 4S NACA appears, to replenish GSH levels, which may be useful in reversing some of deleterious effect of oxidative insults.
In summary, our results demonstrate that the HAART drug combination of AZT + IDV can induce cytotoxicity in blood-brain endothelial cells. Cell death may be due to increased oxidative stress and lipid peroxidation. Our results also suggest that treatment with AZT + IDV leads to depolarization of membrane potential and energy loss, ultimately causing mitochondrial dysfunction. Furthermore, treated cells were undergoing apoptosis and elevated intracellular calcium mediated the drug-induced apoptosis in our current study. Thus, treatment with the AZT+IDV drug combination may affect the BBB, and inclusion of antioxidants in HAART therapy may protect HIV infected patients, particularly with neurocognitive disorders, against drug-induced oxidative stress.
Supplementary Material
Acknowledgments
Dr.Ercal is supported by R15DA023409-01A2 from NIDA, NIH. The contents of this paper are solely the responsibility of the authors and do not represent official views of the NIDA or NIH. Dr. Banks is supported by VA Merit Review and R01 AG029839. hCMEC/D3 cell line was a kind gift from Dr. Pierre-Olivier Cauraud (Institut Cochin, Paris, France). The authors appreciate the efforts of Barbara Harris in editing the manuscript.
List of abbreviations
- AZT
3’-Azido-2’, 3’-deoxythymidine
- BBB
Blood- brain barrier
- IDV
Indinavir
- HIV-1
Human immunodeficiency virus
- HAND
HIV-1- associated neurocognitive disorders
- HAART
Highly active antiretroviral therapy
- HIV-1
Human immunodeficiency virus
- gp120
HIV-1 envelope glycoprotein (gp120)
- Tat
Transregulatory protein
- TJ
Tight junctions
- GSH
Glutathione
- MDA
Malondialdehyde
- ROS
Reactive oxygen species
Footnotes
Publisher's Disclaimer: This is a PDF file of an unedited manuscript that has been accepted for publication. As a service to our customers we are providing this early version of the manuscript. The manuscript will undergo copyediting, typesetting, and review of the resulting proof before it is published in its final citable form. Please note that during the production process errors may be discovered which could affect the content, and all legal disclaimers that apply to the journal pertain.
References
- 1.Bell JE. The neuropathology of adult HIV infection. Rev Neurol. 1998;154:816–829. [PubMed] [Google Scholar]
- 2.Nath A. Human immunodeficiency virus (HIV) proteins in neuropathogenesis of HIV dementia. J Infect Dis. 2002;186:S193. doi: 10.1086/344528. [DOI] [PubMed] [Google Scholar]
- 3.Navia BA, Cho ES, Petito CK, Price RW. The AIDS dementia complex: II. Neuropathology. Ann Neurol. 1983;19:525–535. doi: 10.1002/ana.410190603. [DOI] [PubMed] [Google Scholar]
- 4.Krebs FC, Ross H, McAllister J, Wigdahl B. HIV-1-associated central nervous system dysfunction. Adv Pharmacol. 2000;49:315. doi: 10.1016/s1054-3589(00)49031-9. [DOI] [PubMed] [Google Scholar]
- 5.Kolson DL. Neuropathogenesis of central nervous system HIV-1 infection. Clin Lab Med. 2002;22:703. doi: 10.1016/s0272-2712(02)00009-4. [DOI] [PubMed] [Google Scholar]
- 6.Anthony IC, Ramage SN, Carnie FW, Simmonds P, Bell JE. Influence of HAART on HIV-related CNS disease and neuroinflammation. J Neuropathol Exp Neurol. 2005;64:529–536. doi: 10.1093/jnen/64.6.529. [DOI] [PubMed] [Google Scholar]
- 7.Dore GJ, Correll PK, Li Y, Kaldor JM, Cooper DA, Brew BJ. Changes to AIDS dementia complex in the era of highly active antiretroviral therapy. AIDS. 1999;13:1249–1253. doi: 10.1097/00002030-199907090-00015. [DOI] [PubMed] [Google Scholar]
- 8.Dore GJ, McDonald A, Li Y, Kaldor JM, Brew BJ. Marked improvement in survival following AIDS dementia complex in the era of highly active antiretroviral therapy. AIDS. 2003;17:1539–1545. doi: 10.1097/00002030-200307040-00015. [DOI] [PubMed] [Google Scholar]
- 9.Sacktor N, McDermott MP, Marder K, Schifitto G, Selnes OA, McArthur JC, Stern Y, Albert S, Palumbo D, Kieburtz K, De Marcaida JA, Cohen B, Epstein L. HIV-associated cognitive impairment before and after the advent of combination therapy. J Neurovirol. 2002;8:136–142. doi: 10.1080/13550280290049615. [DOI] [PubMed] [Google Scholar]
- 10.Raines C, Radcliffe O, Treisman GJ. Neurologic and psychiatric complications of anti-retroviral agents. J Assoc Nurses AIDS Care. 2005;16:35–48. doi: 10.1016/j.jana.2005.07.004. [DOI] [PubMed] [Google Scholar]
- 11.Hawkins BT, Davis TP. The blood-brain barrier/neurovascular unit in health and disease. Pharmacol Rev. 2005;57:173–185. doi: 10.1124/pr.57.2.4. [DOI] [PubMed] [Google Scholar]
- 12.Banks WA, Freed EO, Wolf KM, Robinson SM. Transport of human immune deficiency virus type 1 pseudoviruses across the blood–brain barrier: role of envelope proteins and adsorptive endocytosis. J Virol. 2001;75:4681–4691. doi: 10.1128/JVI.75.10.4681-4691.2001. [DOI] [PMC free article] [PubMed] [Google Scholar]
- 13.Hoane MR, Kaplan SA, Ellis AL. The effects of nicotinamide on apoptosis and blood-brain barrier breakdown following traumatic brain injury. Brain Res. 2006;1125:185–193. doi: 10.1016/j.brainres.2006.10.019. [DOI] [PubMed] [Google Scholar]
- 14.Xiang S, Pan W. Strategies to create a regenerating environment for the injured spinal cord. Current Pharmaceutical Design. 2005;11:1267–1277. doi: 10.2174/1381612053507431. [DOI] [PubMed] [Google Scholar]
- 15.Minagar A, Alexander JS. Blood-brain barrier disruption in multiple sclerosis. Mult Scler. 2003;9:540–549. doi: 10.1191/1352458503ms965oa. [DOI] [PubMed] [Google Scholar]
- 16.Petito CK, Cash KS. Blood-brain barrier abnormalities in the acquired immune deficiency syndrome: immunohistochemical localization of serum proteins in postmortem brain. Ann Neurol. 1992;32:658–666. doi: 10.1002/ana.410320509. [DOI] [PubMed] [Google Scholar]
- 17.Zipser BD, Johanson CE, Gonzalez L, Berzin TM, Tavares R, Hulette CM, Vitek MP, Hovanesian V, Stopa EG. Microvascular injury and blood-brain barrier leakage in Alzheimer’s disease. Neurobiol Aging. 2007;28:977–986. doi: 10.1016/j.neurobiolaging.2006.05.016. [DOI] [PubMed] [Google Scholar]
- 18.Banks WA. Is obesity a disease of the blood-brain barrier? Physiological, pathological, and evolutionary considerations. Current Pharmaceutical Design. 2003;9:801–809. doi: 10.2174/1381612033455350. [DOI] [PubMed] [Google Scholar]
- 19.Begley DJ, Pontikis CC. Lysosomal storage diseases and the blood-brain barrier. Current Pharmaceutical Design. 2008;14:1566–1580. doi: 10.2174/138161208784705504. [DOI] [PubMed] [Google Scholar]
- 20.Horani MH, Mooradian AD. The effect of diabetes on the blood brain barrier. Current Pharmaceutical Design. 2003;9:833–840. doi: 10.2174/1381612033455314. [DOI] [PubMed] [Google Scholar]
- 21.Huber JD. Diabetes, cognitive function, and the blood-brain barrier. Current Pharmaceutical Design. 2008;14:1594–1600. doi: 10.2174/138161208784705441. [DOI] [PubMed] [Google Scholar]
- 22.Kortekaas R, Leenders KL, Van oostrom JC, Vaalburg W, Bart J, Willemsen AT, Hendrikse NH. Blood-brain barrier dysfunction in parkinsonian midbrain in vivo. Ann Neurol. 2005;57:176–179. doi: 10.1002/ana.20369. [DOI] [PubMed] [Google Scholar]
- 23.Power C, Kong PA, Crawford TO, Wesselingh S, Glass JD, McArthur JC, Trapp BD. Cerebral white matter changes in acquired immunodeficiency syndrome dementia: alteration of the blood–brain barrier. Ann Neurol. 1993;34:339–350. doi: 10.1002/ana.410340307. [DOI] [PubMed] [Google Scholar]
- 24.Price TO, Uras F, Banks WA, Ercal N. A novel antioxidant N-acetylcysteine amide prevents gp120- and Tat-induced oxidative stress in brain endothelial cells. Exp Neurol. 2006;201:193–202. doi: 10.1016/j.expneurol.2006.03.030. [DOI] [PubMed] [Google Scholar]
- 25.Banerjee A, Zhang X, Manda KR, Banks WA, Ercal N. HIV proteins (gp120 and Tat) and methamphetamine in oxidative stress-induced damage in the brain: potential role of the thiol antioxidant N-acetylcysteine amide. Free Radic Biol Med. 2010;48:1388–98. doi: 10.1016/j.freeradbiomed.2010.02.023. [DOI] [PMC free article] [PubMed] [Google Scholar]
- 26.Ramirez SH, Potula R, Fan S, Eidem T, Papugani A, Reichenbach N, Dykstra H, Weksler BB, Romero IA, Couraud PO, Persidsky Y. Methamphetamine disrupts blood-brain barrier function by induction of oxidative stress in brain endothelial cells. J Cereb Blood Flow Metab. 2009;12:1933–45. doi: 10.1038/jcbfm.2009.112. [DOI] [PMC free article] [PubMed] [Google Scholar]
- 27.Haorah J, Knipe B, Leibhart J, Ghorpade A, Persidsky Y. Alcohol-induced oxidative stress in brain endothelial cells causes blood-brain barrier dysfunction. J Leukoc Biol. 2005;78:1223–32. doi: 10.1189/jlb.0605340. [DOI] [PubMed] [Google Scholar]
- 28.Anthony IC, Ramage SN, Carnie FW, Simmonds P, Bell JE. Accelerated Tau deposition in the brains of individuals infected with human immunodeficiency virus-1 before and after the advent of highly active anti-retroviral therapy. Acta Neuropathol. 2006;111:529–38. doi: 10.1007/s00401-006-0037-0. [DOI] [PubMed] [Google Scholar]
- 29.Green DA, Masliah E, Vinters HV, Beizai P, Moore DJ, Achim CL. Brain deposition of beta-amyloid is a common pathologic feature in HIV positive patients. AIDS. 2005;9:407–11. doi: 10.1097/01.aids.0000161770.06158.5c. [DOI] [PubMed] [Google Scholar]
- 30.Robertson KR, Su Z, Margolis DM, Krambrink A, Havlir DV, Evans S, Skiest DJ. Neurocognitive effects of treatment interruption in stable HIV-positive patients in an observational cohort. Neurology. 2010;74:1260–6. doi: 10.1212/WNL.0b013e3181d9ed09. [DOI] [PMC free article] [PubMed] [Google Scholar]
- 31.Yeni PG, Hammer SM, Hirsch MS, Saag MS, Schechter M, Carpenter BCC, Fischl MA, Gatell JM, Gazzard BG, Jacobsen DM, Katzenstein DA, Montaner JS, Richman DD, Schooley RT, Thompson MA, Vella S, Volberding PA. Treatment for adult HIV infection: 2004 recommendations of the International AIDS Society-USA Panel. JAMA. 2004;292:251–265. doi: 10.1001/jama.292.2.251. [DOI] [PubMed] [Google Scholar]
- 32.Carr A, Samaras K, Thorisdottir A, Kaufmann GR, Chisholm DJ, Cooper DA. Diagnosis, prediction, and natural course of HIV-1 protease-inhibitor-associated lipodystrophy, hyperlipidaemia, and diabetes mellitus: a cohort study. Lancet. 1999;353:2093–9. doi: 10.1016/S0140-6736(98)08468-2. [DOI] [PubMed] [Google Scholar]
- 33.Dalakas MC, Leon-Monzon ME, Bernardini I, Gahl WA, Jay CA. Zidovudine-induced mitochondrial myopathy is associated with muscle carnitine deficiency and lipid storage. Ann Neurol. 1994;35:482–7. doi: 10.1002/ana.410350418. [DOI] [PubMed] [Google Scholar]
- 34.Gerschenson M, Erhart SW, Paik CY, St Claire MC, Nagashima K, Skopets B, Harbaugh SW, Harbaugh JW, Quan W, Poirier MC. Fetal mitochondrial heart and skeletal muscle damage in Erythrocebus patas monkeys exposed in utero to 3’-azido-3’-deoxythymidine. AIDS Res Hum Retroviruses. 2000;16:635–44. doi: 10.1089/088922200308864. [DOI] [PubMed] [Google Scholar]
- 35.Stein JH, Klein MA, Bellehumeur JL, McBride PE, Wiebe DA, Otvos JD, Sosman JM. Use of human immunodeficiency virus-1 protease inhibitors is associated with atherogenic lipoprotein changes and endothelial dysfunction. Circulation. 2001;104:257–262. doi: 10.1161/01.cir.104.3.257. [DOI] [PubMed] [Google Scholar]
- 36.Blanco JJ, Garcia IS, Cerezo JG, de Rivera JM, Anaya PM, Raya PG, Garcia JG, Lopez JR, Hernandez FJ, Rodriguez JJ. Endothelial function in HIV-infected patients with low or mild cardiovascular risk. J Antimicrob Chemother. 2006;58:133–139. doi: 10.1093/jac/dkl190. [DOI] [PubMed] [Google Scholar]
- 37.Lai S, Bartlett J, Lai H, Moore R, Cofrancesco J, Jr, Pannu H, Tong W, Meng W, Sun H, Fishman EK. Long-term combination antiretroviral therapy is associated with the risk of coronary plaques in African Americans with HIV infection. AIDS Patient Care STDS. 2009;10:815–24. doi: 10.1089/apc.2009.0048. [DOI] [PMC free article] [PubMed] [Google Scholar]
- 38.Lorenz MW, Stephan C, Harmjanz A, Staszewski S, Buehler A, Bickel M, von Kegler S, Ruhkamp D, Steinmetz H, Sitzer M. Both long-term HIV infection and highly active antiretroviral therapy are independent risk factors for early carotid atherosclerosis. Atherosclerosis. 2008;196:720–726. doi: 10.1016/j.atherosclerosis.2006.12.022. [DOI] [PubMed] [Google Scholar]
- 39.Wang X, Chai H, Lin PH, Yao Q, Chen C. Roles and Mechanisms of Human Immunodeficiency Virus Protease Inhibitor Ritonavir and Other Anti-Human Immunodeficiency Virus Drugs in Endothelial Dysfunction of Porcine Pulmonary Arteries and Human Pulmonary Artery Endothelial Cells. Am J Pathol. 2009;174(3):771–781. doi: 10.2353/ajpath.2009.080157. [DOI] [PMC free article] [PubMed] [Google Scholar]
- 40.Zhang X, Banerjee A, Banks WA, Ercal N. N-Acetylcysteine amide protects against methamphetamine-induced oxidative stress and neurotoxicity in immortalized human brain endothelial cells. Brain Res. 2009;1275:87–95. doi: 10.1016/j.brainres.2009.04.008. [DOI] [PMC free article] [PubMed] [Google Scholar]
- 41.Wang H, Joseph JA. Quantifying cellular oxidative stress by dichlorofluorescein assay using microplate reader. Free Radic Biol Med. 1999;5-6:612–6. doi: 10.1016/s0891-5849(99)00107-0. [DOI] [PubMed] [Google Scholar]
- 42.Winters R, Zukowski J, Ercal N, Matthews D, Spitz DR. Analysis of glutathione, glutathione disulphide, cysteine, homocysteine and other biological thiols by HPLC following derivatization with N-(1-pyrenyl) malemide. Anal Biochem. 1995;227:14–21. doi: 10.1006/abio.1995.1246. [DOI] [PubMed] [Google Scholar]
- 43.Draper HH, Squires EJ, Mahmoodi H, Wu J, Agarwal M, Hadley M. A comparative evaluation of thiobarbituric acid methods for the determination of malondialdehyde in biological materials. Free Radic Biol Med. 1993;15:353–363. doi: 10.1016/0891-5849(93)90035-s. [DOI] [PubMed] [Google Scholar]
- 44.Haorah J, Heilman D, Knipe B, Chrastil J, Leibhart J, Ghorpade A, Miller DW, Persidsky Y. Ethanol-induced activation of myosin light chain kinase leads to dysfunction of tight junctions and blood-brain barrier compromise. Alcohol Clin Exp Res. 2005;29:999–1009. doi: 10.1097/01.alc.0000166944.79914.0a. [DOI] [PubMed] [Google Scholar]
- 45.Duke RC, Cohen JJ. Curr Prot Immunol. 1999;1:1–16. [Google Scholar]
- 46.Huang CC, Aronstam RS, Chen DR, Huang YW. Oxidative stress, calcium homeostasis, and altered gene expression in human lung epithelial cells exposed to ZnO nanoparticles. Toxicol In Vitro. 2010;1:45–55. doi: 10.1016/j.tiv.2009.09.007. [DOI] [PubMed] [Google Scholar]
- 47.Bradford MM. A rapid and sensitive method for the quantitation of microgram quantities of protein utilizing the principle of protein–dye binding. Anal Biochem. 1976;72:248–254. doi: 10.1006/abio.1976.9999. [DOI] [PubMed] [Google Scholar]
- 48.Collier AC, Helliwell RJ, Keelan JA, Paxton JW, Mitchell MD, Tingle MD. 3’-azido-3’-deoxythymidine (AZT) induces apoptosis and alters metabolic enzyme activity in human placenta. Toxicol Appl Pharmacol. 2003;192:164–73. doi: 10.1016/s0041-008x(03)00274-6. [DOI] [PubMed] [Google Scholar]
- 49.Yamaguchi T, Katoh I, Kurata S. Azidothymidine causes functional and structural destruction of mitochondria, glutathione deficiency and HIV-1 promoter sensitization. Eur J Biochem. 2002;269:2782–8. doi: 10.1046/j.1432-1033.2002.02954.x. [DOI] [PubMed] [Google Scholar]
- 50.Fiala M, Murphy T, MacDougall J, Yang W, Luque A, Iruela-Arispe L, Cashman J, Buga G, Byrns RE, Barbaro G, Arthos J. HAART drugs induce mitochondrial damage and intercellular gaps and gp120 causes apoptosis. Cardiovasc Toxicol. 2004;4:327–37. doi: 10.1385/ct:4:4:327. [DOI] [PubMed] [Google Scholar]
- 51.Sussman HE, Olivero OA, Meng Q, Pietras SM, Poirier MC, O’Neill JP, Finette BA, Bauer MJ, Walker VE. Genotoxicity of 3′-azido-3′-deoxythymidine in the human lymphoblastoid cell line, TK6: Relationships between DNA incorporation, mutant frequency, and spectrum of deletion mutations in HPRT. Mutat Res. 1999;429:249–259. doi: 10.1016/s0027-5107(99)00111-6. [DOI] [PubMed] [Google Scholar]
- 52.Simpson MV, Chin CD, Keilbaugh SA, Lin TS, Prusoff WH. Studies on the inhibition of mitochondrial DNA replication by 3’-azido-3’-deoxythymidine and other dideoxynucleoside analogs which inhibit HIV-1 replication. Biochem Pharmacol. 1989;38:1033–6. doi: 10.1016/0006-2952(89)90245-1. [DOI] [PubMed] [Google Scholar]
- 53.Lewis W, Gonzalez B, Chromy A, Paoian T. Zidovudine induces molecular, bioche mical, and ultrastructural changes in rat skeletal muscle mitochondria. J clin Invest. 1992;89:134–1360. doi: 10.1172/JCI115722. [DOI] [PMC free article] [PubMed] [Google Scholar]
- 54.Mondal D, Pradhan L, Ali M, Agrawal KC. HAART drugs induce oxidative stress in human endothelial cells and increase endothelial recruitment of mononuclear cells: exacerbation by inflammatory cytokines and amelioration by antioxidants. Cardiovasc Toxicol. 2004;4:287–302. doi: 10.1385/ct:4:3:287. [DOI] [PubMed] [Google Scholar]
- 55.Kline ER, Bassit L, Hernandez-Santiago BI, Detorio MA, Liang B, Kleinhenz DJ, Walp ER, Dikalov S, Jones DP, Schinazi RF, Sutliff RL. Long-term exposure to AZT, but not d4T, increases endothelial cell oxidative stress and mitochondrial dysfunction. Cardiovasc Toxicol. 2009;1:1–12. doi: 10.1007/s12012-008-9029-8. [DOI] [PMC free article] [PubMed] [Google Scholar]
- 56.Meister A. Glutathione metabolism. Methods Enzymol. 1995;251:3–7. doi: 10.1016/0076-6879(95)51106-7. [DOI] [PubMed] [Google Scholar]
- 57.Szabados E, Fischer GM, Toth K, Csete B, Nemeti B, Trombitas K, Habon T, Endrei D, Sumegi B. Role of reactive oxygen species and poly-ADP-ribose polymerase in the development of AZT-induced cardiomyopathy in rat. Free Radic Biol Med. 1999;3-4:309–17. doi: 10.1016/s0891-5849(98)00199-3. [DOI] [PubMed] [Google Scholar]
- 58.Lewis W, Dalakas MC. Mitochondrial toxicity of antiviral drugs. Nat Med. 1995;1:417–422. doi: 10.1038/nm0595-417. [DOI] [PubMed] [Google Scholar]
- 59.Janero DR. Malondialdehyde and thiobarbituric acid-reactivity as diagnostic indices of lipid peroxidation and peroxidative tissue injury. Free Radic Biol Med. 1990;9:515–540. doi: 10.1016/0891-5849(90)90131-2. [DOI] [PubMed] [Google Scholar]
- 60.Marnett LJ. Lipid peroxidation-DNA damage by malondialdehyde. Mutat Res. 1999;424:83–95. doi: 10.1016/s0027-5107(99)00010-x. [DOI] [PubMed] [Google Scholar]
- 61.García-de-la-Asunción J, Gómez-Cambronero LG, Del Olmo ML, Pallardó FV, Sastre J, Viña J. Vitamins C and E prevent AZT-induced leukopenia and loss of cellularity in bone marrow. Studies in mice. Free Radic Res. 2007;41:330–4. doi: 10.1080/10715760600868537. [DOI] [PubMed] [Google Scholar]
- 62.Boveris A, Chance B. The mitochondrial generation of hydrogen peroxide. General properties and effect of hyperbaric oxygen. Biochem J. 1973;134:707–716. doi: 10.1042/bj1340707. [DOI] [PMC free article] [PubMed] [Google Scholar]
- 63.Taylor DE, Ghio AJ, Piantadosi CA. Reactive oxygen species produced by liver mitochondria of rats in sepsis. Arch Biochem Biophys. 1995;316:70–6. doi: 10.1006/abbi.1995.1011. [DOI] [PubMed] [Google Scholar]
- 64.Lin MT, Flint MB. Mitochondrial dysfunction and oxidative stress in neurodegenerative diseases. Nature. 2006;443:787–795. doi: 10.1038/nature05292. [DOI] [PubMed] [Google Scholar]
- 65.Mattson DM, Ahmad IM, Dayal D, Parsons AD, Aykin-Burns N, Li L, Orcutt KP, Spitz DR, Dornfeld KJ, Simons AL. Cisplatin combined with zidovudine enhances cytotoxicity and oxidative stress in human head and neck cancer cells via a thiol-dependent mechanism. Free Radic Biol Med. 2009;46:232–7. doi: 10.1016/j.freeradbiomed.2008.10.023. [DOI] [PMC free article] [PubMed] [Google Scholar]
- 66.Lemasters JJ, Theruvath TP, Zhong Z, Nieminen AL. Mitochondrial calcium and the permeability transition in cell death. Biochim Biophys Acta. 1998;1366:177–196. doi: 10.1016/s0005-2728(98)00112-1. [DOI] [PubMed] [Google Scholar]
- 67.Lemasters JJ, Nieminen AL, Qian T, Trost LC, Elmore SP, Nishimura Y, Crowe RA, Cascio WE, Bradham CA, Brenner DA, Herman B. The mitochondrial permeability transition in cell death: a common mechanism in necrosis, apoptosis and autophagy. Biochim Biophys Acta. 1998;1366:177–96. doi: 10.1016/s0005-2728(98)00112-1. [DOI] [PubMed] [Google Scholar]
- 68.Skulachev VP. Cytochrome c in the apoptotic and antioxidant cascades. FEBS Lett. 1998;423:275–80. doi: 10.1016/s0014-5793(98)00061-1. [DOI] [PubMed] [Google Scholar]
- 69.Barbaro G, Barbarini G. Highly active antiretroviral therapy associated metabolic syndrome and cardiovascular risk. Chemotherapy. 2006;52:161–165. doi: 10.1159/000093034. [DOI] [PubMed] [Google Scholar]
- 70.Falchetti A, Franchi A, Bordi C, Mavilia C, Masi L, Cioppi F, Recenti R, Picariello L, Marini F, Del Monte F, Ghinoi V, Martineti V, Tanini A, Brandi ML. Azidothymidine induces apoptosis and inhibits cell growth and telomerase activity of human parathyroid cancer cells in culture. J Bone Miner Res. 2005;20:410–8. doi: 10.1359/JBMR.041123. [DOI] [PubMed] [Google Scholar]
- 71.Jiang B, Hebert VY, Li Y, Mathis JM, Alexander JS, Dugas TR. HIV anti retroviral drug combination induces endothelial mitochondrial dysfunction and reactive oxygen species production, but not apoptosis. Toxicol Appl Pharmacol. 2007;24:60–71. doi: 10.1016/j.taap.2007.06.010. [DOI] [PubMed] [Google Scholar]
- 72.Lichtner M, Mengoni F, Mastroianni CM, Sauzullo I, Rossi R, De Nicola M, Vullo V, Ghibelli L. HIV protease inhibitor therapy reverses neutrophil apoptosis in AIDS patients by direct calpain inhibition. Apoptosis. 2006;11:781–7. doi: 10.1007/s10495-006-5699-5. [DOI] [PubMed] [Google Scholar]
- 73.Boehning D, Patterson RL, Sedaghat L, Glebhova NO, Kurosaki T, Synder SH. Cytochrome c binds to inositol (1,4,5) triphosphate receptors, amplifying calcium- dependent apoptosis. Nat Cell Biol. 2003;5:1051–61. doi: 10.1038/ncb1063. [DOI] [PubMed] [Google Scholar]
- 74.Sandoval R, Malik AB, Minshall RD, Kouklis P, Ellis CA, Tiruppathi C. Ca(2+) signalling and PKCalpha activate increased endothelial permeability by disassembly of VE-cadherin junctions. J Physiol. 2001;1:433–45. doi: 10.1111/j.1469-7793.2001.0433a.x. [DOI] [PMC free article] [PubMed] [Google Scholar]
- 75.Bogatcheva NV, Garcia JG, Verin AD. Role of tyrosine kinase signaling in endothelial cell barrier regulation. Vascul Pharmacol. 2002;39:201–12. doi: 10.1016/s1537-1891(03)00009-0. [DOI] [PubMed] [Google Scholar]
- 76.Haorah J, Heilman D, Knipe B, Chrastil J, Leibhart J, Ghorpade A, Miller DW, Persidsky Y. Ethanol-induced activation of myosin light chain kinase leads to dysfunction of tight junctions and blood-brain barrier compromise. Alcohol Clin Exp Res. 2005;6:999–1009. doi: 10.1097/01.alc.0000166944.79914.0a. [DOI] [PubMed] [Google Scholar]
- 77.Grinberg L, Fibach E, Amer J, Atlas D. N-acetylcysteine amide, a novel cell-permeating thiol, restores cellular glutathione and protects human red blood cells from oxidative stress. Free Radic Biol Med. 2005;38:136–145. doi: 10.1016/j.freeradbiomed.2004.09.025. [DOI] [PubMed] [Google Scholar]
Associated Data
This section collects any data citations, data availability statements, or supplementary materials included in this article.