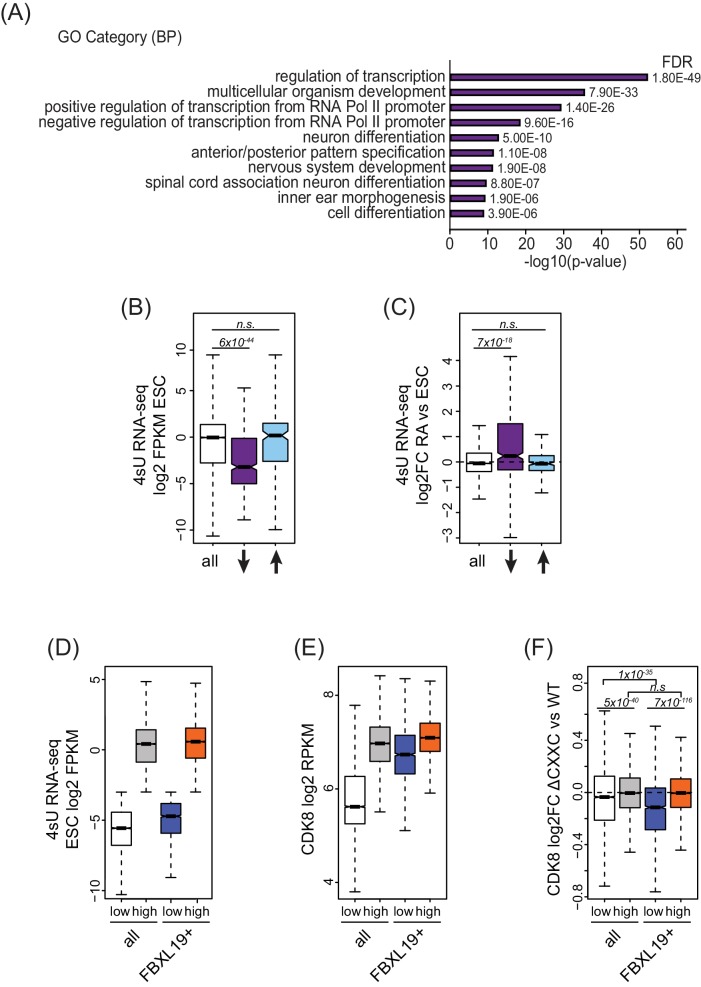
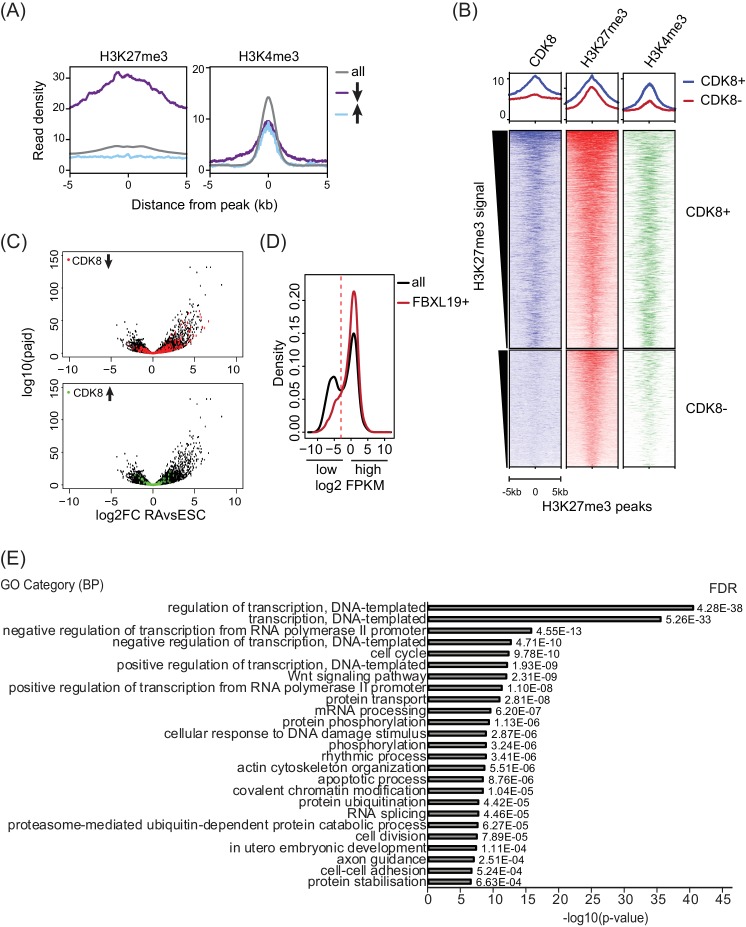
Figure 5. FBXL19 targets CDK8 to promoters of silent developmental genes in ES cells.
(A) Gene ontology analysis of genes associated with a decrease in CDK8 binding (n = 673).(B) A boxplot showing expression levels (log2FPKM) of CDK8-bound genes in wild-type ES cells. CDK8-associated genes are divided based on CDK8 binding in Fbxl19ΔCXXC ES cells: all CDK8-bound (n = 15161), reduced CDK8 (n = 673, ↓), and increased CDK8 binding (n = 255, ↑). p-values were calculated using a Wilcoxon rank sum test. (C) A boxplot showing the change in gene expression (log2 fold change) observed by 4sU RNA-seq of CDK8-associated genes (as in B) following RA treatment. p-values were calculated using a Wilcoxon rank sum test. (D) A boxplot comparing gene expression levels (log2FPKM) of all (n = 19310) and FBXL19-bound (FBXL19+, n = 11368) genes separated by low (all genes n = 7417; FBXl19+ genes n = 2031) and high expression levels (all genes n = 11893, FBXl19+ genes n = 9337) in ES cells (based on Figure 5—figure supplement 1B). (E) A boxplot showing CDK8 enrichment at all and FBXL19-bound genes separated by expression level as in (D). (F) A boxplot showing change in CDK8 binding at the TSSs of all and FBXL19-bound genes divided by expression level as in (D). p-values were calculated using a Wilcoxon rank sum test.


