

Abstract
Although previous reports suggest that tumor-induced myeloid-derived suppressor cells (MDSC) inhibit T cells by L-arginine depletion through arginase-1 activity, we herein show that arginase-1 is neither inherently expressed in MDSC nor required for MDSC-mediated inhibition. Employing Percoll density gradients, large expansions of MDSC in the bone marrow of tumor-bearing mice were isolated and demonstrated potent inhibition in T cell proliferation activated by TCR-ligation, Concanavalin A, PMA plus ionomycin, or IL-2. Despite demonstrating characteristic immunosuppressive capacity, these MDSC exhibit no arginase-1 expression and/or exert their inhibitory effects independent of arginase-1 activity. However, arginase-1 expression in MDSC can be induced by exposure to TCR-activated T cells or their culture medium, but not T cells activated by other means or growing tumor cells. Further investigation reveals multiple cytokines secreted by TCR-activated T cells as orchestrating two signaling-relay axes, IL-6-to-IL-4 and GM-CSF/IL-4-to-IL-10, leading to arginase-1 expression in MDSC. Specifically, IL-6 signaling increases IL-4R, enabling IL-4 to induce arginase-1 expression; similarly, GM-CSF in concert with IL-4 induces IL-10R, allowing IL-10-mediated induction. Surprisingly, our study indicates that induction of arginase-1 expression is not conducive to the critical MDSC-mediated inhibition toward T cells, which is rather dependent on direct cell contacts undiminished by PD-L1 blockade or SIRPα deficiency.
Keywords: Arginase -1, Myeloid-derived suppressor cell, GM-CSF, IL-4, IL-10
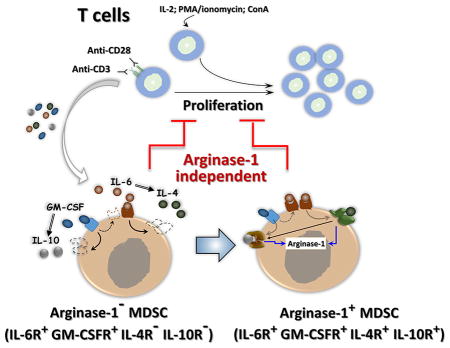
Graphical abstract
Arginase-1 expression in MDSCs can be induced by exposure to TCR-activated T cells but not T cells activated by ConA, PMA or IL-2. IL-6-to-IL-4 and GM-CSF/IL-4-to-IL-10 signaling axes lead to arginase-1 expression in MDSCs. However, MDSC-mediated inhibition toward T cells is independent of arginase-1 but requires direct cell contact.
Introduction
Mice engrafted with tumors, as well as human patients with advanced cancer, are characterized by suppression of T cell mediated antitumor immunity [1]. This phenomenon is attributed, in part, to the increase in myeloid-derived suppressor cells (MDSC) in the tumor mass and lymphoid organs such as the spleen, where MDSC inhibit antitumor T cells, promoting tumor progression [2–4]. In murine tumor models, MDSC are characterized as CD11b+Gr-1+ leukocytes, which are further divided into two subpopulations based on the expression of either Ly6C or Ly6G: the Ly6G+CD11b+Ly6Clow granulocytic MDSC (G-MDSC) and the Ly6ChighCD11b+Ly6G− monocytic MDSC (M-MDSC) [5, 6]. Both G-MDSC and M-MDSC inhibit T cells, especially T cell proliferation [5, 7].
Studies on the mechanisms by which MDSC inhibit T cell proliferation suggest that MDSC-expressed arginase activity is important [8–10]. Two arginase isoforms, arginase-1 and arginase-2, are found in mammals. Between these two forms, arginase-1 is primarily expressed in myeloid leukocytes including macrophages of the M2 phenotype, dendritic cells and MDSC, and is also found in liver cells, while arginase-2 is expressed in different tissue cells such as those in the intestines, kidney, brain, and prostate [8, 10]. For MDSC inhibiting T cells, the arginase-1-mediated depletion of L-arginine is thought to impede cell proliferation and affect cell metabolism and effector functions. Moreover, in T cells, depletion of L-arginine has been shown to be associated with a reduction of the T cell receptor (TCR) subunit CD3ζ, leading to a diminished TCR response [11, 12]. In the cancer condition, increased arginase-1 activity has been detected in the tumor microenvironment (TME) [13–15]. Inhibition of arginase-1 activity by the chemical inhibitor nor-NOHA, as performed by several studies, has been shown to rescue T cell proliferation and suppress tumor growth [16–18]. However, other studies using the same arginase inhibitor failed to rescue T cell proliferation and presented different results that argued if and how the arginase-1 activity is essential for inhibiting T cells [19–21]. Furthermore, the mechanism by which arginase-1 is expressed in MDSC is unclear. T cell-produced cytokines, especially the Th2 cytokines IL-4 and/or IL-13, which are known to induce arginase-1 in the M2 phenotype-skewed macrophages [22, 23], have been suggested to also induce arginase-1 expression in MDSC [24]. However, different studies using IL-4Rα knockout mice, or by the IL-4Rα targeting approach, as well as a breast tumor model, have shown that mere deficiency of IL-4 signaling has no effect on MDSC activity [25] [5, 26]. A study on C26 colon carcinoma attributed arginase-1 expression to IFNγ-mediated signaling [27] albeit ruled out by a study of another cancer model, in which arginase-1 expression in MDSC was suggested to be dependent on tumor-released factors but not T cell cytokines including IFNγ [28]. The possibility that IFNγ is irrelevant was further implied by a therapeutic study in which targeting IFNγ failed to limit MDSC or MDSC-mediated immunosuppression [26]. In summary, these varied or controversial studies point to the lack of clarity surrounding the mechanism(s) that control arginase-1 expression in MDSC, as well as how MDSC inhibit T cell proliferation.
In our studies of tumor-engrafted mice, extensive MDSC expansions were observed in the bone marrow along with tumor progression. Interestingly, isolation of these bone marrow MDSC failed to detect arginase-1, despite these cells demonstrating potent inhibition on T cell proliferation. Exposure of these MDSC to TCR-activated T cells, or these T cells’ conditioned medium, rapidly induced arginase-1 expression, suggesting that diffusible factors, which were later defined to be two axes of sequentially signaling cytokines, released by TCR-activated T cells triggered arginase-1 expression. Importantly, our studies provide evidence that implies MDSC-mediated inhibition of T cells is independent of arginase activity but rather through cell contacts-mediated events, which are orchestrated by mechanisms that remain to be investigated.
Results
Extensive MDSC expansion in the bone marrow of tumor-bearing mice
Mice engrafted with B16 melanoma, MC38 colon carcinoma, or EL4 lymphoma were associated with an extensive expansion of MDSC in the bone marrow (Table 1). Employing Percoll density gradients, MDSC were separated from other bone marrow cells. As shown in Fig. 1A, MDSC appeared to be low-density myeloid leukocytes, settling at the Percoll densities between 50% – 60% (Fr. III). Other myeloid cells, especially mature granulocytes (PMN), were mostly enriched in the high-density fraction (Fr. IV) at the interface between the 60% – 70% densities. Analyses of isolated bone marrow-derived MDSC revealed a mixture of Ly6G+Ly6Clow G-MDSC and Ly6Chigh Ly6G− M-MDSC in the population (Fig. 1A). The function of MDSC was confirmed by the capability to inhibit T cell proliferation. For these experiments, splenic T cells were induced to proliferate by activation of the TCR pathway through ligation of CD3 along with CD28 (CD3/CD28), by stimulation using Concanavalin A (ConA), by stimulation using the PKC activator PMA plus ionomycin [31, 32], or by IL-2. As shown in Fig. 1B–C, all four mechanisms had effectively induced T cell proliferation. In particular, the former three mechanisms induced both CD4 and CD8 T cells to proliferate, whereas IL-2 induced only CD8 T cell proliferation – a result consistent with previous reports [33, 34]. Following the addition of MDSC into these activation systems, T cell proliferation, regardless of the mechanism of induction, was completely abrogated. Further separation of MDSC into the G- and M- subpopulations by Ly6G and Ly6C selections demonstrated that both G-MDSC and M-MDSC possess this potent inhibitory capacity (Fig. 1D–E). In contrast, mature PMN isolated from the same Percoll gradient (Fr. IV), though bearing the same Ly6G+Ly6Clow marker as those of G-MDSC, showed absolutely no inhibition.
Table 1.
Percoll-density separation of bone marrow (BM) cells. Mice were subcutaneously (s.c.) engrafted with B16 melanoma, MC38 colon carcinoma, and EL4 lymphoma for 21 days. BM cells from femur and tibia bones were collected and further separated by Percoll density gradients. Total BM cells prior to separation were counted and the percentage of cells distributed in bands I to IV were calculated. BM cells from healthy mice were used as control.
| Band | Percoll density separate BM cells (Mean ± SEM) | |||
|---|---|---|---|---|
|
| ||||
| Healthy | B16 (s.c.) | MC38 (s.c.) | EL4 (s.c.) | |
| I (% total) | 16.5 ± 2.1 | 7.5 ± 1.4 | 10.0 ± 2.0 | 9.4 ± 1.8 |
| II (% total) | 23.0 ± 1.7 | 14.7 ± 1.9 | 11.6 ± 0.8 | 10.6 ± 1.2 |
| III (% total) | 27.9 ± 1.7 | 46.4 ± 3.1*** | 43.5 ± 3.1*** | 44.4 ± 2.1*** |
| IV (% total) | 32.7 ± 2.7 | 31.4 ± 3.2 | 35.0 ± 2.0 | 35.6 ± 1.9 |
|
| ||||
| Total (x106) | 31.5±2.1 | 35.3±2.3 | 35.0±2.9 | 36.7±3.3 |
p ≤ 0.001, n=6 per group.
Figure 1.

Expansion of MDSC in tumor bone marrow. A) Isolation of bone marrow myeloid leukocytes by Percoll density gradients. Bone marrow cells harvested from tumor-bearing mice were applied to discontinuous Percoll density gradients and separated into four fractions (I, II, III, and IV), where myeloid leukocytes were enriched in fractions III and IV (Fr. III and Fr. IV) as determined by Ly6C and Ly6G labeling. B–C) Characterization of Fr. III MDSC by inhibition of T cell proliferation. Splenic T cells labeled with CFSE were induced to proliferate by antibody ligations of CD3 and CD28 (CD3/CD28), ConA, PMA plus ionomycin (PMA+ion.), and IL-2 in the absence (control) or the presence of Fr. III MDSC at the ratio of MDSC: splenocytes = 1: 4. After 4 days, the proliferation of T cells, both CD4 and CD8, was determined by flow cytometric analyses of CSFE dilution (left shift). NC, no proliferation induction. The full gating strategy is presented in Supporting Information Fig 1. D–E) Inhibitory effect of M-MDSC and G-MDSC on T cell proliferation. Fr. III MDSC were further separated into M-MDSC and G-MDSC by Ly6C and Ly6G selection, respectively, prior to testing in T cell proliferation induced by CD3/CD28. The Fr. IV mature PMN were also simultaneously tested. MDSC/PMN: splenocytes = 1:4. The experiments of B) and D) were repeated independently at least more than five times using MDSC from different tumor-bearing mice (n > 15) with statistical data (mean ± SEM) shown in C) and E), respectively. ***, p ≤ 0.001.
Absence of arginase-1 in bone marrow-derived MDSC from tumor-bearing mice
Despite that bone marrow-derived MDSC from tumor-bearing mice displayed the characterized T cell inhibitory capacity, expression of arginase-1 in these cells failed to be detected. As shown in Fig. 2A, WB detected no arginase-1 in freshly isolated Fr. III MDSC, or the subsequently separated M-MDSC and G-MDSC. On the other hand, the same reagents and procedures used to detect arginase-1 in M2-polarized macrophages, or CD11b+ myeloid cells isolated from tumor tissues and the spleen from the same mice, displayed strong expression. These experiments concluded that the failure to detect arginase-1 in bone marrow-derived MDSC was due to an absence of the enzyme expression.
Figure 2.

Bone marrow MDSC express no arginase-1 unless induced. A) Arginase-1 expression in freshly isolated bone marrow MDSC. Western blot (WB) was performed to detect arginase-1 in total bone marrow MDSC (Fr. III MDSC) and separated M-MDSC and G-MDSC, CD11b+ myeloid cells isolated from tumor tissues and the spleen of the same tumor-bearing mice, and M2-skewed macrophages (positive control.). B) Arginase-1 expression in MDSC after exposure to activated T cells. Splenocytes in which T cell proliferation was stimulated by different mechanisms were cultured in the presence (Fr. III MDSC + SP.) or the absence (SP.) of freshly isolated bone marrow MDSC. After 4 days, cells were collected for arginase-1 detection by WB. “Naïve” are T cells without proliferative stimulation. C) Splenocytes in which T cells were antibody ligated for CD3 alone, CD3 and CD28, or CD28 alone were co-cultured with Fr. III MDSC for 4 days prior to WB analyses for arginase-1 expression. D) MDSC were co-cultured with total splenocytes, purified splenic T cells, T cell-depleted splenocytes, purified CD4+ T and CD8+ T cells without (naïve) or with TCR activation (CD3/CD28) prior to detection of arginase-1 expression. E) Time length required for MDSC to express arginase after exposing to TCR-activated T cells. F) Arginase-1 expression in M-MDSC, G-MDSC and PMN under induction. Data represent consensus results of more than five independent experiments.
Induction of arginase-1 expression in MDSC by TCR-activated T cells
Interestingly, we observed that bone marrow-derived MDSC began to express arginase-1 following exposure to TCR-activated T cells. As shown in Fig. 2B, MDSC that were co-cultured with CD3/CD28-ligated T cells were positive for arginase-1 expression. This arginase-1 induction by T cells appeared to require TCR-mediated signaling, for naïve T cells and T cells activated by other mechanisms (e.g. ConA, PMA plus ionomycin, or IL-2) did not have the same effect. Indeed, ligation of the TCR subunit CD3 alone was necessary and sufficient to induce arginase-1 in co-cultured MDSC, while ligation of CD3 plus CD28 produced stronger induction. Conversely, ligation of CD28 alone was inadequate for induction of arginase-1 (Fig. 2C). Both CD4 and CD8 T cells with CD3/CD28 ligation displayed induction of arginase-1 in MDSC, whereas the absence of TCR ligation, or splenocytes depleted of T cells, had no inductive capacity (Fig. 2D). A time period of 18–24 h was required for TCR-activated T cells to induce arginase-1 expression in MDSC, and shorter time periods (e.g. ≤ 6) were found to be inadequate (Fig. 2E). Consistent with previous reports indicating that arginase-1 is primarily expressed in M-MDSC [35–37], TCR-activated T cells induced much stronger arginase-1 expression in M-MDSC than that in G-MDSC (Fig. 2F), despite that both M- and G- MDSC potently inhibited T cell proliferation.
Although MDSC expression of arginase-1 required exposure to TCR-activated T cells, cognate interaction between the two cell-types was not imperative. As shown in Fig. 3A, treating MDSC with the cell-free medium collected from TCR-activated T cells directly induced arginase-1 expression. This induction was in a manner similar to MDSC that were co-cultured with TCR-activated T cells, both requiring a treatment of 18–24 h (Fig. 3B), suggesting a de novo gene expression likely involved for arginase-1. We also observed that the medium collected on day 2 during TCR activation had stronger induction strength than that of day 1, and consistent with earlier results, the medium collected from T cells activated by Con-A, PMA plus ionomycin, or IL-2 completely lacked this inductive capacity (Fig. 3C). Furthermore, screening other cells and their culture medium found that tumor cells (e.g. B16, EL4, or MC38) had no capacity to induce arginase-1 expression in MDSC (Fig. 3C). Again, both CD4 and CD8 T cells with TCR ligation produced factors that induced arginase-1 in MDSC (Fig. 3D). In conclusion, these results suggest that T cells activated through the TCR pathway release diffusible factor(s) that affect MDSC and induce arginase-1 expression.
Figure 3.

Cell contact-independent induction of arginase-1 expression in MDSC by TCR-activated T cells. A). MDSC treated for 24 h with conditioned medium containing cell-free supernatants (30% conditioned) collected from splenocyte cultures in which T cells were activated by TCR ligation (CD3/CD28 Sup.) were tested for arginase-1 expression. Supernatants from cultures in which T cells were not activated (naïve) were used as controls. B) Time-course of medium-induced arginase-1 expression. MDSC treated with TCR-activated T cell medium as in A) were collected at 0, 3, 6, and 18 h for analyses. C) Comparison of cell mediums for the capacity of inducing arginase-1. Cell-free supernatants from T cell cultures in which T cells were activated by different mechanisms and from cultures of tumor cells including B16 melanoma, EL4 lymphoma, and MC38 colonic carcinoma were used to treat MDSC (30% conditioned medium). D1 and d2, supernatants collected day-1 and day-2, respectively, after T cell culture started. D) Aginase-1 expression in MDSC after exposure to conditioned medium of TCR-activated, either CD4 or CD8 T cells. Arginase-1 expression in MDSC were detected by WB with β-actin detection as loading controls. Demonstrated data represent five independent experiments.
Cytokine-mediated arginase-1 induction in MDSC
Since cytokines have been shown to regulate arginase-1 expression [38–40], we postulated that specific cytokine(s) released by TCR-activated T cells, but not by T cells activated by other mechanisms, induced arginase-1 expression in MDSC. As shown in Table 2, assaying medium collected from activated T cell cultures found that TCR-activated T cells produced more types and higher levels of cytokines than T cells activated by ConA, PMA plus ionomycin, or IL-2. In particular, IL-4 and IL-10 appeared to be unique for TCR-activated T cells. Moreover, IL-4 progressively increased in the medium during TCR activation, whereas IL-10 was not produced until day 2. In addition, much higher levels of GM-CSF, IL-6, IFNγ, and IL-17 were produced by TCR-activated T cells than other T cells. To assess if these unique or highly produced cytokines were essential, neutralization antibodies against different cytokines were utilized (Fig. 4A). Since MDSC started to express arginase-1 the day following co-culture with TCR-activated T cells, we particularly studied the medium collected during early time points (days 1 and 2). As shown in Fig. 4A, neutralization of IL-4 completely and partially (~ 50%) eliminated the capacity of TCR-activated T cell medium collected on day 1 and day 2, respectively, to induce arginase-1 in MDSC. While neutralization of IL-10 in the medium of day 1 showed no effect, the same neutralization in the medium of day 2 significantly (~ 50%) reduced arginase-1 expression. This was consistent with the finding that no IL-10 was detectable on day 1. Neutralization of IL-6 or GM-CSF each partially reduced arginase-1 induction, whereas neutralization of IL-17 or IFNγ showed no reduction – but somewhat increased (~ 20–50%) arginase-1 expression in MDSC. Together, these results concluded that IL-4 and IL-10 were critical, while IL-6 and GM-CSF also played roles in inducing arginase-1 in MDSC by TCR-activated T cell medium.
Table 2.
Cytokines produced from splenocytes culture in which T cells were activated by ligation of TCR (anti-CD3/CD28), ConA, PMA plus ionomycin, or IL-2. Cytokine levels in media following T cells activation were evaluated by using LEGENDplex kits according to the manufacture instructions.
| Cytokine (pg/ml) | T cell activation mechanism | ||||
|---|---|---|---|---|---|
|
| |||||
| Ctl. (d1/d2) | CD3/CD28 (d1/d2) | ConA (d1/d2) | PMA+ion. (d1/d2) | IL-2 (d1/d2) | |
|
|
|||||
| GM-SF | ND/3.2 ± 0.6 | 41.6 ± 5.1/408.4 ± 51.2*** | ND/ND | 37.9 ± 6.5/106.7 ± 16.9*** | ND/ND |
| IL-6 | ND/2.2 ± 0.7 | 377.0 ± 46.3/286.1 ± 26.7*** | ND/107.6 ± 21.0*** | 23.6 ± 2.2/51.2 ± 6.1*** | ND/ND |
| IL-4 | ND/ND | 25.2 ± 4.2/40.9 ± 7.7*** | ND/ND | ND/ND | ND/ND |
| IL-10 | ND/5.1 ± 1.3 | ND/667.7 ± 91.8*** | ND/ND | ND/ND | ND/ND |
| IFNγ | ND/ND | 3084.6 ± 228.2/3262.3 ± 165.0*** | 218.6 ± 26.1/2287.9 ± 215.1*** | 2048.9 ± 113.0/2807.6 ± 221.9*** | 123.1 ± 10.7/1912.1 ± 115.3*** |
| TNFα | ND/ND | 103.1 ± 17.2/314.3 ± 20.5*** | 6.8 ± 1.4/60.8 ± 7.3*** | 73.9 ± 16.6/155.8 ± 12.4*** | ND/ND |
| IL-12 | ND/ND | ND/ND | ND/ND | ND/ND | ND/ND |
| IFNβ | ND/ND | ND/ND | ND/ND | ND/ND | ND/ND |
| IL-1β | ND/ND | ND/ND | ND/ND | ND/ND | ND/ND |
| IL-17 | ND/ND | 32.7 ± 4.0/328.9 ± 46.3*** | ND/19.1 ± 2.3*** | ND/ND | ND/ND |
Data are expressed as means ± SEM (n ≥ 6). ND, undetectable.
p < 0.001.
Figure 4.

Cytokine-mediated arginase-1 induction in MDSC. A) Effect of cytokine neutralization in TCR-activated T cell medium on arginase-1 induction in MDSC. T cell culture supernatants collected on day-1 (d1) and day-2 (d2) after T cells were activated by CD3/CD28 ligation were used to treat freshly isolated bone marrow MDSC (Fr. III MDSC, 50% conditioned medium) in the absence (control.) or the presence of blocking antibodies against IL-4, IL-6, IL-10, IL-17, IFNγ or GM-CSF, alone or in combination. After 24 h of treatment, arginase-1 expression in MDSC was assessed by WB. B–E) Directly treating Fr. III MDSC with cytokines. MDSC were treated with recombinant IL-4, IL-6, IL-10, IL-17, IFNγ or GM-CSF in various combinations (B-E), or alone (C), for 24 h prior to analyses for arginase-1 expression by WB. Sample data shown indicate that two cytokine combinations, IL-4/IL-6 (colored blue) and GM-CSF/IL-10 (colored green), are capable of inducing arginase-1 expression in MDSC. F) Supplementation with IL-4/IL-6 or GM-CSF/IL-10 confers the capacity for T cells activated by ConA, PMA plus ionomycin, or IL-2 to induce arginase-1. Fr. III MDSC were treated with culture supernatants collected from T cells activated by ConA, PMA plus ion., or IL-2 (50% conditioned medium) without or with the addition of IL-4 and IL-6, or GM-CSF and IL-10 for 24 h prior to analyses for arginase-1 expression. More than twenty different cytokine neutralization permutations have been performed, and sample data presented in the figure represent at least five independent experiments. All WB used β-actin detection as the loading control and demonstrated data represent five independent experiments
Next, we directly treated MDSC with different cytokines, without involving T cell-conditioned medium. As shown in Fig. 4B, treating MDSC with a cytokine cocktail containing IL-4, IL-6, GM-CSF, IL-10, IL-17 and IFNγ induced arginase-1 expression, which could yet be diminished by exclusion of IL-4 or, to a slightly less extent, IL-10. These results emphasized the importance of IL-4 and IL-10, and also showed that treating MDSC with these cytokines individually failed to induce arginase-1 expression (Fig. 4C). Different cytokine combinations revealed that the cocktail consisting of either IL-4/IL-6 (colored blue), or GM-CSF/IL-10 (colored green), was sufficient to induce arginase-1, and the combination of these four cytokines produced strong induction (sample data shown in Fig. 4, D–E). On the other hand, the presence of IL-17 and/or IFNγ generally weakened the induction strength (Fig. 4E). In addition, GM-CSF appeared to promote IL-4/IL-6–induced arginase-1 expression; however, the GM-CSF combination with either IL-6 or IL-4 had a lesser effect. The presence of IL-10 in IL-4/IL-6, rather than merely IL-4/IL-6, also seemed to enhance arginase-1 induction. Remarkably, supplement of IL-4/IL-6 and/or GM-CSF/IL-10 into T cells activated by ConA, PMA plus ionomycin, or IL-2, or their respective medium, immediately conferred strong arginase-1 induction capacities (Fig. 4F). Therefore, these T cell activation mechanisms do not induce arginase-1 expression in MDSC due to their lack of production of these essential cytokines.
Dual axes of cytokine pathways regulate arginase-1 expression in MDSC
In other experiments, we examined the cytokine receptors on MDSC. Surprisingly, we found that freshly isolated MDSC, M-MDSC in particular, from the bone marrow of tumor-bearing mice expressed IL-6R, but neither IL-4R nor IL-10R on the surface (Fig. 5A). Treating MDSC with IL-6 (in a balanced buffer) rapidly increased IL-4R on M-MDSC but not G-MDSC (Fig. 5B). Given that IL-6 also functions through soluble receptors (sIL-6R), which then deliver signals via the broadly expressed co-receptor gp130 [41, 42], we tested if there were sIL-6Rs in tumor mouse serum that led to an IL-6 response even in G-MDSC. As shown in Fig. 5C, treating MDSC with IL-6 in the presence of tumor mouse serum increased IL-4R expression on both M-MDSC and G-MDSC, suggesting sIL-6R was present and signaling through gp130. Moreover, the level at which IL-4R increased on M-MDSC with the mouse serum present was higher than without the serum upon IL-6 treatment (Fig. 5B–C). Together, these results explained why IL-4 alone, even though being critical, failed to induce arginase-1, and how the IL-6-IL-4 axis enabled the response. Given that elevated sIL-6R was found in the serum during tumor progression [43, 44], the IL-6-IL-4 cytokine regimen thus would regulate both M- and G- MDSC in vivo. Furthermore, these results support the observation that arginase-1 induction is greater in M-MDSC than in G-MDSC.
Figure 5.

Dual axes of cytokine-mediated arginase-1 induction in MDSC. A–C) Expression of cytokine receptors on MDSC. Freshly isolated Fr. III MDSC without treatment (A),or treated by various cytokines or T cell culture supernatants (B–C) for 24 h were tested for the cell surface expression of receptors for IL-4 (IL-4R), IL-6 (IL-6R) and IL-10 (IL-10R) by flow cytometry. In particular, cytokine treatments were performed in DMEM with either 10% FBS (B) or 20% murine serum (C) obtained from tumor-bearing mice. D) Schematic depiction of dual-axis cytokine responses that induce arginase-1 expression in MDSC. E) Testing arginase-1 induction via IL-6-to-IL-4 and GM-CSF-to-IL-10 pathways and the effect of GM-CSF on promoting IL-6/IL-4-mediated induction. Fr. III MDSC were treated with different cytokines or their combinations for 24 h prior to WB analyses. For sequential treatments, MDSC were incubated with the first cytokine for 12 h, washed three times, then were incubated with the second cytokines for 18 h. F) IL-4 or IL-10 confers the capacity for T cells activated by PMA plus ionomycin to induce arginase-1. The culture supernatants from T cells activated by PMA plus ionomycin (Table 2) were supplemented with IL-4 or IL-10 when used for treating Fr. III MDSC (50% conditioned medium). G) Inhibition of JAK kinases in MDSC abrogates arginase-1 induction by TCR-activated T cells. Fr. III MDSC were treated with TCR-activated T cell medium in the absence or the presence of a JAK inhibitor (JAK Inhibitor I) that inhibits JAK1/2/3. All MDSC treatments lasted for 24 h prior to arginase-1 detection by WB with β-actin detection as the loading control. Demonstrated data represent at least five independent experiments.
Meanwhile, treating MDSC with GM-CSF only slightly affected IL-4R expression, but significantly increased IL-10R and IL-6R expression (Fig. 5B). Therefore, through inducing IL-10R, GM-CSF enabled the IL-10 response, leading to arginase-1 induction. Also, through elevating IL-6R expression, GM-CSF augmented the IL-6-IL-4 axis. We also found that the IL-4/IL-6 combination, but not IL-6 alone, induced IL-10R expression (Fig. 5B). This result explains why the earlier data showed that the IL-4/IL-6/IL-10 combination induced a higher level of arginase-1 than that of IL-4/IL-6. In summary, these results suggest dual axes of cytokine-mediated responses leading to arginase-1 expression. In the first axis, IL-6 signaling induces IL-4R, enabling IL-4 to induce arginase-1 expression (Fig. 5D). GM-CSF also promotes this IL-6-IL-4 axis by increasing IL-6R. In the second axis, GM-CSF induces IL-10R, enabling IL-10 to induce arginase-1. Moreover, the IL-6-IL-4 axis also increases IL-10R, resulting in simultaneous activation of two arginase-1 induction mechanisms in the presence of IL-10.
Following these perceptions, we treated MDSC with IL-6 or GM-CSF, and then IL-4 or IL-10, respectively, or vice-versa. Between the two sequential steps of treatment, thorough wash ensured removal of residual cytokines. These experiments showed that only the treatment of IL-6 then IL-4, and GM-CSF then IL-10 yielded arginase-1 induction (Fig. 5E). Since T cells activated by PMA plus ionomycin were found to release IL-6 and GM-CSF, we supplemented either IL-4 or IL-10 in the medium when treating MDSC. As expected, IL-4 and IL-10 supplementation successfully enabled the medium to induce arginase-1 (Fig. 5F). Additionally, since both cytokine axes leading to arginase-1 expression were signaling via the JAK-STAT pathways, an inhibitor that targeted JAK family kinases JAK1/2/3 was tested. As shown in Fig. 5G, inhibition of JAKs completely eliminated the capacity of TCR-activated T cell medium to induce arginase-1 expression, further confirming that the medium induced arginase-1 through the effect of cytokines.
MDSC-mediated inhibition of T cell proliferation is arginase-1-independent but cell contact-dependent
Given that arginase-1 activity depleting L-arginine has been suggested to play a role in MDSC-mediated inhibition, we questioned whether MDSC with arginase-1 expression would be more potent at inhibiting T cell proliferation than those lacking arginase-1, despite that the latter also showed strong inhibition in our experiments. Three experiments were performed to test this. First, freshly isolated Fr. III MDSC were treated with IL-4/IL-6 and TCR-activated T cell medium to induce arginase-1 prior to use in T cell proliferation assays. As shown in Fig. 6A, compared to control MDSC without arginase-1 induction, MDSC with arginase-1 expression displayed no further inhibition in T cell proliferation induced by different mechanisms. Second, we tested if suppressing arginase-1 expression would attenuate MDSC-mediated inhibition of TCR-activated T cells. Neutralization antibodies against IL-4, IL-6, GM-CSF and IL-10 were added along with freshly isolated bone marrow-derived MDSC into TCR-induced T cell proliferation assays. As shown in Fig. 6B–C, MDSC-mediated inhibition of T cell proliferation was not reduced in the presence of antibodies, despite that arginase-1 induction was negated as confirmed by WB (Fig. 6D). To better achieve L-arginine depletion, the inhibition assays were also tested using the medium that was first cultured with the arginase-expressing MDSC overnight (Fig. 6B, blue panel). However, none of the conditions exhibited inhibition on T cell proliferation. Third, an arginase-1 inhibitor, nor-NOHA, and L-arginine free amino acid were utilized. As shown in Fig. 6B (green panel), neither nor-NOHA nor L-arginine free amino acid, nor their combination, reduced MDSC inhibition or rescued T cell proliferation. Similar results were also observed in splenic and tumor Gr-1+CD11b+ MDSC (Supporting Information Fig. 2). Together, these experiments concluded that arginase-1 activity posed an insignificant role in MDSC-mediated inhibition of T cell proliferation.
Figure 6.

MDSC inhibition of T cell proliferation depends on direct cell contact not arginase-1 activity. A). MDSC with or without prior induction of arginase-1 by IL-4/IL-6 or TCR-activated T cell medium (24 h treatment) were added at varied amounts into T cell proliferation systems induced by CD3/CD28 ligation, ConA, PMA plus ionomycin, or IL-2 for 4 days. The amounts of MDSC added were MDSC: splenocytes = 1: 9 (10%), 1: 6 (15%) and 1: 3 (25%). B) Blockade of arginase-1 expression or activity did not dampen MDSC inhibition of TCR-activated T cell proliferation. Black panel, TCR-activated T cell proliferation was performed in the presence Fr. III MDSC (25%). Neutralization antibodies against IL-4, IL-6, IL-10 and GM-CSF were added in the co-culture to suppress arginase-1 induction in MDSC. Green panel, Arginase-1 inhibitor (nor-NOHA) and L-arginine free amino acid do not rescue T cell proliferation inhibited by MDSC. Nor-NOHA or L-arginine were added into the co-culture of TCR-activated T cells and MDSC on day 1 and day 3. Blue Panel, Cell-free culture medium of MDSC does not confer inhibitory capacity toward T cells. MDSC were cultured in the absence or the presence of IL-4 and IL-6, or TCR-activated T cells-conditioned medium to induce arginase-1 expression for two days. The cell-free supernatants collected were then added (50% of the volume) into CD3/CD28 ligation-induced T cell proliferation system to assess inhibitory effects. C) Statistical data of B. Data are presented as mean ± SEM (n ≥ 5). ***, p ≤ 0.001. D) Confirmation of arginase-1 expression in MDSC used in B. E) MDSC and splenocytes in which T cell proliferation was induced by CD3/CD28 ligation were placed in the upper and the lower chamber, respectively, of a transwell device with filters (0.4 μm diameter pore), thereby physically separating the cells, but not the medium. After co-culturing for 4 days, the upper chamber MDSC and the lower chamber T cells were analyzed for arginase-1 expression and T cell proliferation, respectively. F) The ability of PD-L1 blockade and deficiency of SIRPα in SIRPα−/− MDSC to diminish T cell proliferation was assayed using CFSE dilution as readout. Demonstrated data throughout this figure are all representative of at least five independent experiments each.
Moreover, we observed that MDSC-mediated inhibition required direct cell contact. We tested the cell contact effect by placing MDSC and T cells in separate transwell chambers, depicted in Fig. 6E, which hindered cell contact while allowing medium sharing (0.4 μm filter). As shown, this device disabled the MDSC capacity to inhibit TCR-activated T cell proliferation; yet, these settings did not diminish arginase-1 induction, thereby confirming diffusible factors were shared between the two chambers. These results thus ruled out that MDSC produce factors or exosomes through which inhibit T cells, while also supporting our conclusion that arginase-1 expression is irrelevant to this inhibition.
Considering that cell contact mediates MDSC inhibition toward activated T cells, we tested PD-L1 blockade and SIRPα deficiency in MDSC inhibitory assays. However, both conditions failed to mitigate MDSC-mediated inhibition (Fig. 6F). Therefore, the mechanism(s) by which MDSC inhibit T cells require further investigation.
Discussion
MDSC are characterized by an important immunosuppressive mechanism that, through suppressing immune cell antitumor immunity, promotes tumor progression. As shown in our studies, as well as studies by others, mice with progressive tumors are associated with an extensive expansion of MDSC in the bone marrow, the primary hematopoietic area supplying myeloid lineage leukocytes to the circulation and tissues including the TME. One signature characteristic of MDSC is the capability to directly inhibit activated T lymphocyte proliferation. This is corroborated by our assays showing that MDSC isolated from the bone marrow of tumor-bearing mice potently inhibit T cell proliferation induced by various mechanisms, such as TCR ligation, non-specific stimulation by ConA, activation of PKC, or the T cell ‘growth factor’ IL-2.
The mechanism by which MDSC inhibit activated T cells remains unclear, though previous studies have been suggesting that MDSC-expressed arginase (arginase-1) plays an essential role. Through depleting L-arginine, the activity of arginase-1 is thought to jeopardize the TCR response and T cell proliferation [45, 46]. However, in our studies of bone marrow myelopoiesis in tumor progressive mice, arginase-1 expression was not found in the expanded population of bone marrow-derived MDSC albeit demonstrating the capability to potently inhibit T cell proliferation.
In fact, we found that arginase-1 is not constitutively expressed in MDSC but rather is induced by the presence of activating T cells. At least two axes of cytokine-induced responses lead to arginase-1 expression: one is the IL-6-IL-4 axis, in which IL-6 induces IL-4R expression on MDSC, enabling IL-4 to induce arginase-1 expression; the second axis involves GM-CSF and IL-10, in which GM-CSF induces IL-10R thereby allowing IL-10 signaling to induce arginase-1 expression. Neither IL-4 nor IL-10 directly induce arginase-1, due to the fact that MDSC freshly produced from the bone marrow express no IL-4R or IL-10R on the surface but are liable to be induced by IL-6 or GM-CSF, respectively. Herein, we show that IL-6 signaling induces IL-4R and GM-CSF induces IL-10R. Furthermore, it appears to be that the role of GM-CSF is multifaceted; in addition to facilitating IL-10R induction, GM-CSF increases IL-6R expression and thus bolsters the signaling strength of the IL-6-IL-4 axis. Meanwhile, the same signaling events mediated by IL-4R are also found to promote IL-10R expression, further enhancing arginase-1 expression via IL-10-mediated induction. It is worth noting that some of our data agree with previous reports, showing that cytokines such as IL-4 and IL-10 are essential for arginase-1 expression [38, 39]. IL-4-mediated induction of arginase-1 expression is also commonly seen in macrophages with the M2 phenotype [24]. In our studies, we found that these cocktails of cytokines that induce arginase-1 expression are produced by TCR-activated T cells, but are absent from T cells activated by other mechanisms such as ConA, PMA plus ionomycin and IL-2. However, given the relatively promiscuous nature of cytokine-elicited signaling pathways, it is perceivable that some other cytokines, and/or their combinations with other factors – especially in complex tissue environments such as the TME – would be capable of inducing arginase-1 expression in MDSC. Despite that tumor released factors have been shown to induce arginase-1 expression in tumor infiltrating MDSC [28], we did not detect arginase-1 induction in MDSC by cell culture supernatants collected from B16 melanoma, EL4 lymphoma or M38 colonic carcinoma cells. One explanation for this discrepancy could be that tumor-associated leukocytes such as T cells and macrophages, but not tumor cells per se, produce diffusible cytokines and through which induce arginase-1 expression in MDSC. We also found that two other cytokines, IL-17 and IFNγ, negatively regulate arginase-1 expression. In particular, depletion of IFNγ or IL-17 in TCR-activated T cell medium resulted in an increase of arginase-1 induction in MDSC, while the presence of IFNγ and IL-17 in cytokine cocktails generally suppressed IL-4/IL-6 or GM-CSF/IL-10-induced arginase-1 expression.
Unexpectedly, our results revealed that MDSC inhibit T cells independent of arginase-1 activity. This finding is in agreement with recent report by Deshane et al. [47] that Ly-6C+Ly-6G+ MDSC suppressed T cell immune responses in an arginase-independent fashion. As shown in our study, T cells activated to proliferate by different mechanisms including TCR ligation, ConA, PMA/ionomycin and IL-2 were all completely inhibited in the presence of bone marrow-derived MDSC, in which no arginase-1 was expressed, especially in the latter three mechanisms. Even for T cells activated through TCR ligation, which later induced arginase-1 expression in co-incubated MDSC, inhibition of arginase activity and supplement with L-arginine amino acids was determined to be inadequate in relinquishing the inhibition. The fact that MDSC inhibit T cell proliferation in the absence of arginase activity suggests that other mechanism(s), instead of depleting L-arginine, were taking place and mediated MDSC inhibition toward T cells. Supporting this notion, we found that direct cell contact is necessary for T cell suppression by MDSC given that separation of MDSC from activated T cells by transfilters, which block physical cell contact but not diffusion of secreted factors, completely eliminated MDSC inhibition of T cell proliferation. Furthermore, experiments in this setting ruled out MDSC-released cytokines, factors, or exosomes being part of the inhibitory mechanism. These results thus suggest that MDSC-mediated inhibition toward T cells is contingent upon their ability to establish direct cell contact and not through depletion of L-arginine by arginase-1 activity. This result is in line with the previous finding by Crook and co-workers that inhibitory capacity of MDSC, particularly monocytic MDSC, is dependent on the production of NO and PGE2 and required cell-cell contact [48]. Considering these results, we postulated that cell surface protein interactions that serve as negative regulators of immunity, such as PD-L1 and SIRPα, might play a role. PD-L1 [49] and SIRPα [50] are such regulators expressed on MDSC or tumor-associated macrophages (TAM) and have been shown to contribute to the suppression of T cells by MDSC or TAM. Therefore, antibody blockade of PD-L1 and SIRPα-deficient mice were used to determine if their involvement in MDSC-mediated inhibition on T cell proliferation. However, these experiments were fruitless and concluded that neither PD-L1 nor SIRPα were involved in this direct cell contact-dependent MDSC-mediated inhibition of T cells. Clearly, further studies are needed to investigate the remaining question regarding the role of arginase-1 MDSC function, if not for mediating the inhibition of T cells.
Material and Methods
Murine tumor models
Adult C57BL/6J mice (6–8 week), age and sex matched, were engrafted with EL4 lymphoma, B16 melanoma, or MC38 colon carcinoma by subcutaneously (s. c) injecting 2 × 10⁵ cells for each type in 100 μl of sterile PBS into the right flank. Generally, tumors were allowed to grow for over 21 days to achieve 300–500 mm3 mass before performing further procedures. All tumor cells were initially obtained from American Type Culture Collection (ATCC) and were maintained in DMEM or RPMI 1640 supplemented with 10% FBS, 2 mM L-Glutamine, 100 U/mL penicillin, and 100 μg/mL streptomycin at 37 °C with 5% CO2.
MDSC isolation from bone marrow
Bone marrow cells were harvested from the femur and tibia by flushing bone cavities with ice-cold PBS. After RBC lysis and centrifugation collection, the bone marrow cells were applied to discontinuous Percoll density gradients consisting of four sequentially decreased density layers from the bottom to the top: 70% (1.088 g/ml), 60% (1.076 g/ml), 50% (1.064 g/ml), 40% (1.052 g/ml) and 5% (1.012 g/ml). Four-layer discontinuous density gradients were prepared by adding one layer (2 ml/layer) upon another starting with the 70 % layer at the bottom in a 15 mL tube, using a syringe fitted with a 22G needle. Approx. 5 x 10⁷ bone marrow leukocytes were suspended in 1 ml HBSS and then placed on top of the gradients using a syringe with a 22G needle, followed by centrifugation at 1000x g for 45 min in a swinging bucket rotor. After the centrifugation, the cells were separated into 4 different fractions. Cells in fraction III (Fr. III) and fraction IV (Fr. IV) were collected, analyzed by FACS and used for functional assay. If not specifically stated, bone marrow MDSCs were collected from B16-bearing mice. In some experiments, G-MDSC and M-MDSC in Fr. III were further purified by positive selection using EasySep™ Mouse PE Positive Selection Kit (STEMCELL Technologies) in combination with PE-conjugated anti-Ly6G and PE-conjugated anti-Ly6C antibodies (Biolegend), according to the manufacturer’s instruction. Briefly, Fr III cells were first incubated with anti-CD16/CD32 blocking antibody (2.4G2) for 5 minutes at room temperature, and stained with PE-conjugated anti-Ly6G antibody, followed by positive selection for Ly6G+ G-MDSC using EasySep™ Mouse PE Positive Selection Kit. The Ly6G−Ly6C+ M-MDSC, which remained in the unlabeled cells flow through, were further isolated by labeling with PE-conjugated anti-Ly6C antibody followed by positive selection using EasySep™ Mouse PE Positive Selection Kit. To isolate cells from tumor tissues or the spleen, tumor tissues or spleen were ground-up and digested with collagenase D (400 U/ml) at 37°C (45 min) in HBSS with agitation, followed by filtration through nylon mesh with a pore size diameter of 70 μm, and collected in ice-cold RPMI 1640; CD11b+ cells were isolated from the spleen of tumor-bearing mice by cell sorting with a FACSAria cell sorter (BD Biosciences). The final purity of cells achieved was > 95% as determined by fluorescence microscopy and FACS.
T cell proliferation and MDSC inhibition assay
Carboxyfluorescein diacetate succinimidyl ester (CFSE) was used to label splenocytes following their isolation from mice. In some experiments, splenic T cells were further purified using EasySep™ Mouse T Cell Isolation Kit (STEMCELL Technologies) according to the manufacturer’s protocol. Labeled splenocytes (6 × 10⁵) or purified T cells (2 ×10⁵) were plated in a 96-well plate pre-coated with anti-CD3 (1 μg/ml, clone 145-2C11, Biolegend) in the presence of soluble anti-CD28 (0.5 μg/ml, clone 37.51, Biolegend) in RPMI 1640 with 10% FBS for 4 days (37°C, 5% CO2). For Concanavalin A (ConA), PMA/Ionomycin, or IL-2-induced T cell proliferation, CFSE labeled splenocytes or purified T cells were treated with 1 μg/mL ConA, 20 ng/ml PMA/60 ng/ml ionomycin or 1000 IU/ml IL-2, respectively, in RPMI 1640 with 10 % FBS for 4 days (37°C, 5% CO2). T cell proliferation induced by different stimulations was confirmed by observing cell number increases under the microscope. The percentage of proliferating T cells was further assessed by FACS determination of CFSE dilution. To evaluate myeloid cells’ inhibitory effect, Fr. III or IV myeloid cells isolated from the bone marrow of tumor-bearing mice were co-cultured with T cells by directly adding them into the T cell proliferation system at ratios from 1:9-1:3 to splenocytes or 1:1 to T cells. To test whether myeloid cells’ inhibitory effect in T cell proliferation requires physical contact, MDSC and splenocytes in which T cell proliferation was induced by CD3/CD28 ligation were physically separated by placing MDSC (2 × 10⁵) in the upper chamber, while splenocytes (6 × 10⁵) were placed in the lower chamber of a transwell device with filters (0.4 μm diameter pore). Myeloid cells and T cells were co-cultured for 4 days, followed by determining T cell proliferation as described above. To test whether MDSC inhibit T cell proliferation through the inhibitory regulator PD-L1, MDSC were co-cultured with CD3/CD28 ligated T cells in the presence of blocking antibodies against PD-L1 (10F.9G2, 20 μg/ml) for 4 days, followed by determining T cell proliferation as described above. To test whether MDSC inhibit T cell proliferation through the inhibitory regulator SIRPα, MDSC from SIRPα−/− tumor bearing mice [29] were co-cultured with CD3/CD28 ligated T cells for 4 days, followed by determining T cell proliferation as described above. In some experiments, MDSC were cultured in the absence or the presence of IL-4 and IL-6 (50 ng/ml each), or TCR-activated T cells-conditioned medium to induce arginase-1 expression for two days. Cell-free supernatants were then collected and added (50% of the volume) into CD3/CD28 ligation-induced T cell proliferation system to determine inhibitory effects.
Cytokine determination and treatments
Supernatants from various T cell proliferation cultures were collected on day 1 and day 2. Cytokines within the supernatants, including IL-4, IL-6, IL-1β, IL-10, IL-12p70, IL-17, TNFα, IFNγ, IFNβ and GM-CSF were quantified using LEGENDplex™ kits according to the manufacturer’s instructions. The data were collected on BD LSR Fortessa (BD Biosciences) and analyzed using LEGENDplex™ software version 7.0 (Biolegend). To test which cytokine(s) were involved in inducing arginase-1 expression in MDSC, Fr. III MDSC isolated from the bone marrow of tumor-bearing mice were cultured in RPMI 1640 medium and treated with cell culture supernatants from CD3/CD28 ligated T cells (50% of the volume) for 18h, in the presence of blocking antibodies against IL-4, IL-6, IL-10, IL-17, IFNγ and GM-CSF alone or in different combinations (20 μg/ml for each antibody). To induce arginase-1 expression, MDSC were treated with IL-4, IL-6, GM-CSF and IL-10 alone or in different combinations for 18 h (50 ng/ml each). After treatment, MDSC were lysed and tested for arginase-1 expression by western blot (WB).
WB detecting arginase-1
Freshly isolated bone marrow-derived MDSC from Percoll gradients were lysed in the presence of protease inhibitors (Sigma, Product Code: P8340) and 10 mM PMSF in a buffer containing: 100 mM Tris (pH7.5), 150 mM NaCl, and 1% Triton X-100. The same condition was also used to lyse the M2 phenotype-skewed macrophages [30] and CD11b myeloid cells isolated from tumor mass and spleen [6]. M2 macrophages were generated by treating BM cells with M-CSF (20 ng/ml) for 5 days, followed by overnight treatment with IL-4 (20 ng/ml). In other experiments, freshly isolated MDSC were co-cultured with splenocytes in the presence of T cell activation reagents or treated with the cell-free medium collected from various T cell proliferation cultures, or treated with different cytokines, for varied time periods prior to cell lysis. The cell lysates were applied to SDS-PAGE with a 10% acrylamide gel and were then transferred to nitrocellulose. After blocking with 5% nonfat milk, the membrane was incubated with an anti-mouse arginase-1 mAb (clone H-52, Santa Cruz Biotechology), washed, and then an HRP-conjugated secondary antibody, followed by ECL detection. The cell lysate loading was controlled by WB detection of β-actin using an anti-β-actin antibody (Sigma).
Arginase-1 blockade and L-arginine supplementation
MDSC were co-cultured with CD3/CD28 activated splenocytes for 4 days in the presence of Arginase-1 inhibitor Nω-hydroxy-nor-Arginine (nor-NOHA) (Cayman Chemical, 300μM) or neutralization antibodies against IL-4, IL-6, IL-10 and GM-CSF (20 μg/ml each) to suppress arginase-1 function or expression in MDSC, followed by T cell proliferation assay as described above. To supplement L-arginine in the co-culture system, cell culture medium was replenished with excess L-arginine (10 mM, Sigma) on day 1 and day 3 and then assayed for T cell proliferation as described.
Inducing cytokine receptors on MDSC
To induce IL-4 receptor (IL-4R) expression on MDSC, freshly isolated MDSC were treated with GM-CSF, IL-6 alone or GM-CSF + IL-6 (50ng/ml each) or cell-free medium obtained from CD3/CD28 CD3/CD28 activated T cells for 18h. To enhance IL-6 receptor (IL-6R) expression on M-MDSC, freshly isolated MDSC were treated with GM-CSF (50 ng/ml) for 18h. To induce IL-10 receptor (IL-10R) on MDSC, freshly isolated MDSC were treated with GM-CSF, IL-6, IL-4 + IL-6 (50ng/ml each) or cell-free medium obtained from CD3/CD28 activated T cells for 18h. Expression of IL-4R, IL-6R and IL-10R on MDSC were analyzed by FACS.
Flow cytometry analysis of cytokine receptors on MDSC
FACS analysis was performed on the leukocytes following their separation by Percoll or cytokine treatments. Freshly isolated or treated MDSC were washed once in PBS, incubated with anti-CD16/CD32 blocking antibody (2.4G2) for 5 minutes at room temperature, and stained with diluted fluor-conjugated antibody mixtures. Fluor-conjugated monoclonal antibodies including Ly6G (1A8), Ly6C (HK1.4), CD11b (M1/70), IL-4R (I015F8), IL-6R (D7715A7) and IL-10R (1B1.3a) were purchased from Biolegend. Samples were acquired on a BD LSR Fortessa instrument (BD Biosciences). Data analysis was performed using FlowJo software.
Statistical analysis
Data are presented as the mean ± SEM. Statistical differences/significance between data were assessed by the two-tailed Student’s t-test for two groups or one-way ANOVA followed by Dunnett’s Multiple Comparison test.
Supplementary Material
Acknowledgments
This work was supported, in part, by a grant from National Institutes of Health (AI106839) and a research scholar grant from the American Cancer Society.
Footnotes
Conflict of interest
The authors declare no financial or commercial conflict of interest.
References
- 1.Corzo CA, Cotter MJ, Cheng P, Cheng F, Kusmartsev S, Sotomayor E, Padhya T, McCaffrey TV, McCaffrey JC, Gabrilovich DI. Mechanism regulating reactive oxygen species in tumor-induced myeloid-derived suppressor cells. J Immunol. 2009;182:5693–5701. doi: 10.4049/jimmunol.0900092. [DOI] [PMC free article] [PubMed] [Google Scholar]
- 2.Bronte V, Apolloni E, Cabrelle A, Ronca R, Serafini P, Zamboni P, Restifo NP, Zanovello P. Identification of a CD11b(+)/Gr-1(+)/CD31(+) myeloid progenitor capable of activating or suppressing CD8(+) T cells. Blood. 2000;96:3838–3846. [PMC free article] [PubMed] [Google Scholar]
- 3.Diaz-Montero CM, Salem ML, Nishimura MI, Garrett-Mayer E, Cole DJ, Montero AJ. Increased circulating myeloid-derived suppressor cells correlate with clinical cancer stage, metastatic tumor burden, and doxorubicin-cyclophosphamide chemotherapy. Cancer Immunol Immunother. 2009;58:49–59. doi: 10.1007/s00262-008-0523-4. [DOI] [PMC free article] [PubMed] [Google Scholar]
- 4.Kusmartsev S, Nefedova Y, Yoder D, Gabrilovich DI. Antigen-specific inhibition of CD8+ T cell response by immature myeloid cells in cancer is mediated by reactive oxygen species. J Immunol. 2004;172:989–999. doi: 10.4049/jimmunol.172.2.989. [DOI] [PubMed] [Google Scholar]
- 5.Gabrilovich DI, Nagaraj S. Myeloid-derived suppressor cells as regulators of the immune system. Nat Rev Immunol. 2009;9:162–174. doi: 10.1038/nri2506. [DOI] [PMC free article] [PubMed] [Google Scholar]
- 6.Youn JI, Nagaraj S, Collazo M, Gabrilovich DI. Subsets of myeloid-derived suppressor cells in tumor-bearing mice. J Immunol. 2008;181:5791–5802. doi: 10.4049/jimmunol.181.8.5791. [DOI] [PMC free article] [PubMed] [Google Scholar]
- 7.Gabrilovich DI, Ostrand-Rosenberg S, Bronte V. Coordinated regulation of myeloid cells by tumours. Nature Reviews Immunology. 2012;12:253–268. doi: 10.1038/nri3175. [DOI] [PMC free article] [PubMed] [Google Scholar]
- 8.Rodriguez PC, Ochoa AC, Al-Khami AA. Arginine Metabolism in Myeloid Cells Shapes Innate and Adaptive Immunity. Front Immunol. 2017;8:93. doi: 10.3389/fimmu.2017.00093. [DOI] [PMC free article] [PubMed] [Google Scholar]
- 9.Munder M, Choi BS, Rogers M, Kropf P. L-arginine deprivation impairs Leishmania major-specific T-cell responses. Eur J Immunol. 2009;39:2161–2172. doi: 10.1002/eji.200839041. [DOI] [PMC free article] [PubMed] [Google Scholar]
- 10.Dunand-Sauthier I, Irla M, Carnesecchi S, Seguin-Estevez Q, Vejnar CE, Zdobnov EM, Santiago-Raber ML, Reith W. Repression of arginase-2 expression in dendritic cells by microRNA-155 is critical for promoting T cell proliferation. J Immunol. 2014;193:1690–1700. doi: 10.4049/jimmunol.1301913. [DOI] [PubMed] [Google Scholar]
- 11.Popovic PJ, Zeh HJ, 3rd, Ochoa JB. Arginine and immunity. J Nutr. 2007;137:1681S–1686S. doi: 10.1093/jn/137.6.1681S. [DOI] [PubMed] [Google Scholar]
- 12.Bronte V, Zanovello P. Regulation of immune responses by L- arginine metabolism. Nature Reviews Immunology. 2005;5:641–654. doi: 10.1038/nri1668. [DOI] [PubMed] [Google Scholar]
- 13.Serafini P, Borrello I, Bronte V. Myeloid suppressor cells in cancer: recruitment, phenotype, properties, and mechanisms of immune suppression. Semin Cancer Biol. 2006;16:53–65. doi: 10.1016/j.semcancer.2005.07.005. [DOI] [PubMed] [Google Scholar]
- 14.Polat MF, Taysi S, Polat S, Boyuk A, Bakan E. Elevated serum arginase activity levels in patients with breast cancer. Surg Today. 2003;33:655–661. doi: 10.1007/s00595-002-2563-2. [DOI] [PubMed] [Google Scholar]
- 15.Gokmen SS, Aygit AC, Ayhan MS, Yorulmaz F, Gulen S. Significance of arginase and ornithine in malignant tumors of the human skin. J Lab Clin Med. 2001;137:340–344. doi: 10.1067/mlc.2001.114543. [DOI] [PubMed] [Google Scholar]
- 16.Munder M, Schneider H, Luckner C, Giese T, Langhans CD, Fuentes JM, Kropf P, Mueller I, Kolb A, Modolell M, Ho AD. Suppression of T-cell functions by human granulocyte arginase. Blood. 2006;108:1627–1634. doi: 10.1182/blood-2006-11-010389. [DOI] [PubMed] [Google Scholar]
- 17.Highfill SL, Rodriguez PC, Zhou Q, Goetz CA, Koehn BH, Veenstra R, Taylor PA, Panoskaltsis-Mortari A, Serody JS, Munn DH, Tolar J, Ochoa AC, Blazar BR. Bone marrow myeloid-derived suppressor cells (MDSCs) inhibit graft-versus-host disease (GVHD) via an arginase-1-dependent mechanism that is up-regulated by interleukin-13. Blood. 2010;116:5738–5747. doi: 10.1182/blood-2010-06-287839. [DOI] [PMC free article] [PubMed] [Google Scholar]
- 18.Ochoa AC, Zea AH, Hernandez C, Rodriguez PC. Arginase, prostaglandins, and myeloid-derived suppressor cells in renal cell carcinoma. Clin Cancer Res. 2007;13:721s–726s. doi: 10.1158/1078-0432.CCR-06-2197. [DOI] [PubMed] [Google Scholar]
- 19.Slaney CY, Toker A, La Flamme A, Backstrom BT, Harper JL. Naive blood monocytes suppress T-cell function. A possible mechanism for protection from autoimmunity. Immunol Cell Biol. 2011;89:7–13. doi: 10.1038/icb.2010.110. [DOI] [PubMed] [Google Scholar]
- 20.Green KA, Cook WJ, Green WR. Myeloid-derived suppressor cells in murine retrovirus-induced AIDS inhibit T- and B-cell responses in vitro that are used to define the immunodeficiency. J Virol. 2013;87:2058–2071. doi: 10.1128/JVI.01547-12. [DOI] [PMC free article] [PubMed] [Google Scholar]
- 21.Yao L, Abe M, Kawasaki K, Akbar SM, Matsuura B, Onji M, Hiasa Y. Characterization of Liver Monocytic Myeloid-Derived Suppressor Cells and Their Role in a Murine Model of Non-Alcoholic Fatty Liver Disease. PLoS One. 2016;11:e0149948. doi: 10.1371/journal.pone.0149948. [DOI] [PMC free article] [PubMed] [Google Scholar]
- 22.Rutschman R, Lang R, Hesse M, Ihle JN, Wynn TA, Murray PJ. Cutting edge: Stat6-dependent substrate depletion regulates nitric oxide production. J Immunol. 2001;166:2173–2177. doi: 10.4049/jimmunol.166.4.2173. [DOI] [PubMed] [Google Scholar]
- 23.Munder M, Eichmann K, Moran JM, Centeno F, Soler G, Modolell M. Th1/Th2-regulated expression of arginase isoforms in murine macrophages and dendritic cells. J Immunol. 1999;163:3771–3777. [PubMed] [Google Scholar]
- 24.Bronte V, Cingarlini S, Apolloni E, Serafini P, Marigo I, De Santo C, Macino B, Marin O, Zanovello P. Effective genetic vaccination with a widely shared endogenous retroviral tumor antigen requires CD40 stimulation during tumor rejection phase. J Immunol. 2003;171:6396–6405. doi: 10.4049/jimmunol.171.12.6396. [DOI] [PubMed] [Google Scholar]
- 25.Sinha P, Clements VK, Ostrand-Rosenberg S. Interleukin-13-regulated M2 macrophages in combination with myeloid suppressor cells block immune surveillance against metastasis. Cancer Res. 2005;65:11743–11751. doi: 10.1158/0008-5472.CAN-05-0045. [DOI] [PubMed] [Google Scholar]
- 26.Sinha P, Parker KH, Horn L, Ostrand-Rosenberg S. Tumor-induced myeloid-derived suppressor cell function is independent of IFN-gamma and IL-4Ralpha. Eur J Immunol. 2012;42:2052–2059. doi: 10.1002/eji.201142230. [DOI] [PMC free article] [PubMed] [Google Scholar]
- 27.Gallina G, Dolcetti L, Serafini P, De Santo C, Marigo I, Colombo MP, Basso G, Brombacher F, Borrello I, Zanovello P, Bicciato S, Bronte V. Tumors induce a subset of inflammatory monocytes with immunosuppressive activity on CD8+ T cells. J Clin Invest. 2006;116:2777–2790. doi: 10.1172/JCI28828. [DOI] [PMC free article] [PubMed] [Google Scholar]
- 28.Rodriguez PC, Hernandez CP, Quiceno D, Dubinett SM, Zabaleta J, Ochoa JB, Gilbert J, Ochoa AC. Arginase I in myeloid suppressor cells is induced by COX-2 in lung carcinoma. J Exp Med. 2005;202:931–939. doi: 10.1084/jem.20050715. [DOI] [PMC free article] [PubMed] [Google Scholar]
- 29.Bian Z, Shi L, Guo YL, Lv Z, Tang C, Niu S, Tremblay A, Venkataramani M, Culpepper C, Li L, Zhou Z, Mansour A, Zhang Y, Gewirtz A, Kidder K, Zen K, Liu Y. Cd47-Sirpalpha interaction and IL-10 constrain inflammation-induced macrophage phagocytosis of healthy self-cells. Proc Natl Acad Sci U S A. 2016;113:E5434–5443. doi: 10.1073/pnas.1521069113. [DOI] [PMC free article] [PubMed] [Google Scholar]
- 30.Mosser DM, Zhang X. Activation of murine macrophages. Curr Protoc Immunol. 2008;Chapter 14(Unit 14):12. doi: 10.1002/0471142735.im1402s83. [DOI] [PMC free article] [PubMed] [Google Scholar]
- 31.Mueller DL, Jenkins MK, Schwartz RH. Clonal expansion versus functional clonal inactivation: a costimulatory signalling pathway determines the outcome of T cell antigen receptor occupancy. Annu Rev Immunol. 1989;7:445–480. doi: 10.1146/annurev.iy.07.040189.002305. [DOI] [PubMed] [Google Scholar]
- 32.Agata Y, Kawasaki A, Nishimura H, Ishida Y, Tsubata T, Yagita H, Honjo T. Expression of the PD-1 antigen on the surface of stimulated mouse T and B lymphocytes. Int Immunol. 1996;8:765–772. doi: 10.1093/intimm/8.5.765. [DOI] [PubMed] [Google Scholar]
- 33.Smith KA. Interleukin-2: inception, impact, and implications. Science. 1988;240:1169–1176. doi: 10.1126/science.3131876. [DOI] [PubMed] [Google Scholar]
- 34.Boyman O, Kovar M, Rubinstein MP, Surh CD, Sprent J. Selective stimulation of T cell subsets with antibody-cytokine immune complexes. Science. 2006;311:1924–1927. doi: 10.1126/science.1122927. [DOI] [PubMed] [Google Scholar]
- 35.Kohanbash G, McKaveney K, Sakaki M, Ueda R, Mintz AH, Amankulor N, Fujita M, Ohlfest JR, Okada H. GM-CSF promotes the immunosuppressive activity of glioma-infiltrating myeloid cells through interleukin-4 receptor-alpha. Cancer Res. 2013;73:6413–6423. doi: 10.1158/0008-5472.CAN-12-4124. [DOI] [PMC free article] [PubMed] [Google Scholar]
- 36.Youn JI, Gabrilovich DI. The biology of myeloid-derived suppressor cells: the blessing and the curse of morphological and functional heterogeneity. Eur J Immunol. 2010;40:2969–2975. doi: 10.1002/eji.201040895. [DOI] [PMC free article] [PubMed] [Google Scholar]
- 37.Hoechst B, Ormandy LA, Ballmaier M, Lehner F, Kruger C, Manns MP, Greten TF, Korangy F. A new population of myeloid-derived suppressor cells in hepatocellular carcinoma patients induces CD4(+)CD25(+)Foxp3(+) T cells. Gastroenterology. 2008;135:234–243. doi: 10.1053/j.gastro.2008.03.020. [DOI] [PubMed] [Google Scholar]
- 38.Corraliza IM, Soler G, Eichmann K, Modolell M. Arginase induction by suppressors of nitric oxide synthesis (IL-4, IL-10 and PGE2) in murine bone-marrow-derived macrophages. Biochem Biophys Res Commun. 1995;206:667–673. doi: 10.1006/bbrc.1995.1094. [DOI] [PubMed] [Google Scholar]
- 39.Wei LH, Jacobs AT, Morris SM, Jr, Ignarro LJ. IL-4 and IL-13 upregulate arginase I expression by cAMP and JAK/STAT6 pathways in vascular smooth muscle cells. Am J Physiol Cell Physiol. 2000;279:C248–256. doi: 10.1152/ajpcell.2000.279.1.C248. [DOI] [PubMed] [Google Scholar]
- 40.Vilas-Boas W, Cerqueira BA, Zanette AM, Reis MG, Barral-Netto M, Goncalves MS. Arginase levels and their association with Th17-related cytokines, soluble adhesion molecules (sICAM-1 and sVCAM-1) and hemolysis markers among steady-state sickle cell anemia patients. Ann Hematol. 2010;89:877–882. doi: 10.1007/s00277-010-0954-9. [DOI] [PMC free article] [PubMed] [Google Scholar]
- 41.Rose-John S. IL-6 trans-signaling via the soluble IL-6 receptor: importance for the pro-inflammatory activities of IL-6. Int J Biol Sci. 2012;8:1237–1247. doi: 10.7150/ijbs.4989. [DOI] [PMC free article] [PubMed] [Google Scholar]
- 42.Romano M, Sironi M, Toniatti C, Polentarutti N, Fruscella P, Ghezzi P, Faggioni R, Luini W, van Hinsbergh V, Sozzani S, Bussolino F, Poli V, Ciliberto G, Mantovani A. Role of IL-6 and its soluble receptor in induction of chemokines and leukocyte recruitment. Immunity. 1997;6:315–325. doi: 10.1016/s1074-7613(00)80334-9. [DOI] [PubMed] [Google Scholar]
- 43.Kyrtsonis MC, Dedoussis G, Zervas C, Perifanis V, Baxevanis C, Stamatelou M, Maniatis A. Soluble interleukin-6 receptor (sIL-6R), a new prognostic factor in multiple myeloma. Br J Haematol. 1996;93:398–400. doi: 10.1046/j.1365-2141.1996.4721018.x. [DOI] [PubMed] [Google Scholar]
- 44.Robak T, Wierzbowska A, Blasinska-Morawiec M, Korycka A, Blonski JZ. Serum levels of IL-6 type cytokines and soluble IL-6 receptors in active B-cell chronic lymphocytic leukemia and in cladribine induced remission. Mediators Inflamm. 1999;8:277–286. doi: 10.1080/09629359990289. [DOI] [PMC free article] [PubMed] [Google Scholar]
- 45.Rodriguez PC, Quiceno DG, Zabaleta J, Ortiz B, Zea AH, Piazuelo MB, Delgado A, Correa P, Brayer J, Sotomayor EM, Antonia S, Ochoa JB, Ochoa AC. Arginase I production in the tumor microenvironment by mature myeloid cells inhibits T-cell receptor expression and antigen-specific T-cell responses. Cancer Res. 2004;64:5839–5849. doi: 10.1158/0008-5472.CAN-04-0465. [DOI] [PubMed] [Google Scholar]
- 46.Rodriguez PC, Zea AH, Culotta KS, Zabaleta J, Ochoa JB, Ochoa AC. Regulation of T cell receptor CD3zeta chain expression by L-arginine. J Biol Chem. 2002;277:21123–21129. doi: 10.1074/jbc.M110675200. [DOI] [PubMed] [Google Scholar]
- 47.Deshane J, Zmijewski JW, Luther R, Gaggar A, Deshane R, Lai JF, Xu X, Spell M, Estell K, Weaver CT, Abraham E, Schwiebert LM, Chaplin DD. Free radical-producing myeloid-derived regulatory cells: potent activators and suppressors of lung inflammation and airway hyperresponsiveness. Mucosal Immunol. 2011;4:503–518. doi: 10.1038/mi.2011.16. [DOI] [PMC free article] [PubMed] [Google Scholar]
- 48.Crook KR, Jin M, Weeks MF, Rampersad RR, Baldi RM, Glekas AS, Shen Y, Esserman DA, Little P, Schwartz TA, Liu P. Myeloid-derived suppressor cells regulate T cell and B cell responses during autoimmune disease. J Leukoc Biol. 2015;97:573–582. doi: 10.1189/jlb.4A0314-139R. [DOI] [PMC free article] [PubMed] [Google Scholar]
- 49.Noman MZ, Desantis G, Janji B, Hasmim M, Karray S, Dessen P, Bronte V, Chouaib S. PD-L1 is a novel direct target of HIF-1alpha, and its blockade under hypoxia enhanced MDSC-mediated T cell activation. J Exp Med. 2014;211:781–790. doi: 10.1084/jem.20131916. [DOI] [PMC free article] [PubMed] [Google Scholar]
- 50.Pan YF, Tan YX, Wang M, Zhang J, Zhang B, Yang C, Ding ZW, Dong LW, Wang HY. Signal regulatory protein alpha is associated with tumor-polarized macrophages phenotype switch and plays a pivotal role in tumor progression. Hepatology. 2013;58:680–691. doi: 10.1002/hep.26391. [DOI] [PubMed] [Google Scholar]
Associated Data
This section collects any data citations, data availability statements, or supplementary materials included in this article.