Abstract
Porous membranes enable the partitioning of cellular microenvironments in vitro, while still allowing physical and biochemical crosstalk between cells, a feature that is often necessary for recapitulating physiological functions. This article provides an overview of the different membranes used in tissue barrier and cellular co-culture models with a focus on experimental design and control of these systems. Specifically, we discuss how the structural, mechanical, chemical, and even the optical and transport properties of different membranes bestow specific advantages and disadvantages through the context of physiological relevance. This review also explores how membrane pore properties affect perfusion and solute permeability by developing an analytical framework to guide the design and use of tissue barrier or co-culture models. Ultimately, this review offers insight into the important aspects one must consider when using porous membranes in tissue barrier and lab-on-a-chip applications.
Graphical Abstrat
A tutorial review of different porous membranes utilized in tissue barrier and co-culture models with a focus on experimental design and control.
1 Introduction
Tissue-on-a-chip and cellular co-culture systems are important in advancing our understanding of disease progression, drug toxicity and efficacy, immune response, stem cell differentiation and our basic understanding of cell-cell communication. The importance of these systems is highlighted by recent efforts of U.S. National Institutes of Health (NIH), U.S. Food and Drug Administration (FDA), and Defense Advanced Research Projects Agency (DARPA) in funding the development of these systems as an alternative to animal models for drug screening.1–4 Many pharmaceutical companies have also partnered with leading research groups to explore the potential of these systems, as any associated success may save valuable time and resources.1–5
Porous semi-permeable membranes are integral components of any multi-compartment in vitro cellular system. They are necessary to create cellular or tissue interfaces and help establish barrier models with defined apical and basolateral surfaces. This is critical in the recapitulation of tissue barriers such as the gut epithelium, vasculature, lung, cornea and liver.6–13 While three-dimensional (3D) cell culture models may well-represent many types of tissue and their function, they have a number of limitations in studying transport and barrier properties.14 Membranes, in addition to creating a compartmentalized culture system, support cells in a consistent plane that simplifies imaging, which is critical for development of high-throughput screening assays.15,16 Cells cultured on opposing sides of a membrane are also more easily recovered than those cultured within a 3D hydrogel, an important consideration for stem differentiation and genomic readouts.14 Cells cultured in membrane-supported barrier models can also be easily adapted to microfluidic devices for exposure to physiological fluid shear stress or perfusion with drugs or other activating molecules.17–22 In the case of perfusion, polarized confluent cells on a porous membrane can receive unique inputs or perturbations on their apical and basolateral surfaces that accurately represent physiological events.7,10,23 Lastly, one of the primary motivations for using a porous culture substrate is to measure transport and secretion of small molecules or the transmigration of leukocytes or cancer cells in a metastasis model.
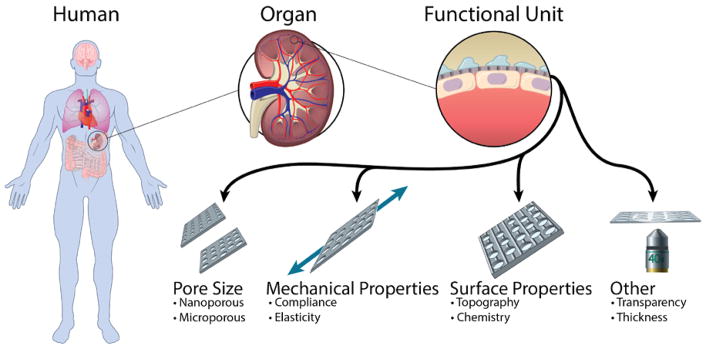
In selecting or designing a porous membrane for a barrier model or co-culture system, there are a number of considerations that can improve the physiological relevance and experimental control (Fig. 1). Naturally, the pore size is likely the most deliberated parameter as it can dictate whether cells can transmigrate, physically contact one another or be limited to biochemical communication. The pore size in combination with porosity and membrane thickness affect the permeability and transport of species from one compartment to the other. Membranes can be fabricated from a variety of materials including elastomers that facilitate physiological levels of strain.24–27 Surface modifications are used to aid in attachment or alignment of cells.28 In addition, other parameters such as optical transparency can enable high-resolution confocal microscopy of cells on both surfaces of the membrane.
Fig. 1.
Membrane considerations improve the physiological relevance and experimental control of tissue barrier and co-culture models to recapitulate the microenvironment and functionality of a target organ or tissue.
2 Pore size
Porous membranes commonly used in tissue barrier and co-culture models allow exchange of soluble factors between cell populations and in some cases even cell-cell physical contact (Table 1). The porous characteristics of the membranes enable the study of phenomena such as transmigration and permeability which are crucial in the study of immune response, cancer metastasis, and drug screening models. These membranes also provide mechanical support for the cells and establish a partition to define apical and basal compartments.
Table 1.
Summary of studies using membranes in tissue barrier and co-culture models where pore size was a critical parameter. PC (polycarbonate), PCL (poly(ε-caprolactone)), PDMS (polydimethylsiloxane), PE (polyester), SiN (Silicon nitride), SiO2 (silicon dioxide)
| Material | Commercially available? | Membrane attributes | Cell or tissue type | Goal of the study |
|---|---|---|---|---|
| Parylene | No – Lithography | 0.8 – 4.0 μm pores, 1 μm thick | Fibroblast co- culture | Fabrication of thin membranes allowing physical contact52 |
| PC | Yes – Corning transwell insert | 0.4 and 3.0 μm pores, 10 μm thick | Blood brain barrier | Cancer cell transendothelial migration46 |
| PC | Yes – Track etched - Sterlitech Corp | 8 μm pores, 7 μm thick most likely | Neurovasculature | Recapitulation of neurovascular functions |
| PC | Yes – Cut from transwell | 0.4 μm pores, 10 μm thick | Blood brain barrier | Microfluidic in vitro model54 |
| PCL | No – Uniaxial stretch + Laser perforation | 10 μm pores, 38 μm thick | Endothelium MSCs/HUVECs co- culture | Biomimicking of endothelial basement membrane50 |
| PDMS | No – Custom casting | 10 μm pores, 10 μm thick | Alveolar epithelium- endothelium | Reconstitution of lung function10 |
| PDMS | No – Custom casting | 10 μm pores, 6.5 μm thick | Ocular fundus | Investigation of choroidal angiogenesis11 |
| PDMS | No – Custom casting | 7 μm pores, 50 μm thick | Kidney glomerulus | Recapitulation of glomerular filtration23 |
| PE | Yes – Corning transwell insert | 0.4 μm pores, 10 μm thick most likely | Microvascular endothelium | Modelling the adhesion of metastatic breast cancer47 |
| Pnc-Si | No – Rapid phase transition | 0.003 – 0.08 μm pores, 0.015 μm thick | Vascular Endothelium | Investigate feasibility of nanomembrane-supported endothelial barrier model30 |
| SiN | No – Lithography | 0.27 – 0.7 μm pores, 1 μm thick | Blood brain barrier | Allowance of physical contact to improve tissue barrier51 |
| SiO2 | No – Lithography | 0.5 – 3.0 μm pores, 0.3 μm thick | HUVEC/ADSC co- culture | Fabrication of ultrathin membranes for cell culture32 |
| SiO2 | No – Lithography | 0.3 μm thick, 0.5 and 3.0 μm pores | Vasculature | Endothelial differentiation of ADSC and perivascular interaction55 |
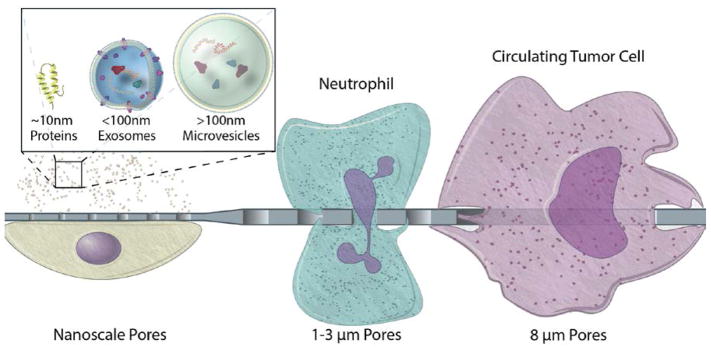
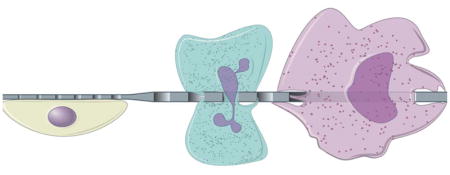
Thorough consideration regarding pore size selection is needed in order to successfully establish tissue barriers and co-culture models where cell populations are spatially confined and able to communicate. The latter can be best achieved by selecting a membrane of controlled pore size and porosity, thin enough to improve permeability without compromising its mechanical strength. Furthermore, the size of the pores has the potential of modulating the transit across the membrane based on the size and flexibility of different cells and bioparticles (Fig. 2).
Fig. 2.
Biologically relevant pore sizes in the micro and nano scale to modulate transmembrane transit of cells, vesicles, and proteins.
Polymeric track etched membranes are commercially available in multiwell plate culture inserts with pore sizes ranging from 400 nm to 8 μm, although additional pore sizes are also available as free-standing membrane filters. Their fabrication is based on irradiating a material to create tracks that are then etched to produce through pores. The porosity of these membranes remains inherently low due to the fact that higher porosity increases the incidence of merged tracks or doublet pores, which are undesirable. The random nature of the irradiation also leads to a regional variation of pore density. Polydimethylsiloxane (PDMS) membranes are fabricated through template-based soft lithography, which allows control over pore size and pore-to-pore spacing in the micrometer scale. However, PDMS-based membranes may not be ideal for drug screening studies due to their ability to absorb hydrophobic molecules such as drugs and markers commonly used in cell culture in vitro assays.14,29 Nevertheless, this absorption can be reduced with a thin coat of silicon oxide or titanium oxide.29 Inorganic membranes have also been integrated into microfluidic devices for tissue barrier and co-culture model systems, such as silicon-based materials30–32 and aluminum oxide.33,34 These inorganic membranes offer a wide range of pore sizes in the nanoscale and have been fabricated through top-down and bottom-up processes such as e-beam lithography, traditional lithography, irradiation, anodization, nanoimprint, self-organizing polymers, and self-assembling nanospheres.35 Finally, carbon based membranes remain a subject of research and development since they can easily achieve very small pores (< 5 nm).36–38 There is vast knowledge regarding the fabrication of porous membranes, with the existing processes ranging from complex and costly to simple and affordable.35,39,40 While these membranes most commonly exhibit circular pores, pentagonal10 and slit41 shaped pores have also been reported.
2.1 Pore sizes enabling transmigration
Multidisciplinary collaboration has been the key for the increasing progress made in tissue barrier and co-culture models. Migration of cells across barriers such as the endothelium is the underlying mechanism for immune response and cancer metastasis. The Boyden chamber is the classic in vitro model used to study chemotaxis, which consists of a chamber with a membrane bottom that is then inserted into a larger chamber to form two distinct compartments separated by a membrane.42 The Boyden chamber later became commercially available as membrane inserts (e.g. Corning Transwell® and the Greiner ThinCert™) that can be placed into multiwall plates, and subsequently improved upon translation into a microfluidic set-up43 to incorporate a flow-based gradient.17–22 A PDMS microporous membrane with 10 μm pentagonal pores was integrated into a microfluidic device allowing the co-cultured cells to experience cyclic mechanical strain to simulate the breathing function of the lung. The model was able to recapitulate immune response following epithelial stimulation with TNF-α, evidenced by neutrophil recruitment and transmigration. Imaging showed neutrophils penetrating the intact endothelial barrier, migrating along the PDMS membrane in search of a pore and finally reaching the basal side. In this work, the pore size was large enough to allow neutrophil transmigration, however, the effect of porosity on the efficiency of the process was not evaluated.10
A large portion of microfluidic based devices are directed to the study of cancer models.44 The mechanism of cancer metastasis includes extravasation and intravasation of cells, which are examples of transmigration studies. In order to design a physiologically relevant model to study diseases such as cancer, it is important to consider that endothelial cells, platelets, leukocytes, and signaling molecules have an effect on cancer cells throughout their metastatic process.45
Establishing a high-quality tissue barrier is the first step toward physiological recapitulation of tissue behavior, dictated in part by the selection of membranes with proper pore sizes. For instance, it has been shown that endothelial cells can migrate across 3 and 10 μm pores to form a second layer on the lower side of the membrane, disrupting the maintenance of a distinct cell monolayer desired for the studies of blood-brian-barrier46 and macular degeneration.11 Some investigators address this issue by starting with a dry-bottom culture or by using membranes with smaller pore size (0.4 μm) in their culture setup.46,47
The role of tight junctions in metastasis has gained increased attention due to the fact that they represent the first physical barrier imposing the intra/extravasation of cancer cells.48 Human umbilical vein endothelial cells (HUVECs) have been shown to develop tight junctions faster when cultured on SiO2 membranes with 0.5 μm pores compared to non-porous membranes. This phenomenon might be due to reduced cell-substrate interactions stemming from the discontinuous nature of the membrane surface. Moreover, the geometrical layout or placement of pores has also been shown to affect cell alignment of HUVECs in single culture and in co-culture with mesenchymal stem cells (MSCs)49,50. Cell morphology has also been found to be affected with the concomitant effect over tight junctions and the quality of the tissue barrier.34
2.2 Pore sizes enabling physical contact
Another function of porous membranes is to enable the physical contact between two cell populations growing on either side of the membrane to allow juxtacrine signaling. Establishing cell-cell communication is important in recapitulating the in vivo character of tissue such as the blood-brain barrier (BBB), where astrocytes send endfeet processes along the brain microvesicles. Mimicking this attribute of the BBB greatly depends on the porous characteristics of the membrane used. The pore diameter as well as membrane thickness should accommodate the physiological dimensions of the endfeet processes, and the pore density should also allow for the regular occurrence of physical contacts. Endfeet processes from human astrocytes were evidenced to project through 420 nm pores of a silicon nitride membrane 500 nm thick, while limiting astrocytes bodies to one side of the membrane.51 More recently, processes from podocytes have also been shown to extend through a PDMS membrane with a thickness of 10 μm and 7 μm pores in a kidney glomerulus model, although this separation distance is not typically considered physiological.23
Because endfeet processes are characteristic of a small set of cell types, other cell populations are required to produce long protrusions in order to make physical contact across a membrane. This has been evidenced between NIH 3T3 and endothelial cells cultured on a 1.2 μm thick parylene membrane exhibiting 0.9 μm pores.52 However, ultrathin membranes greatly increase the feasibility of physical contact among cells lacking foot processes such as between adipose derived stem cells (ADSCs) and HUVECs which have been shown to communicate through gap junctions when grown on opposite sides of a 300 nm thick SiO2 membrane.32
2.3 Pores sizes enabling paracrine signaling
Intercellular signaling is a key component of biological responses such as inflammation where two adjacent cell types simultaneously respond to an external cue. This is often studied in BBB models where the presence of an intact endothelium is essential since it has been shown that this response is absent otherwise.53 The need for careful selection of pore size has been stated before to prevent undesired transmigration.54,55 The latter enables the study of metabolic contact of cells in co-culture, this attribute is particularly important for the study of diseases such as amyotrophic lateral sclerosis (ALS) which is believed to originate from metabolic communication between neuron and astrocytes.56
Nanoscale control over pore diameter offers the advantage of modulating cell communication routes while maintaining and even improving permeability when incorporated within ultrathin membranes. The ability to selectively control cross-talk between two cell populations is of particular interest for elucidating the functionality of microvesicles, exosomes, and small signaling molecules. Exosomes have attracted an increasing amount of attention since they may play a crucial role in how healthy and cancerous cells communicate and affect each other; furthermore, they are thought to represent a feasible means of diagnosis and therapy.57–59
Continuous progress has been made over the last decades through the development and improvement of new technologies aimed to advance cell biology. Currently, this multidisciplinary field is experiencing a transition from development into validation of physiologically relevant devices for which membrane attributes will be the spotlight. In the coming years, the continuous evolution of biology into a multidisciplinary arena will incorporate sophisticated nanofabrication techniques enabling close nanoscale control and selection over the porous characteristics of cell culture membranes. This will facilitate the study of more complex cellular processes without compromising the simplicity of the widely used tissue chip model.
3 Mechanical properties
Mechanical stimuli such as strain, stiffness, and fluidic shear stress can be essential to the organization and function of organs such as the bone, vasculature, gut, and lung. Strain modulates activities of the osteoblast and the osteoclast in the formation and the desorption of bone to adapt the skeleton against external impact.60–62 Stem cells can differentiate into either bone or fat cells depending on the stiffness of the culture substrate.63 When cultured under fluid flow, vascular endothelial cells align in the direction of the flow and form tighter cell-cell barriers to prevent fluidic leakage.6,64,65 While shear stress can be added to an organ-on-a-chip through the use of flow pumps, the attainment of physiological strain and stiffness often relies on the mechanical properties of the membrane materials.
3.1 Substrate stiffness
Depending on the tissue, the elastic modulus (E) varies from 1.0 kPa in fat, 0.3–0.8 MPa in vasculature, 1–20 MPa in skin, 10–40 MPa in cartilage, 50–100 MPa in tendon and ligament, to ~20 GPa in bone.66–75 While not ideal for the mechanical mimicking of soft tissues, track-etched membranes (E~1.9–2.9 GPa) have been widely used for the modeling of blood vasculature and the BBB because of their commercial availability.76,77 In recent years, the porous PDMS membrane has gained attention in the organ-on-a-chip community for its lower stiffness and the ability to emulate the cyclic stretching seen in the lung and the intestine.6,7,10 At a curing agent to base ratio of 1:10, the commonly used PDMS formulation (Sylgard 184) has an elastic modulus of ~1.3 MPa, which allows a closer mimic of some soft tissues.25–27 The elastic modulus can be further lowered toward the level of the vasculature and the fat by reducing the ratio of curing agent to base, the duration and the temperature of curing, or by using a softer formulation such as the Sylgard 527.27 The ease of handling and manufacturing, however, becomes challenging, as the soft membranes tend to tear during the pulling involved for the release of the PDMS membrane from the mold. It is important to note that the apparent stiffness of the membrane is influenced by the membrane porosity, which has been demonstrated empirically to closely follow the power-law relationship
| (1) |
where Eapp is the apparent elastic modulus of the membrane with the porosity p, E0 is the intrinsic elastic modulus of the solid material, pc is the porosity at which Eapp becomes zero, and f is the parameter that accounts for the variation of grain morphology and the pore geometry of the membrane.78,79 A simple 1st order approximation for Eapp can be obtained by assuming pc = 1 and f = 1, which yields
| (2) |
It is also important to note that the microarchitecture and the organization of adhesion molecules on the membrane substrate can influence the cytoskeletal tension landscape, which mechanotransduce cell differentiation in ways similar to stiffness.80–83 For instance, numerous small pores on a stiff substrate can promote cell phenotypes similar to those seen on a much softer substrate.49 Similarly, by decreasing the polymer length of the substrate while maintaining the same stiffness, stem cells can undergo differentiation toward the fat cell lineage.81
3.2 Substrate strain
The use of porous PDMS membranes has been reported for different organ-on-a-chip applications (Table 2), but the most successful demonstration came from its use in a lung-on-a-chip (Fig. 3).6,7,10,11,13,23 The cyclic stretching of the PDMS membrane has been shown to increase the inflammatory response of the alveolar epithelial cells to the presence of silica nanoparticles, along with a higher rate of nanoparticle translocation from the alveolar space to the capillary.10 Furthermore, this higher rate of nanoparticle translocation was reduced by subduing the inflammation with a free radical scavenger. These observations were later confirmed in the same study with a mouse model, which showed increased translocation of the nanoparticles from the lung into the surrounding vasculature with cyclic breathing. The lung-on-a-chip study thus provided an excellent example where an in vitro system recapitulated a key in vivo phenomenon. Furthermore, it appears that strain (in vivo/on-chip = 5–25%/10%), rather than stiffness (in vivo/on-chip = 1 kPa/1.3 MPa), is the key mechanical determinant for a good nanoparticle toxicity model in the lung.67
Table 2.
Summary of membrane-supported tissue barrier studies where cyclic strain was applied. All membranes used were custom cast PDMS.
| Membrane attributes | Strain | Cell or tissue type | Goal of the study |
|---|---|---|---|
| 10 μm pores, 30 μm thick (implied) | Capable of 10 % cyclic (0.15 Hz) strain | Gut epithelium and Lactobacillus rhamnosus | Promoted culture of gut microbial flora6 |
| 10 μm pores, 20 μm thick (implied) | Capable of 10 % cyclic (0.15 Hz) strain | Gut epithelium | Induction of Caco2 villus differentiation13 |
| 10 μm pores, thickness not mentioned | Capable of 10 % cyclic (0.15 Hz) strain | Gut epithelium and Coxsackie B1 | Reconstituting the polarized viral infection of the gut7 |
| 10 μm pores, 10 μm thick | Capable of 5–15 % cyclic (0.2 Hz) strain | Alveolar epithelium- endothelium | Reconstitute lung function10 |
| 7 μm pores, 50 μm thick | Capable of 10 % cyclic under cyclic (1 Hz) suction (0.85 kPa) | Kidney glomerulus | Recapitulation of glomerular filtration23 |
Fig. 3.
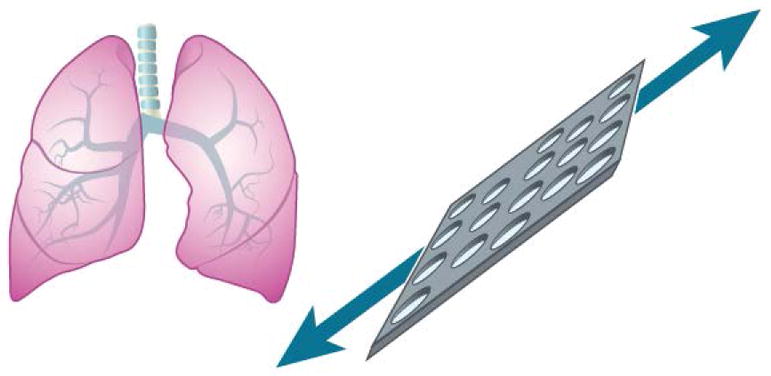
Elastomeric membranes allowing cyclic stretching have shown to elicit improved physiological response of alveolar cells to bacteria, inflammatory cytokines, and nanoparticles.10
Cyclic stretching has also been shown to promote the phenotypes of intestinal (Caco2) and kidney (ihPSC-derived podocyte) epithelial cells closer to those seen in vivo, such the increased cell height, microvillus formation, and digestive activity of the Caco2 cells and the increased formation of foot processes, VEGF-A secretion, and cytoplasmic nephrin expression of the ihPSC-derived podocytes.6,7,13,23 However, the benefit of cyclic stretching on the promotion of physiological phenotypes is not always obvious. For instance, similar promotion of physiological phenotypes can often be attained through shear stress alone, and it is unclear if the further promotion gained through the addition of cyclic stretching is an indirect consequence of the higher shear stress that may have occurred as the flow channel height decreased during the lateral stretching of the membrane.6 In the case where cyclic stretching is warranted, such as the study of nanoparticle toxicity in the lung, different types of membrane materials could be explored to address the shortcomings of the PDMS, such as fragility and the tendency to absorb hydrophobic drug moieties.28
4 Surface properties
In the search for physiologically relevant substrates and scaffolds to meet the needs of cell culture and tissue engineering, tailoring of the surface properties has also been explored. Topography and roughness of non-porous substrates has been extensively studied and correlated to cellular response, as previously published.5,28 Cell populations in culture continuously sense and respond to physical and chemical cues derived from the surface properties of the supporting substrate. Chemical properties include presence of functional groups to enhance cell adhesion as well as phase changing molecules to control adhesion/detachment. Physical properties include all topographical features present at the surface such as ridges and wells. Pores are considered a physical property of the bulk rather than the surface.
4.1 Surface chemistry
Functionalization of cell culture substrates, including membranes, with extracellular matrix derivatives is by far the most widely implemented chemical modification for mono and co-culture of a wide range of cell types.84–87 In addition to enhanced adhesion, these chemical modifications have shown to promote spatially ordered myogenesis in mono culture84 and improve neurons phenotype when dorsal root ganglion (DRG) neurons where co-cultured with differentiated adipose stem cells (dASCs) on a poly-ε-caprolactone (PCL) film functionalized with RGD moieties.87 Thermoresponsive materials such as poly(N-isopropylacrylamide) (pNIPAM) exhibit a transition from a hydrophobic to a hydrophilic state following a temperature drop, typically from 37 to 20 °C. This surface property has been applied for the controllable detachment of bovine carotid artery endothelial cells (BAECs) grown to form confluent layers.88 This straightforward process is of special interest for tissue engineering and has been performed in mono culture models by surface functionalization or through the implementation of electrospun pNIPAM.89
4.2 Surface roughness and topography
The simplest physical modification corresponds to the surface roughness which has shown to promote cell adhesion due to increased surface area.90 Increased roughness has also been linked to improved differentiation of osteoblasts.91
Introduction of larger features is another approach for controlled cell growth. Uniaxial thermal stretching was utilized to produce ridges on a PCL porous film to be used on tissue grafts for vascular development. The presence of these features improved the alignment efficiency of mesenchymal stem cells during mono and co-culture with endothelial cells (Fig. 4).50 The presence of ridges are also utilized in cardiac tissue models since their presence enhances the orientation of cardiomyocytes.92,93 Nerve guidance is a task often accomplished through topographical features, mainly wells or conduits as in the case of a poly-(lactic- co-glycolic acid) (PLGA) micro/nanostructured membrane which enhanced the migration of nerve cells in the direction of the conduit pattern.94
Fig. 4.
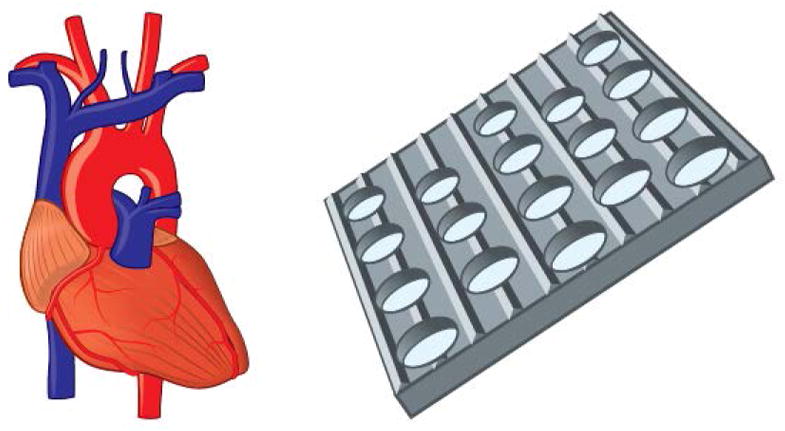
Chemical and topographical features are often incorporated to promote cell adhesion and alignment, including the development aligned vascular endothelial barrier models.50
Recapitulating the villi of the gastrointestinal tract epithelium remains a task of great interest for drug screening and overall understanding of nutrient absorption and microbiome. One of the approaches taken is the use of a polymeric membrane draped over silicon pillars.95 More recently, the addition of collagen microscale features on a membrane to mimic the overall architecture of the crypt-villus was able to yield a polarized tissue barrier after providing a biochemical gradient.96
Physical phase change is a transition that has also been harvested most commonly through the use of shape memory polymers. These substrates can change their overall shape by folding, twisting, or recovering a pre-established shape97 or change the orientation of nanotopographic features at the surface. The latter was applied as a model for coordinated extracellular matrix reorganization and its effect on primary cardiac muscle cells.98 Although promising, these physical phase transition materials have not been used as a membrane for cell culture.
Confined cell growth within microwells is another approach often used in stem cell differentiation protocol, although almost exclusively applied for mono culture models on non-porous substrates.99,100 Other topographical features applied on non-porous substrates include the presence of microposts.101,102 Overall, chemical and physical modifications of substrates and their effect on cell behavior are well studied and documented for mono culture on non-porous substrates. Conversely, limited research has been done on membrane-based models harnessing surface properties and provides an opportunity for the tissue chip community.
5 Transparency and thinness
A number of additional membrane attributes are beneficial to tissue-on-a-chip and co-culture applications, such as the optical transparency for imaging and thickness that approximate to nanoscale physiological separation of cells.
5.1 Optically transparent membranes
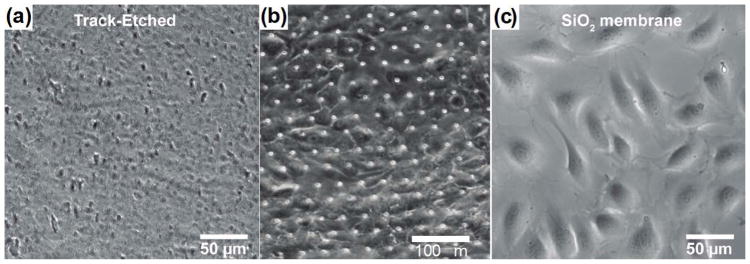
As increasing efforts are made toward the automation of high-throughput cell profiling via microscopy, the optical transparency of the membrane becomes critical.15,16 Bright-field imaging enables the noninvasive monitoring of cells throughout the progression of the co-culture, while fluorescence imaging allows the identification of key biomarkers within and on the surface of the cells. Track-etched membranes allow sufficient transmission of light for fluorescence imaging of cells on either side of the membrane with some background signal, but tend to yield low quality bright-field imaging. This is likely due to a high degree of light scattering caused by pores that bored through the membrane material at different angles (Fig. 6A). While the silicon nitride (SiN), silicon dioxide (SiO2) and PDMS membrane all offered excellent transmission of visible light, good bright-field imaging may still be difficult to obtain for pore size in the micron range due to light scattering (Fig. 6B). When imaging at the membrane, the scattering of light from the pores often results in varying degree of blurring depending on the pore spacing. The image quality is even lower when imaging at different focal planes, since the out-of-focus pores blur the images. However, in transparent materials such as SiO2, these undesired optical effects become negligible for pores in the nanometer range (Fig. 6C).
Fig. 6. Quality of bright field imaging with the different membranes.
Representative image of endothelial cells on the track-etched membrane with 3.0 μm pore size (a),32PDMS membrane with 7.0 μm pore size (b), 23 and SiO2 membrane with 500 nm pore size (c).32
5.2 Ultrathin membranes
For cells that are in direct contact with one another, such as the astrocytes and endothelial cells in blood brain barrier, the ideal membrane would be one that is as thin as possible. In addition to a better mimic of physiological separation, the thinner membranes also enable higher diffusive and hydraulic permeability and lower background TEER.20,21,104 For instance, a reduction of the membrane thickness from the micron to the nanometer range would result in a three order of magnitude increase in both diffusive and hydraulic permeability. Well-known examples of the enhanced permeability can be found in the graphene oxide (GO) membranes and the ultrathin silicon-based membranes, which have thicknesses in the molecular (Å) and nanometer range (Table 3).105–112 While many of these thin membranes have been used in the small-scale operations of molecular separation, there are very few in cell culture applications.21,30,32,49,51,52,55,113,114 This is due in part to the difficulty in the manufacturing and the handling of the thin membranes during device assembly and long-term cell culture. Consequently, ultrathin membranes are often reinforced with another membrane or microfabricated structure to increase their mechanical strength.21,31,108–112 Fabrication methods for ultrathin membranes with nearly 1:1 aspect ratios of thickness to pore diameter can be found in our recent critical review on this topic.35
Table 3.
Summary of ultrathin membranes that can be utilized in tissue barrier and co-culture models. Pnc-Si (Porous Nanocrystalline Silicon), SiN (Silicon nitride), SiO2 (silicon dioxide)
| Material | Commercially available? | Attributes | Cell or tissue type | Goal of the study |
|---|---|---|---|---|
| Parylene | No – Lithography | 0.8 – 4.0 μm pores, 1 μm thick | Fibroblast co- culture | Fabrication of thin membranes allowing physical contact52 |
| Pnc-Si | No – Rapid phase transition and lithography | 15 nm thick, 3 – 80 nm “pores” | Endothelium | Investigate feasibility of nanomembrane-supported endothelial barrier model30 |
| Pnc-Si | No – Rapid phase transition and lithography | 15 – 30 nm thick (likely), 30 – 80 nm pores (likely) | Endothelium | On chip TEER measurement correction113 |
| Pnc-Si and SiN | No – rapid phase transition and lithography | 15 nm thick, 30 nm pores, supported on a SiN hexagonal grid | Neutrophils | Shear-free chemotaxis and cell labeling21 |
| SiN | No – Lithography | 0.27 – 0.7 μm pores, 1 μm thick | Blood brain barrier | Allowance of physical contact to improve tissue barrier51 |
| SiN | No – rapid phase transition and lithography | 0.3 μm thick, 40 – 80 nm pores | Endothelium | Demonstration of cell culture114 |
| SiO2 | No – Lithography | 0.3 μm thick, 0.5 – 3.0 μm pores | HUVEC/ADSC co- culture | Fabrication of ultrathin membranes for cell culture32 |
| SiO2 | No – Lithography | 0.3 μm thick, 0.5 and 3.0 μm pores | Endothelium | Cell-substrate interactions49 |
| SiO2 | No – Lithography | 0.3 μm thick, 0.5 and 3.0 μm pores | Vasculature | Endothelial differentiation of ADSC and perivascular interaction55 |
6 Permeability and transport
The permeability of a tissue barrier to solute diffusion, fluid flow, and the flow of electric current are commonly characterized to guide the design and the performance evaluation of a tissue barrier and co-culture model. Depending on the membranes used, the apparent permeability seen in a tissue barrier or a co-culture model can vary substantially (Table 5). Solute permeability is an indicator of tissue barrier tightness and the rate of active transport performed by the cells. It is commonly reported in the studies of drug transport across the blood brain barrier115 and the selective filtration of toxins in a kidney-on-a-chip.6,23,116,117 A close matching of solute permeability to known in vivo values is often an indication of a successful reconstitution of tissue functions in vitro. The fluid permeability of a tissue barrier is an indicator of mature barrier formation. The more established tissue barrier has more tight junctions and smaller interstitial space between cells, which results in a lower permeability to fluid flow. Trans epi/endothelial electrical resistance (TEER) is a technique that allows quick assessment of the fluid permeability based on electrical resistance. TEER is commonly performed to ensure the formation of mature barrier prior to the study of drug transport.118 In the following section, we discuss the impact of membranes on the apparent permeability measured on a tissue barrier or a co-culture model. The analytical framework presented not only allows a first order estimate of membrane permeability but also readily extends to guiding the design of a tissue barrier or co-culture model.
Table 5.
Estimated permeability of different membranes used in tissue barrier and co-culture models, calculated based on pore size, porosity, and membrane thickness. IP-DiLL(IP-dipin Laser Lithography photoresist), PC (Polycarbonate), Pnc-Si (Porous nanocrystalline Silicon), PDMS (Polydimethylsiloxane), SiN (Silicon nitride)
| Material | Commercially available? | Permeability or Conductance Diffusive/Hydraulic/Electric | Tissue type | Goal of the study |
|---|---|---|---|---|
| IP-DiLL photoresist | No –two photon lithography |
1.1 · 10−5 s/m3 4.5 · 10−6 pas · s/m3 2.2 · 105 S−1 |
bEnd.3 and U87 glioblastoma | On chip BBB127 |
| PC | Yes – Track etched – AR- Brown |
3.5 · 10−8 s/m3 3.2 · 10−9 pas · s/m3 270 S−1 |
CHO cells | Rapid shear-free delivery of soluble factors over large culture area20 |
| PDMS | No – Custom casting |
5.7 · 10−7 s/m3 pas 2.3 · 10−5 · s/m3 1.1 · 104 S−1 |
Caco-2 BEE | On chip TEER measurement correction104 |
| pnc-Si and SiN | No – rapid phase transition and lithography |
8.6 · 10−4 s/m3 8.6 · 10−8 pas · s/m3 1.0 · 107 S−1 |
neutrophils | Shear-free chemotaxis and cell labeling21 |
The permeability of the membrane to solute diffusion and fluid flow can be determined with an electrical circuit analogy, in which the pores are represented as resistors connected in series and parallel. The governing equation describing the flow of electric current is the well-known Ohm’s law:
| (3) |
where ΔV is the voltage difference that drives the current flow and I is the electric current.
For solute diffusion and fluid flow, the analogous governing equations are the Fick’s Law and the Hagen-Poiseuille Law:
| (4) |
| (5) |
where ΔC is the spatial variation of solute concentration, J is the solute flux, ΔPflow is the hydrodynamic pressure difference that drives the fluid flow, and Q is the rate of the fluid flow. Resistance is largely a function of geometry, in which a volume element with a small cross sectional area or a long length yields a high resistance. Since the dependence of resistance on the common geometries have been well characterized (Table 4), if the driving forces (ΔV, ΔC, ΔPflow) behind the transport is known, the rates of transport can be determined, and vice versa. The permeability, P, is defined to be the reciprocal of resistance, and the two terms will be used interchangeable throughout the ensuing discussions.
Table 4.
Resistance to diffusion, fluid flow, and current flow for different pore or channel geometries. r is the pore radius, w and h are the width and height of the rectangular channel, respectively. L is the length of the pore or the rectangular channel, parallel to the direction of fluid and current flow; A is the cross sectional area normal to the flow of electric current. D, μ, and K are the diffusion coefficient of the solute, dynamic viscosity of the fluid, and the electrical conductivity of the media, respectively. The subscript p and ch denotes the pore and the rectangular channel, respectively.
| Resistance to solute diffusion: | ||||
|
| ||||
| pore as a disc (account for pore discovery)119 |
|

|
(B1) | |
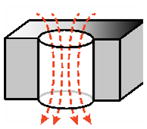
| pore as a cylinder (account for pore passage)119: |
|
|
(B2) | |
|
| ||||
| Resistance to flow: | ||||
|
| ||||
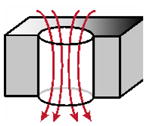
| pore as a cylinder120: |
|
|
(B3) | |
| short through pore (in the case of a thin membrane)121: |
|

|
(B4) | |
| rectangular channel*: |
|

|
(B5) | |
|
| ||||
| Resistance to electric current: | ||||
|
| ||||
| for all geometry: |
|
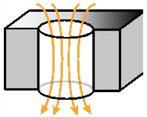
|
(B6) | |
Eqn (B)5 is an asymptotic approximation that holds for w ≫ h.
6.1 Trans epi/endothelial electrical resistance
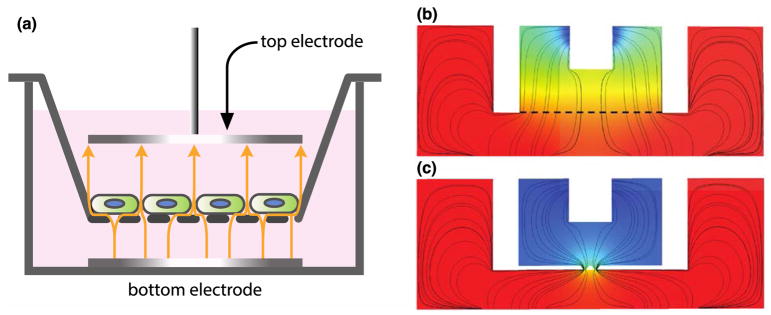
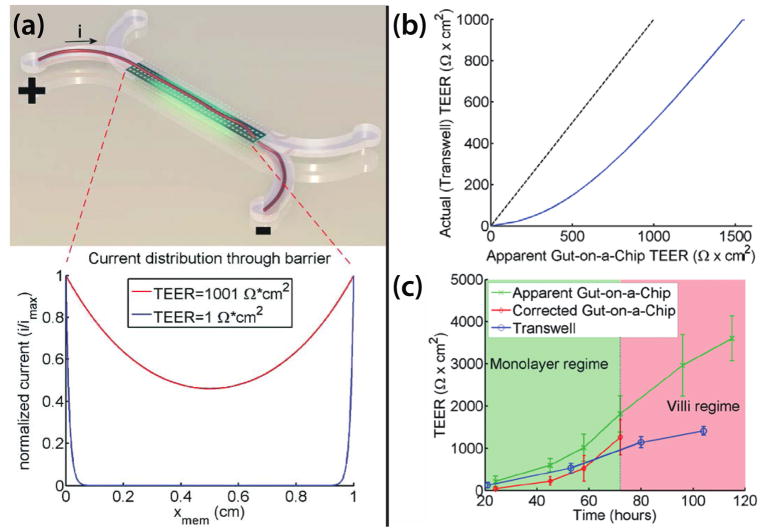
Trans epi/endothelial electrical resistance (TEER) is often performed as a non-invasive first check to ensure the mature formation of a tissue barrier prior to the measure of solute permeability. A known electric current (I) is applied through the tissue barrier, and the associated voltage drop (ΔV) is measured to determine the electrical resistance of the tissue barrier. Since physiological buffers are good conductors of electricity, the path of fluid flow through a tissue barrier often the direct path of the electric current, and the electrical resistance measured should be somewhat proportional to the fluidic resistance of the tissue barrier. For the membrane system with the electrodes placed directly above and below the tissue barrier, the flow of electric current is normal to the tissue barrier, and all resistive elements in the system are connected in series (Fig. 8). In this case, the TEER value can be obtained simply by multiplying the difference of the system resistance with and without the tissue barrier by the area of the tissue barrier:
| (6) |
where Rtotal is the total resistance measured and R0 is the baseline resistance of only the membrane insert system, without any tissue barrier. Since TEER is defined as the intrinsic electrical resistance of the tissue barrier, we will need to multiply the apparent difference Rtotal – R0 by the area of the tissues barrier (AM, which is also the membrane area) to account for the fact that larger area with the same intrinsic electrical resistance will yield lower apparent resistance during measurement.
Fig. 8. Examples of electrode placement and geometry affecting TEER measurement.
(a) Example of an ideal TEER measurement configuration in a membrane-insert system (adapted from the illustration of Odijk et al.104). The electrodes that generate the current are of the same size and shape as the tissue barrier, and placed directly above and below. The yellow arrows indicate the paths of electric currents through the tissue barrier. (b) and (c) are the simulated paths of electric currents in the EndOhm system for transwell inserts with a large sheet of membranes (denoted by the dashed line) and with 2 narrow slits of membranes, respectively. The ‘squeezing’ of currents through the two slits leads to an increase in the path length of current flow, culminating in a 10–12X higher baseline resistance.
In most tissue barrier models, however, it is not possible to position the electrodes of the same shape and size as the tissue barrier directly above and below (Fig. 8b&c and Fig. 9a). Consequently, not all electric currents conduct through the tissue barrier with the same path length or uniformity throughout, and TEER value calculated using eqn (6) tends to produce artifactually high value of TEER (Fig. 9b&c). In the case of current flow through a constriction (Fig. 8c), the longer flow path associated with the current redirection results in a higher baseline resistance. In the case in which the current generating electrodes are placed at the opposite ends along the membrane length (Fig. 9), most current conducts through only small pockets of the membrane (primarily at the two opposite ends), which also results in a higher baseline resistance. Thus similar tissue barriers can yield different TEER values depending on the configuration of electrodes and the geometry of the supporting membrane. A detailed treatise on how to correct this artifact is given by Odijk et al.104 and Khire et al.113 The former offered an elegant analytical approach using cable theory, while the latter enabled an accurate correction using finite element modeling. Briefly described, a geometry-specific model is constructed either analytically or through a finite elements, and the true TEER of the tissue barrier is one that produces the same apparent resistance measured from the actual device.
Fig. 9. Comparison of the apparent versus actual TEER in the barrier model of of Odijk et al104.
(a) The distribution of current along the membrane length. Top, artistic rendition of current flow through the membrane. Bottom, the distribution of current flow obtained using an electric circuit analogy. Most currents distribute through the membrane at the beginning and the end of the channel. Since only part of the membranes are conducting currents, the associated voltage drop will be larger, yielding a larger TEER value. (b) Comparison of the actual versus the apparent TEER value. A TEER value is assigned and the apparent TEER value measured on the gut-on-a-chip can be estimated using an electric circuit analogy. (c) Comparison of the corrected TEER value from the gut-on-a-chip versus the TEER value measured from the membrane-insert system, using the same cell line. Based on the correction chart in b, the apparent TEER value measured on the gut-on-a-chip can be corrected to the true TEER value. This correction produced a TEER value that is comparable to the one obtained from the membrane-insert system.
6.2 Solute permeability
One primary function of a tissue barrier is to create distinct microenvironments through the selective transport of key biomolecules. The attainment of in vivo solute permeability for these biomolecules is often a validation of a successful reconstitution of barrier function. The framework of solute permeability measure is nicely presented in the review of Wong et al.116 Briefly described here, solute permeability is determined by loading the solute of interest at a known concentration (Cin) into the input compartment and measuring the increase of solute concentration (Cout) in the output compartment over time (t). The flux of solutes from the input to the output compartment is given by
| (7) |
where J is the solute flux, which typically take on the unit of mol/s, N is the number of solutes, t is time, and kin and kout are the rate of solute transport into and out of the other compartment, respectively. In the absence of active cell involvement, the cross-compartmental transport is purely diffusive. Since diffusion is a random process, the solute has equal likelihood to move into and out of the output compartment, and kin = kout = PA, where P and A are the solute permeability and the area of the tissue barrier that separates the two compartments, respectively.
Thus, eqn (7) can be expressed as
| (8) |
Rewriting cout as Nout/V, where V is the volume of the output compartment, integration of eqn (8) yields
| (9) |
For a short time scale, such that PAt ≫ V, eqn (9) can be approximated by its linearization, yielding
| (10) |
For a tissue barrier formed on a membrane, P is the combination of the diffusive permeability of the tissue barrier (Ptb) and the membrane (Pm) to a given solute, much like resistors connected in series. Since permeability is the reciprocal of resistance, we have
| (11) |
Note that for a membrane of known porosity and pore size, Pm can be obtained based on the resistances described in Table 4. The solute permeability of the tissue barrier can be thus estimated from eqn (11). An example of the estimate for Pm is given in Box 1.
Box 1. Estimating the diffusive permeability of different membranes.
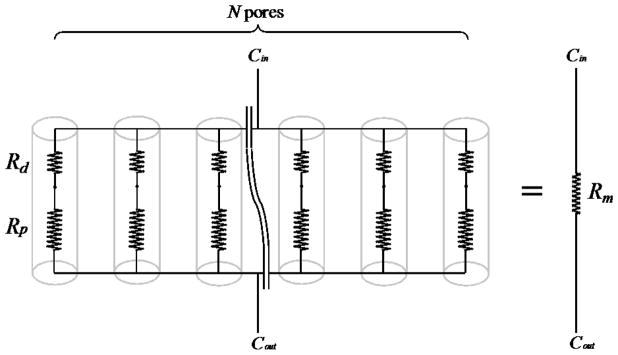
To illustrate the difference of solute permeability due to membrane thickness, we examine the diffusion of 10 nm solutes through membrane A and B. A is an ultrathin SiO2 membrane (0.04 cm2 area; 300 nm thickness; 500 nm pore diameter; 23% porosity). B is a polycarbonate track-etched membrane for the 96-well plate membrane insert from Corning (0.143 cm2 area; 10 μm thickness; 400 nm average pore diameter; 1.0 × 10⁸ pore/cm2 pore density). A circuit representation of the membrane is given in Fig. B1 below:
Fig. B1.
Membrane as a network of resistors.
Rd and Rp are the resistance due to pore discovery and passage through the pore, respectively. N is the total number of pores, and Rm is the equivalent resistance for the entire membrane.
Base on Stokes-Einstein Equation, the diffusion coefficient of a 10 nm solute is ~ 5 × 10⁻⁷ cm2/s. Applying Table 4, we have Rd,A = 1.0 × 10¹⁰ s/cm3 and Rp,A = 6.0 × 10⁹ s/cm3 for the ultrathin SiO2 membrane, and Rd,B = 1.25 × 10¹⁰ s/cm3 and Rp,B = 3.125 × 10¹¹ s/cm3 for the polycarbonate track-etched membrane. Note that for the ultrathin SiO2 membrane, the resistance due to pore discovery is actually greater than the resistance through the pore. This is not unexpected since it is more likely for a randomly diffusing solute to cross the 300 nm distance through the pore than to vacillate about the 500 μm pore opening.
Since the membrane resistance (Rm) is equivalent to the sum of the N parallel resistors, Rm = (Rd + Rp)/N. The ultrathin SiO2 membrane with a 0.04 cm2 area and a 23% porosity contain ~ 4.7× 10⁶ of the 0.5 μm pore, and Rm,A ≈ 3.41 × 10³ s/cm3. The polycarbonate track-etched membrane with a 0.143 cm2 area and a pore density of 1.0 × 10⁸ pore/cm2 contains ~ 1.4× 10⁷ pores, and Rm,B ≈ 2.3 × 10⁴ s/cm3. Despite having a smaller area, the ultrathin SiO2 membrane actually permits more diffusive transport between compartments than the larger track-etched membrane. The publication of VanDersarl et al. offered another example of permeability estimate using electric circuit analogy.20 A more rigorous treatment on the diffusive permeability of thin membranes can be found in the work of Snyder et al.134
6.3 Fluid permeability
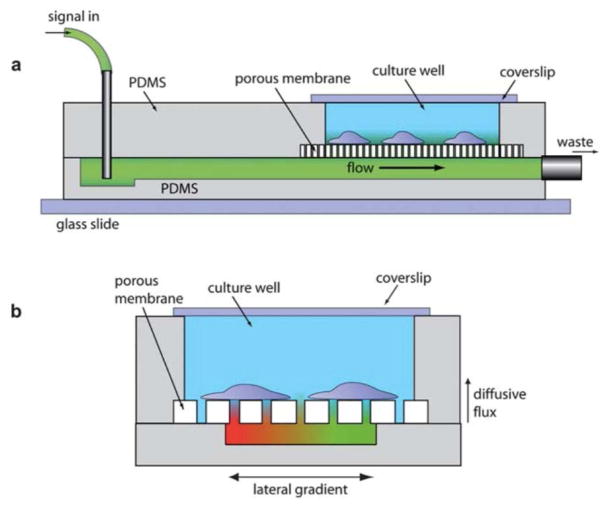
An increase of tissue barrier permeability and interstitial flow is often associated with inflammation and has even been implicated in cancer progression.122–125 The generally leakiness of a tissue barrier to fluid flow can be estimated quickly through TEER or the solute permeability of tracer molecules such as fluorescent dextran. For specific applications such as the tangential flow filtration and the culture of shear sensitive cells, however, an understanding of the exact direction and the magnitude of flow is critical to the optimization of system performance. Fig. 10 below illustrates a shear-free chemotaxis system in which a membrane is used to buffer the influx of fluid flow used to deliver a soluble gradient to direct the migration of cultured cells.
Fig. 10. The shear-free chemotaxis system of VanDerSarl et al20.
(a) A side view of the system, showing the delivery of soluble signal. (b) An end-on view of the system, showing the soluble gradient.
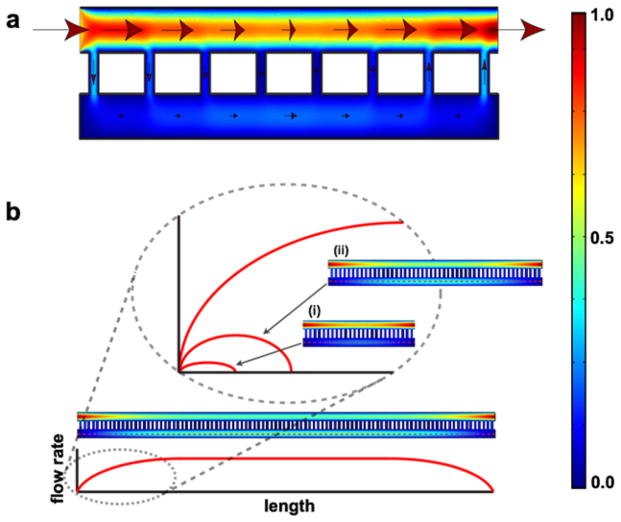
The distribution of flow rate through such a system is similar to the one given in Fig. 11. Briefly described, as flow passes over a pore, a portion of the flow diverts through the pore. The magnitude of this diversion is proportional to the pressure drop through the pore normalized with respect to the pressure drop across the pore opening (eqn (15)). Thus the higher the pore resistance, the lower the seepage of flow from the input to the output compartment. The analytical solution, organized in an intuitive form, is given by
Fig. 11. Distribution of flow rates in a membrane-based chemotaxis system by Chung et al21.
(a) A representative COMSOL simulation for the distribution of flow rates throughout the system. The arrows indicate the directions of flow and the size of the arrows represents the magnitude of flow rate (not drawn to scale). The heat map to the far right provides a reference of the flow rate magnitude, with the red and blue denoting the normalized maximum and minimum, respectively. (b) Given a system with sufficiently long membrane span, the flow rate in the bottom compartment reaches a plateau value that is independent of the membrane. For a system with a short membrane span, this plateau value is never reached. Past the mid-point of the membrane span, all the flow in the bottom compartment must return to the top in order for mass conservation to hold.
| (12) |
| (13) |
| (14) |
where qp(n) is the flow through the nth pore, qt(n) and qb(n) are the flow through the nth section of the top and the bottom compartment, respectively, and Rt and Rb are the associated resistances (eqn (12)). The term ω(n) describes the crosstalk of flow between compartments, and is largely a function of the pore resistance Rp:
| (15) |
Rt, Rb, and Rp can be estimated from Table 4. Given a sufficiently long flow path, ω(n) reduces to zero, and an equilibrium is reached in which the input flow (Q) is fully redistributed between the top and the bottom compartment in accordance to the resistance of the compartments, and there are no more flow through the pores. Note that membrane porosity is accounted for indirectly in this analytical solution — as porosity decreases, the center-to-center distance between pores (Lp-p) increases. This translates to a longer length terms in the calculation of Rt and Rb, and thus a larger resistance over the pore opening. If we assume a hexagonal packing arrangement of pores, Lp-p can be calculated from the porosity (p) by
| (16) |
Depictions of the flow distributions under different boundary conditions are given in Fig. 13. Note that through the use of symmetry, the analytical solution given by eqns (12–14) can be generalized to solve the distribution of flow rates for different boundary conditions seen in more complex fluidic system.126,127 An example is given in Box 2. Detailed derivation of the closed form solution (eqns (12–14)) is given in the work of Chung et al.21 We calculated the permeability of the different membranes mentioned in Table 5, using the methodology outlined in this section.
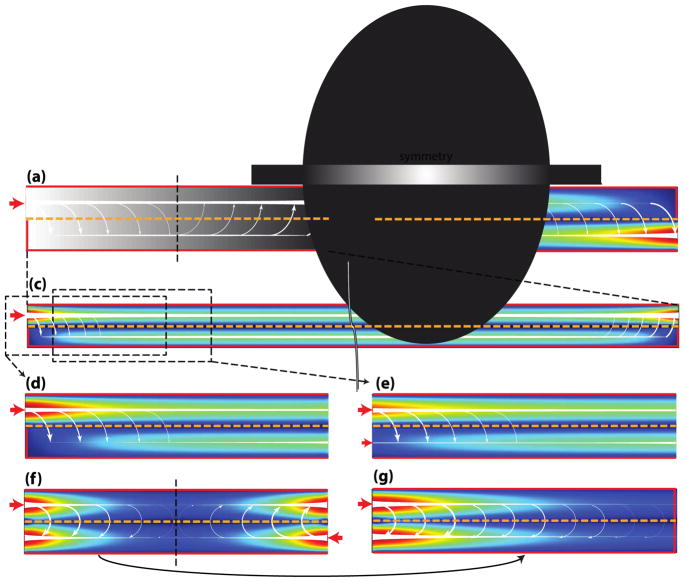
Fig. 13. Flow distribution for the different boundary conditions of tangential flow.
The red arrows and outlines denote the input flows and the no slip boundary conditions, respectively. The white arrows denote the direction of flow, with the size indicating the magnitude (not drawn to scale). The magnitude of flow rate is also indicated by the color (red = maximum, blue = minimum). The membrane separating the top and bottom compartment is represented by the orange dashed line. For the convenience of demonstration, the top and bottom compartment have identical dimensions, and consequently, identical resistances. (a) COMSOL simulation of the flow described in Fig. 11. (b) Similar flow scenario to A, but with the inlet placed at the bottom compartment. Note that the flow distribution in B can be obtained by replacing the latter half of the system with a mirror image of A with respect to the horizontal axis. (c) Similar flow scenario to A, but with a much longer channel span such that the equilibrium of flow between the top and bottom compartment is already attained. The ω term in eqn (15) predicts the onset this equilibrium. The solutions to the flow distribution in case (d) and case (e) can be obtained by first solving case C. (f) The counter-flow seen in hemodialysis, in which two tangential flows of opposite directions are applied on either side of the membrane. (g) Inlet and outlet at the same side of the top and the bottom compartment, and walls everywhere else. Again, by the principle of symmetry, the flow distribution can be predicted from the first half of f.
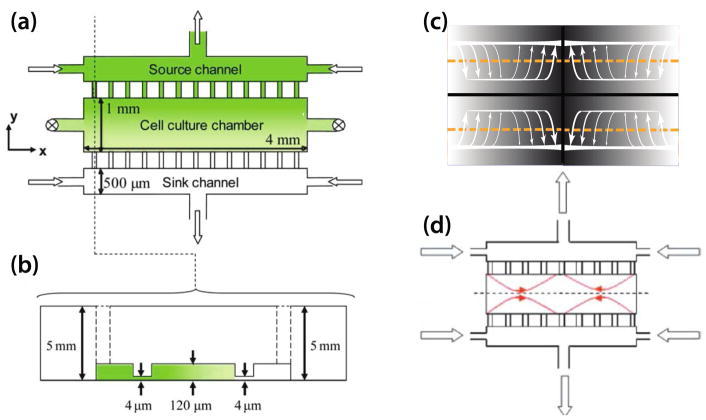
Box 2. Predicting the flow distribution in a shear-free chemotaxis device.
Since human umbilical vein endothelial cells (HUVECs) are known to align in the direction of flow, Shamloo et al. created their chemotaxis device to study HUVEC polarization with flow minimization in consideration (Fig. B2a). The flow of vascular endothelial growth factor (VEGF) and pure media generate a steady and linear chemoattractant gradient across the cell culture chamber where the endothelial cells are hosted. Two arrays of microcapillaries shield the cell culture chamber from the source and the sink channel flow.
Fig. B2. Shear-free chemotaxis device by for Shamloo et al126.
(a) Device schematic, annotated with dimensions. Note that the microcapillaries (5 μm in width, repeated every 15 μm) are not drawn to scale. (b) A cross sectional view of the device on the y-z plane, with the channel heights specified. (c) Hypothetical flow distribution predicted by applying the principle of symmetry to the flow scenario depicted in Fig. B2b. (d) COMSOL simulation of the flow distribution by Shamloo et al.
By applying the principle of symmetry, the flow distribution of the entire system can be predicted. Each “quadrant” of the shear-free chemotaxis device (Fig. B2c) will have the same flow distribution as depicted in Fig. 13A. The maximum flow rate observed in the cell culture chamber can be estimated from the maximum flow in each quadrant through eqn (13).
7 Challenges and future directions
Considerable interest has been shown towards developing membrane-based tissue barrier and co-culture models. While the advantages of such devices are numerous, increased attention and demands on the properties of the selected membranes will likely uncover challenges in fabrication, handling, and implementation.
The current repertoire of commercially available membranes is limited, mainly led by thick polymeric membranes with random placement of pores and unsuitable optical properties. Several research groups have taken on the challenge of fabricating membranes in their laboratories by designing innovative fabrication processes to meet the demand of membrane-based research while still providing affordable technology. Some of these methods include self-assembling polymers,128,129 nanosphere lithography,130,131 anodization,132 nanoimprint,133 solid phase crystallization,106 and carbon based methodologies.38 Two main fabrication challenges can be identified, nanoscale control over pore size and mechanical stability of the produced free-standing membranes. Nevertheless, affordable patterning of nanoscale features over a large area is not a trivial task and current processes often yield a significant concentration of defects. Mechanical stability is a property dependent on the particular materials and processing involved, hence the need for membrane-specific optimization. Moreover, membrane handling is critical for successful integration into cell culture devices, particularly for ultrathin membranes. These fabrication challenges remain the subject of intense research and development.
Overcoming these challenges will enable carefully designed membranes to meet the needs of a specific organ or tissue, successfully recapitulating the relevant phenotype.5 The improved tissue-on-chips and co-culture systems will facilitate stem cell research, personalized medicine, as well as discovery and screening of new drugs.
Fig. 5.
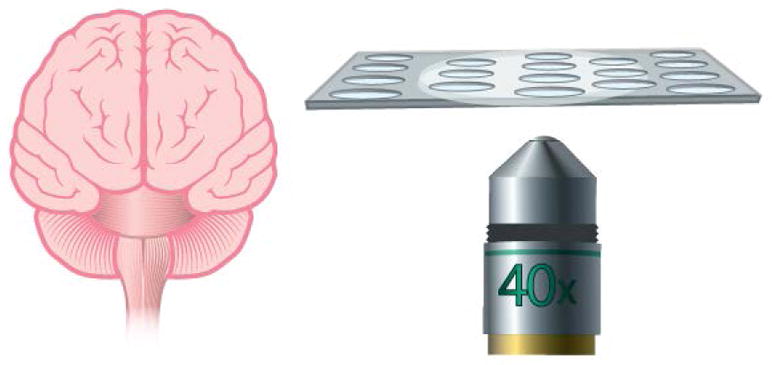
Ultrathin membranes bring astrocytes and endothelial cells in closer contact to better represent the blood brain barrier. Moreover, ultrathin membranes offer high permeability and are optically transparent.103
Fig. 7.

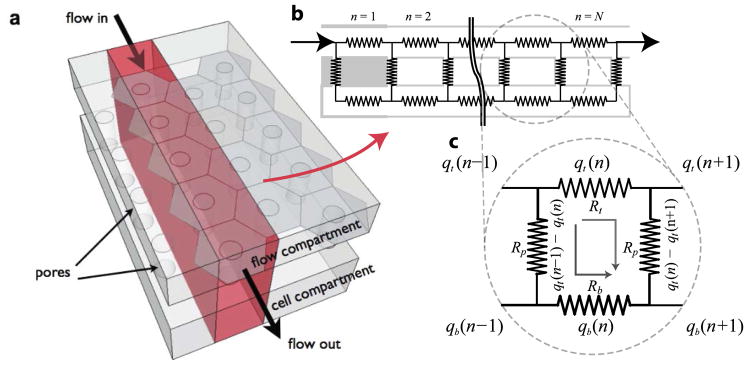
Fluid transport and permeability across a tissue barrier can be represented as an electrical circuit including resistors in a serial and parallel arrangement.
Fig. 12. Analytical model of flow distribution.
(a) A simplification of the 3D flow through a 2D cross section. (b) Circuit representation of the different flow paths, where n indexes each repeating section of the ladder network of resistors, and N is the total number of repeats. (c) A unit section of the circuit used to index the different flow rates (q) in the ladder network. The subscript p, t and b denote the pore and the top and bottom compartment, respectively.
Acknowledgments
The authors acknowledge financial support by NIGMS of the National Institutes of Health under award number R35GM119623 to TRG. We thank Tejas Khire for the technical discussion in the TEER section. The content of this publication is solely the responsibility of the authors and does not necessarily represent the official views of the National Institutes of Health.
References
- 1.Dambach DM, Uppal H. Sci Transl Med. 2012;4:159ps22. doi: 10.1126/scitranslmed.3003497. [DOI] [PubMed] [Google Scholar]
- 2.Sutherland ML, Fabre KM, Tagle DA. Stem Cell Res Ther. 2013;4(Suppl 1):I1. doi: 10.1186/scrt361. [DOI] [PMC free article] [PubMed] [Google Scholar]
- 3.Esch EW, Bahinski A, Huh D. Nat Rev Drug Discov. 2015;14:248–260. doi: 10.1038/nrd4539. [DOI] [PMC free article] [PubMed] [Google Scholar]
- 4.Low LA, Tagle DA. Clin Transl Sci. 2017;10:237–239. doi: 10.1111/cts.12444. [DOI] [PMC free article] [PubMed] [Google Scholar]
- 5.Hickman GJ, Boocock DJ, Pockley AG, Perry CC. ACS Biomater Sci Eng. 2016;2:152–164. doi: 10.1021/acsbiomaterials.5b00403. [DOI] [PubMed] [Google Scholar]
- 6.Kim HJ, Huh D, Hamilton G, Ingber DE. Lab Chip. 2012;12:2165–2174. doi: 10.1039/c2lc40074j. [DOI] [PubMed] [Google Scholar]
- 7.Villenave R, Wales SQ, Hamkins-Indik T, Papafragkou E, Weaver JC, Ferrante TC, Bahinski A, Elkins CA, Kulka M, Ingber DE. PLoS One. 2017;12:1–17. doi: 10.1371/journal.pone.0169412. [DOI] [PMC free article] [PubMed] [Google Scholar]
- 8.Henry OYF, Villenave R, Cronce MJ, Leineweber WD, Benz MA, Ingber DE. Lab Chip. 2017;259:158–166. doi: 10.1039/c7lc00155j. [DOI] [PMC free article] [PubMed] [Google Scholar]
- 9.Wang Z, Lim J, Ho YS, Zhang Q, Chong MSK, Tang M, Hong M, Chan JKY, Teoh SH, Thian ES. 2013:2197–2207. doi: 10.1002/jbm.a.34899. [DOI] [PubMed] [Google Scholar]
- 10.Huh D, Matthews BD, Mammoto A, Montoya-Zavala M, Hsin HY, Ingber DE. Science (80- ) 2010;328:1662–1668. doi: 10.1126/science.1188302. [DOI] [PMC free article] [PubMed] [Google Scholar]
- 11.Chen LJ, Ito S, Kai H, Nagamine K, Nagai N, Nishizawa M, Abe T, Kaji H. Sci Rep. 2017;7:3538. doi: 10.1038/s41598-017-03788-5. [DOI] [PMC free article] [PubMed] [Google Scholar]
- 12.Du Y, Li N, Yang H, Luo C, Gong Y, Tong C, Gao Y, Lü S, Long M. Lab Chip. 2017;17:782–794. doi: 10.1039/c6lc01374k. [DOI] [PubMed] [Google Scholar]
- 13.Kim HJ, Ingber DE. Integr Biol. 2013;5:1130–40. doi: 10.1039/c3ib40126j. [DOI] [PubMed] [Google Scholar]
- 14.Bhatia SN, Ingber DE. Nat Biotechnol. 2014;32:760–772. doi: 10.1038/nbt.2989. [DOI] [PubMed] [Google Scholar]
- 15.Zanella F, Lorens JB, Link W. Trends Biotechnol. 2010;28:237–245. doi: 10.1016/j.tibtech.2010.02.005. [DOI] [PubMed] [Google Scholar]
- 16.Singh S, Carpenter AE, Genovesio A. J Biomol Screen. 2014;19:640–650. doi: 10.1177/1087057114528537. [DOI] [PMC free article] [PubMed] [Google Scholar]
- 17.Abhyankar VV, Lokuta MA, Huttenlocher A, Beebe DJ. Lab Chip. 2006;6:389. doi: 10.1039/b514133h. [DOI] [PubMed] [Google Scholar]
- 18.Wang Z, Kim MC, Marquez M, Thorsen T. Lab Chip. 2007;7:740–745. doi: 10.1039/b618734j. [DOI] [PubMed] [Google Scholar]
- 19.Kim T, Pinelis M, Maharbiz MM. Biomed Microdevices. 2009;11:65. doi: 10.1007/s10544-008-9210-7. [DOI] [PubMed] [Google Scholar]
- 20.VanDersarl JJ, Xu AM, Melosh NA. Lab Chip. 2011;11:3057–3063. doi: 10.1039/c1lc20311h. [DOI] [PubMed] [Google Scholar]
- 21.Chung HH, Chan CK, Khire TS, Marsh GA, Clark A, Waugh RE, McGrath JL. Lab Chip. 2014;14:2456–2468. doi: 10.1039/c4lc00326h. [DOI] [PMC free article] [PubMed] [Google Scholar]
- 22.Loskill P, Sezhian T, Tharp KM, Lee-montiel FT, Jeeawoody S, Reese M, Zushin PH, Stahl A, Healy KE. Lab Chip. 2017;17:1645–1654. doi: 10.1039/c6lc01590e. [DOI] [PMC free article] [PubMed] [Google Scholar]
- 23.Musah S, Mammoto A, Ferrante TC, Jeanty SSF, Hirano-Kobayashi M, Mammoto T, Roberts K, Chung S, Novak R, Ingram M, Fatanat-Dida T, Koshy S, Weaver JC, Church GM, Ingber DE. Nat Biomed Eng. 2017;1:69. doi: 10.1038/s41551-017-0069. [DOI] [PMC free article] [PubMed] [Google Scholar]
- 24.Thangawng AL, Ruoff RS, Swartz MA, Glucksberg MR. Biomed Microdevices. 2007;9:587–595. doi: 10.1007/s10544-007-9070-6. [DOI] [PubMed] [Google Scholar]
- 25.Fuard D, Tzvetkova-Chevolleau T, Decossas S, Tracqui P, Schiavone P. Microelectron Eng. 2008;85:1289–1293. [Google Scholar]
- 26.Khanafer K, Duprey A, Schlicht M, Berguer R. Biomed Microdevices. 2009;11:503. doi: 10.1007/s10544-008-9256-6. [DOI] [PubMed] [Google Scholar]
- 27.Palchesko RN, Zhang L, Sun Y, Feinberg AW. PLoS One. doi: 10.1371/journal.pone.0051499. [DOI] [PMC free article] [PubMed] [Google Scholar]
- 28.Ross AM, Jiang Z, Bastmeyer M, Lahann J. Small. 2012;8:336–355. doi: 10.1002/smll.201100934. [DOI] [PubMed] [Google Scholar]
- 29.Wang JD, Douville NJ, Takayama S, Elsayed M. Ann Biomed Eng. 2012;40:1862–1873. doi: 10.1007/s10439-012-0562-z. [DOI] [PubMed] [Google Scholar]
- 30.Agrawal AA, Nehilla BJ, Reisig KV, Gaborski TR, Fang DZ, Striemer CC, Fauchet PM, Mcgrath JL. Biomaterials. 2010;31:5408–5417. doi: 10.1016/j.biomaterials.2010.03.041. [DOI] [PubMed] [Google Scholar]
- 31.Miller JJ, Carter RN, McNabb KB, DesOrmeaux J-PS, Striemer CC, Winans JD, Gaborski TR. J Micromechanics Microengineering. 2015;25:15011. [Google Scholar]
- 32.Carter RN, Casillo SM, Mazzocchi AR, DesOrmeaux J-PS, Roussie JA, Gaborski TR. Biofabrication. 2017;9:15019. doi: 10.1088/1758-5090/aa5ba7. [DOI] [PMC free article] [PubMed] [Google Scholar]
- 33.Scholzen A, Mittag D, Rogerson SJ, Cooke BM, Plebanski M. PLoS Pathog. 2009;5:26–32. doi: 10.1371/journal.ppat.1000543. [DOI] [PMC free article] [PubMed] [Google Scholar]
- 34.Nasrollahi S, Banerjee S, Qayum B, Banerjee P, Pathak A. ACS Biomater Sci Eng. 2016 doi: 10.1021/acsbiomaterials.6b00554. acsbiomaterials.6b00554. [DOI] [PubMed] [Google Scholar]
- 35.Mireles M, Gaborski RT. Electrophoresis. 2017:1–14. doi: 10.1002/elps.201700114. [DOI] [PMC free article] [PubMed] [Google Scholar]
- 36.Hinds BJ, Chopra N, Rantell T, Andrews R, Gavalas V, Bachas LG. Science. 2004;303:62–65. doi: 10.1126/science.1092048. [DOI] [PubMed] [Google Scholar]
- 37.Majumder M, Chopra N, Hinds BJ. ACS Nano. 2011:3867–3877. doi: 10.1021/nn200222g. [DOI] [PubMed] [Google Scholar]
- 38.Holt JK, Noy A, Huser T, Eaglesham D, Bakajin O. Nano Lett. 2004;4:2245–2250. [Google Scholar]
- 39.Biswas A, Bayer IS, Biris AS, Wang T, Dervishi E, Faupel F. Adv Colloid Interface Sci. 2012;170:2–27. doi: 10.1016/j.cis.2011.11.001. [DOI] [PubMed] [Google Scholar]
- 40.Warkiani ME, Bhagat AAS, Khoo BL, Han J, Lim CT, Gong HQ, Fane AG. ACS Nano. 2013;7:1882–1904. doi: 10.1021/nn305616k. [DOI] [PubMed] [Google Scholar]
- 41.Lopez CA, Fleischman AJ, Roy S, Desai TA. Biomaterials. 2006;27:3075–3083. doi: 10.1016/j.biomaterials.2005.12.017. [DOI] [PubMed] [Google Scholar]
- 42.Boyden S. J Exp Med. 1962;115:453–466. doi: 10.1084/jem.115.3.453. [DOI] [PMC free article] [PubMed] [Google Scholar]
- 43.Li Jeon N, Baskaran H, Dertinger SKW, Whitesides GM, Van De Water L, Toner M. Nat Biotechnol. 2002;20:826–830. doi: 10.1038/nbt712. [DOI] [PubMed] [Google Scholar]
- 44.van Duinen V, Trietsch SJ, Joore J, Vulto P, Hankemeier T. Curr Opin Biotechnol. 2015;35:118–126. doi: 10.1016/j.copbio.2015.05.002. [DOI] [PubMed] [Google Scholar]
- 45.Reymond N, d’Água BB, Ridley AJ. Nat Rev Cancer. 2013;13:858–870. doi: 10.1038/nrc3628. [DOI] [PubMed] [Google Scholar]
- 46.Elodie Vandenhaute M-PD, Drolez Aurore, Sevin Emmanuel, Gosselet Fabien, Mysiorek Caroline. Lab Invest. 2016 doi: 10.1038/labinvest.2016.35. In Press. [DOI] [PubMed] [Google Scholar]
- 47.Song JW, Cavnar SP, Walker AC, Luker KE, Gupta M, Tung YC, Luker GD, Takayama S. PLoS One. doi: 10.1371/journal.pone.0005756. [DOI] [PMC free article] [PubMed] [Google Scholar]
- 48.Martin TA. Semin Cell Dev Biol. 2014;36:224–231. doi: 10.1016/j.semcdb.2014.09.008. [DOI] [PubMed] [Google Scholar]
- 49.Casillo SM, Peredo AP, Perry SJ, Chung HH, Gaborski TR. ACS Biomater Sci Eng. 2017;3:243–248. doi: 10.1021/acsbiomaterials.7b00055. [DOI] [PMC free article] [PubMed] [Google Scholar]
- 50.Wang Z, Teoh SH, Hong M, Luo F, Teo EY, Chan JKY, Thian ES. ACS Appl Mater Interfaces. 2015;7:13445–13456. doi: 10.1021/acsami.5b02464. [DOI] [PubMed] [Google Scholar]
- 51.Ma SH, Lepak LA, Hussain RJ, Shain W, Shuler ML. Lab Chip. 2005;5:74–85. doi: 10.1039/b405713a. [DOI] [PubMed] [Google Scholar]
- 52.Kim MY, Li DJ, Pham LK, Wong BG, Hui EE. J Memb Sci. 2014;452:460–469. doi: 10.1016/j.memsci.2013.11.034. [DOI] [PMC free article] [PubMed] [Google Scholar]
- 53.Achyuta AKH, Conway AJ, Crouse RB, Bannister EC, Lee RN, Katnik CP, Behensky Aa, Cuevas J, Sundaram SS. Lab Chip. 2013:542–553. doi: 10.1039/c2lc41033h. [DOI] [PubMed] [Google Scholar]
- 54.Booth R, Kim H. Lab Chip. 2012;12:1784. doi: 10.1039/c2lc40094d. [DOI] [PubMed] [Google Scholar]
- 55.Mazzocchi AR, Man AJ, DesOrmeaux J-PS, Gaborski TR. Cell Mol Bioeng. 2014;7:369–378. [Google Scholar]
- 56.Kunze A, Lengacher S, Dirren E, Aebischer P, Magistretti PJ, Renaud P. Integr Biol. 2013;5:964. doi: 10.1039/c3ib40022k. [DOI] [PubMed] [Google Scholar]
- 57.Théry C, Zitvogel L, Amigorena S, Roussy IG. doi: 10.1038/nri855. [DOI] [Google Scholar]
- 58.Kalluri R. J Clin Invest. 2016;126:1208–1215. doi: 10.1172/JCI81135. [DOI] [PMC free article] [PubMed] [Google Scholar]
- 59.Phinney DG, Pittenger MF. Stem Cells. 2017;35:851–858. doi: 10.1002/stem.2575. [DOI] [PubMed] [Google Scholar]
- 60.Chamay A, Tschantz P. J Biomech. 1972;5:173–180. doi: 10.1016/0021-9290(72)90053-x. [DOI] [PubMed] [Google Scholar]
- 61.Schulte FA, Ruffoni D, Lambers FM, Christen D, Webster DJ, Kuhn G, Mu R. doi: 10.1371/journal.pone.0062172. [DOI] [PMC free article] [PubMed] [Google Scholar]
- 62.Ruff C, Holt B, Trinkaus E. Am J Phys Anthropol. 2006;129:484–498. doi: 10.1002/ajpa.20371. [DOI] [PubMed] [Google Scholar]
- 63.Engler AJ, Sen S, Sweeney HL, Discher DE. Cell. 2006;126:677–689. doi: 10.1016/j.cell.2006.06.044. [DOI] [PubMed] [Google Scholar]
- 64.Wang C, Baker BM, Chen CS, Schwartz MA. Arterioscler Thromb Vasc Biol. 2013;33:2130–2136. doi: 10.1161/ATVBAHA.113.301826. [DOI] [PMC free article] [PubMed] [Google Scholar]
- 65.Steward R, Tambe D, Hardin CC, Krishnan R, Fredberg JJ. Am J Physiol - Cell Physiol. 2015;308:C657–C664. doi: 10.1152/ajpcell.00363.2014. [DOI] [PMC free article] [PubMed] [Google Scholar]
- 66.Akhtar R, Sherratt MJ, Cruickshank JK, Derby B. Mater Today. 2011;14:96–105. doi: 10.1016/S1369-7021(11)70059-1. [DOI] [PMC free article] [PubMed] [Google Scholar]
- 67.Roan E, Waters CM. Am J Physiol Lung Cell Mol Physiol. 2011;301:L625–35. doi: 10.1152/ajplung.00105.2011. [DOI] [PMC free article] [PubMed] [Google Scholar]
- 68.Patel PN, Smith CK, Patrick CW. J Biomed Mater Res - Part A. 2005;73:313–319. doi: 10.1002/jbm.a.30291. [DOI] [PubMed] [Google Scholar]
- 69.Geerligs M, Peters GWM, Ackermans PAJ, Oomens CWJ, Baaijens F. Biorheology. 2008;45:677–688. [PubMed] [Google Scholar]
- 70.Maganaris CN, Paul JP. J Physiol. 1999;521(Pt 1):307–13. doi: 10.1111/j.1469-7793.1999.00307.x. [DOI] [PMC free article] [PubMed] [Google Scholar]
- 71.Rho JY, Ashman RB, Turner CH. J Biomech. 1993;26:111–119. doi: 10.1016/0021-9290(93)90042-d. [DOI] [PubMed] [Google Scholar]
- 72.Silver FH, Christiansen DL, Buntin CM. Crit Rev Biomed Eng. 1988;17:323–358. [PubMed] [Google Scholar]
- 73.Fung Y. Biomechanics: mechanical properties of living tissues. Springer Science & Business Media; 2013. [Google Scholar]
- 74.Martin RB, Burr DB, Sharkey NA, Fyhrie DP. Skeletal tissue mechanics. Vol. 190 Springer; 1998. [Google Scholar]
- 75.Woo SLY, Gomez MA, Akeson WH. Mechanical behaviors of soft tissues: Measurements, modifications, injuries and treatment. Norwalk: 1985. [Google Scholar]
- 76.Thompson AB, Woods DW. Trans Faraday Soc. 1956;52:1383–1397. [Google Scholar]
- 77.Soloukhin VA, Brokken-Zijp JCM, Van Asselen OLJ, De With G. Macromolecules. 2003;36:7585–7597. [Google Scholar]
- 78.Phani KK, Niyogi SK. J Mater Sci. 1987;22:257–263. [Google Scholar]
- 79.Gillmer SR, Fang DZ, Wayson SE, Winans JD, Abdolrahim N, DesOrmeaux JPS, Getpreecharsawas J, Ellis JD, Fauchet PM, McGrath JL. Thin Solid Films. 2017;631:152–160. [Google Scholar]
- 80.Wen JH, Vincent LG, Fuhrmann A, Choi YS, Hribar KC, Taylor-Weiner H, Chen S, Engler AJ. Nat Mater. 2014:1–21. doi: 10.1038/nmat4051. advance on. [DOI] [PMC free article] [PubMed] [Google Scholar]
- 81.Das RK, Gocheva V, Hammink R, Zouani OF, Rowan AE. Nat Mater. 2016;15:318–25. doi: 10.1038/nmat4483. [DOI] [PubMed] [Google Scholar]
- 82.Cosgrove BD, Mui KL, Driscoll TP, Caliari SR, Mehta KD, Assoian RK, Burdick JA, Mauck RL. Nat Mater. 2016;15:1297–1306. doi: 10.1038/nmat4725. [DOI] [PMC free article] [PubMed] [Google Scholar]
- 83.Mao Y, Schwarzbauer JE. Matrix Biol. 2005;24:389–399. doi: 10.1016/j.matbio.2005.06.008. [DOI] [PubMed] [Google Scholar]
- 84.Feinberg AW, Feigel A, Shevkoplyas SS, Sheehy S, Whitesides GM, Parker KK. Science (80- ) 2007;317:1366–1370. doi: 10.1126/science.1146885. [DOI] [PubMed] [Google Scholar]
- 85.Gopalan SM, Flaim C, Bhatia SN, Hoshijima M, Knoell R, Chien KR, Omens JH, McCulloch AD. Biotechnol Bioeng. 2003;81:578–587. doi: 10.1002/bit.10506. [DOI] [PubMed] [Google Scholar]
- 86.Li CY, Stevens KR, Schwartz RE, Alejandro BS, Huang JH, Bhatia SN. Tissue Eng Part A. 2014;20:2200–12. doi: 10.1089/ten.tea.2013.0667. [DOI] [PMC free article] [PubMed] [Google Scholar]
- 87.Luca AC, Faroni A, Downes S, Terenghi G. c. 2016;10:647–655. doi: 10.1002/term.1804. [DOI] [PubMed] [Google Scholar]
- 88.Matsuzaka N, Nakayama M, Takahashi H, Yamato M, Kikuchi A, Okano T. Biomacromolecules. 2013;14:3164–3171. doi: 10.1021/bm400788p. [DOI] [PubMed] [Google Scholar]
- 89.Cicotte KN, Reed JA, Nguyen PAH, De Lora JA, Hedberg-Dirk EL, Canavan HE. Biointerphases. 2017;12:02C417. doi: 10.1116/1.4984933. [DOI] [PMC free article] [PubMed] [Google Scholar]
- 90.Zhou B, Gao X, Wang C, Ye Z, Gao Y, Xie J, Wu X, Wen W. ACS Appl Mater Interfaces. 2015;7:17181–17187. doi: 10.1021/acsami.5b04032. [DOI] [PubMed] [Google Scholar]
- 91.Faia-Torres AB, Guimond-Lischer S, Rottmar M, Charnley M, Goren T, Maniura-Weber K, Spencer ND, Reis RL, Textor M, Neves NM. Biomaterials. 2014;35:9023–9032. doi: 10.1016/j.biomaterials.2014.07.015. [DOI] [PubMed] [Google Scholar]
- 92.Vernon RB, Gooden MD, Lara SL, Wight TN. Biomaterials. 2005;26:3131–3140. doi: 10.1016/j.biomaterials.2004.08.011. [DOI] [PubMed] [Google Scholar]
- 93.Deutsch J, Motlagh D, Russell B, Desai TA. J Biomed Mater Res. 2000;53:267–275. doi: 10.1002/(sici)1097-4636(2000)53:3<267::aid-jbm12>3.0.co;2-j. [DOI] [PubMed] [Google Scholar]
- 94.Peng SW, Li CW, Chiu IM, Wang GJ. Int J Nanomedicine. 2017;12:421–432. doi: 10.2147/IJN.S122017. [DOI] [PMC free article] [PubMed] [Google Scholar]
- 95.Esch MB, Sung JH, Yang J, Yu C, Yu J, March JC, Shuler ML. Biomed Microdevices. 2012;14:895–906. doi: 10.1007/s10544-012-9669-0. [DOI] [PubMed] [Google Scholar]
- 96.Wang Y, Gunasekara DB, Reed MI, DiSalvo M, Bultman SJ, Sims CE, Magness ST, Allbritton NL. Biomaterials. 2017;128:44–55. doi: 10.1016/j.biomaterials.2017.03.005. [DOI] [PMC free article] [PubMed] [Google Scholar]
- 97.Kuribayashi-Shigetomi K, Onoe H, Takeuchi S. PLoS One. 2012;7:1–8. doi: 10.1371/journal.pone.0051085. [DOI] [PMC free article] [PubMed] [Google Scholar]
- 98.Mengsteab PY, Uto K, Smith AST, Frankel S, Fisher E, Nawas Z, Macadangdang J, Ebara M, Kim DH. Biomaterials. 2016;86:1–10. doi: 10.1016/j.biomaterials.2016.01.062. [DOI] [PMC free article] [PubMed] [Google Scholar]
- 99.Moeller HC, Mian MK, Shrivastava S, Chung BG, Khademhosseini A. Biomaterials. 2008;29:752–763. doi: 10.1016/j.biomaterials.2007.10.030. [DOI] [PMC free article] [PubMed] [Google Scholar]
- 100.Selimovi S, Piraino F, Bae H, Rasponi M, Redaelli A, Khademhosseini A. Lab Chip. 2011;11:2325–2332. doi: 10.1039/c1lc20213h. [DOI] [PMC free article] [PubMed] [Google Scholar]
- 101.Fu J, Wang YK, Yang MT, Desai RA, Yu X, Liu Z, Chen CS. Nat Methods. 2011;8:184–184. doi: 10.1038/nmeth.1487. [DOI] [PMC free article] [PubMed] [Google Scholar]
- 102.Beussman KM, Rodriguez ML, Leonard A, Taparia N, Thompson CR, Sniadecki NJ. Methods. 2016;94:43–50. doi: 10.1016/j.ymeth.2015.09.005. [DOI] [PMC free article] [PubMed] [Google Scholar]
- 103.Carter RN, Casillo SM, Mazzocchi AR, DesOrmeaux J-PS, Roussie JA, Gaborski TR. Biofabrication. 2017;9:15019. doi: 10.1088/1758-5090/aa5ba7. [DOI] [PMC free article] [PubMed] [Google Scholar]
- 104.Odijk M, van der Meer AD, Levner D, Kim HJ, van der Helm MW, Segerink LI, Frimat JP, Hamilton GA, Ingber DE, van den Berg A. Lab Chip. 2015;15:745–752. doi: 10.1039/c4lc01219d. [DOI] [PubMed] [Google Scholar]
- 105.Gaborski TR, Snyder JL, Striemer CC, Fang DZ, Hoffman M, Fauchet PM, McGrath JL. ACS Nano. 2010;4:6973–6981. doi: 10.1021/nn102064c. [DOI] [PMC free article] [PubMed] [Google Scholar]
- 106.Striemer CC, Gaborski TR, McGrath JL, Fauchet PM. Nature. 2007;445:749–753. doi: 10.1038/nature05532. [DOI] [PubMed] [Google Scholar]
- 107.Kavalenka MN, Striemer CC, Fang DZ, Gaborski TR, McGrath JL, Fauchet PM. Nanotechnology. 2012;23:145706. doi: 10.1088/0957-4484/23/14/145706. [DOI] [PubMed] [Google Scholar]
- 108.Subramanian S, Seeram R. Desalination. 2013;308:198–208. [Google Scholar]
- 109.Zhu WP, Gao J, Sun SP, Zhang S, Chung TS. J Memb Sci. 2015;487:117–126. [Google Scholar]
- 110.Han Y, Jiang Y, Gao C. ACS Appl Mater Interfaces. 2015;7:8147–8155. doi: 10.1021/acsami.5b00986. [DOI] [PubMed] [Google Scholar]
- 111.Wang J, Gao X, Wang J, Wei Y, Li Z, Gao C. ACS Appl Mater Interfaces. 2015;7:4381–4389. doi: 10.1021/am508903g. [DOI] [PubMed] [Google Scholar]
- 112.Liang B, Zhan W, Qi G, Lin S, Nan Q, Liu Y, Cao B, Pan K. J Mater Chem A. 2015;3:5140–5147. [Google Scholar]
- 113.Khire TS, Nehilla BJ, Getpreecharsawas J, Gracheva ME, Waugh RE, McGrath JL. Biomed Microdevices. 2018;20:11. doi: 10.1007/s10544-017-0251-7. [DOI] [PMC free article] [PubMed] [Google Scholar]
- 114.DesOrmeaux JPS, Winans JD, Wayson SE, Gaborski TR, Khire TS, Striemer CC, McGrath JL. Nanoscale. 2014;6:10798–10805. doi: 10.1039/c4nr03070b. [DOI] [PubMed] [Google Scholar]
- 115.Cucullo L, Hossain M, Tierney W, Janigro D. BMC Neurosci. 2013;14:18. doi: 10.1186/1471-2202-14-18. [DOI] [PMC free article] [PubMed] [Google Scholar]
- 116.Wong AD, Ye M, Levy AF, Rothstein JD, Bergles DE, Searson PC. Front Neuroeng. doi: 10.3389/fneng.2013.00007. [DOI] [PMC free article] [PubMed] [Google Scholar]
- 117.Wang YI, Abaci HE, Shuler ML, Nancy E, Meinig PC B. Engineering. 2017;114:184–194. [Google Scholar]
- 118.Srinivasan B, Kolli AR, Esch MB, Abaci HE, Shuler ML, Hickman JJ. J Lab Autom. 2015;20:107–126. doi: 10.1177/2211068214561025. [DOI] [PMC free article] [PubMed] [Google Scholar]
- 119.Berg HC. Random walks in biology. Princeton University Press; 1993. [Google Scholar]
- 120.Whitaker S. Co; Melbourne, FL: [Google Scholar]
- 121.Dagan Z, Weinbaum S, Pfeffer R. Chem Eng Sci. 1983;38:583–596. [Google Scholar]
- 122.Mehta D, Malik AB. Physiol Rev. 2006;86:279–367. doi: 10.1152/physrev.00012.2005. [DOI] [PubMed] [Google Scholar]
- 123.Lee WL, Ph D, Slutsky AS. N Engl J Med. 2010;363:689–691. doi: 10.1056/NEJMcibr1007320. [DOI] [PubMed] [Google Scholar]
- 124.Sukriti S, Tauseef M, Yazbeck P, Mehta D. Pulm Vasc Reseach Inst. 2015;4:535–551. doi: 10.1086/677356. [DOI] [PMC free article] [PubMed] [Google Scholar]
- 125.Munson JM, Shieh AC. Cancer Manag Res. 2014;6:317–28. doi: 10.2147/CMAR.S65444. [DOI] [PMC free article] [PubMed] [Google Scholar]
- 126.Shamloo A, Ma N, Poo M, Sohn LL, Heilshorn SC. Lab Chip. 2008;8:1292. doi: 10.1039/b719788h. [DOI] [PubMed] [Google Scholar]
- 127.Marino A, Tricinci O, Battaglini M, Filippeschi C, Mattoli V, Sinibaldi E, Ciofani G. Small. 2017;1702959:1–9. doi: 10.1002/smll.201702959. [DOI] [PMC free article] [PubMed] [Google Scholar]
- 128.Montagne F, Blondiaux N, Bojko A, Pugin R. Nanoscale. 2012;4:5880–6. doi: 10.1039/c2nr31498c. [DOI] [PubMed] [Google Scholar]
- 129.Popa A-M, Niedermann P, Heinzelmann H, Hubbell Ja, Pugin R. Nanotechnology. 2009;20:485303. doi: 10.1088/0957-4484/20/48/485303. [DOI] [PubMed] [Google Scholar]
- 130.Kang C, Ramakrishna SN, Nelson A, Cremmel CVM, vom Stein H, Spencer ND, Isa L, Benetti EM. Nanoscale. 2015;7:13017–13025. doi: 10.1039/c5nr03147h. [DOI] [PubMed] [Google Scholar]
- 131.Klein MJK, Montagne F, Blondiaux N, Vazquez-Mena O, Heinzelmann H, Pugin R, Brugger J, Savu V. J Vac Sci Technol B J Appl Phys Phys Lett J Vac Sci Technol. 2011;29:21012–2599. [Google Scholar]
- 132.Lv H, Li N, Zhang H, Tian Y, Zhang H, Zhang X, Qu H, Liu C, Jia C, Zhao J, Li Y. Sol Energy Mater Sol Cells. 2016;150:57–64. [Google Scholar]
- 133.Wong HC, Zhang Y, Viasnoff V, Low HY. Adv Mater Technol. 2017;2:1600169. [Google Scholar]
- 134.Snyder JL, Clark A, Fang DZ, Gaborski TR, Striemer CC, Fauchet PM, McGrath JL. J Memb Sci. 2011;369:119–129. doi: 10.1016/j.memsci.2010.11.056. [DOI] [PMC free article] [PubMed] [Google Scholar]


