

Abstract
Medical diagnosis has been greatly improved thanks to the development of new techniques capable of performing very sensitive detection and quantifying certain parameters. These parameters can be correlated with the presence of specific molecules and their quantity. Unfortunately, these techniques are demanding, expensive, and often complicated. On the other side, progress in other fields of science and technology has contributed to the rapid growth of nanotechnology. Although being an emerging discipline, nanotechnology has raised huge interest and expectations. Most of the enthusiasm comes from new possibilities and properties of nanomaterials. Biosensors (simple, robust, sensitive, cost-effective) combined with nanomaterials, also called nanobiosensors, are serving as bridge between advanced detection/diagnostics and daily/routine tests. Here we review some of the latest applications of nanobiosensors in diagnostics field.
Keywords: Nanomaterials, nanobiosensors, biosensors, biomarkers, diagnostics
Introduction
In recent decades, medical diagnosis has been greatly improved, thanks to the development of new techniques capable of performing detection and quantification of specific molecules and components, the presence or absence of which give information about the physiological state of a living being. Previous to the discovery of such techniques, diagnostics were based on just observable parameters. However, solid data of presence/absence of substances or other parameters to support the diagnosis represent the possibility to perform more accurate forecasts and more robust studies of the situation of the patient. This possibility of gathering precise and solid information of the patient by measuring specific molecular components needs to be complemented by a deep knowledge of the principles related to the physiological state and the mechanism involved in the disorder or diseases. In other words, it is necessary to know which components should be measured and be able to make an interpretation of the results obtained regarding the situation of the patient. Biomarkers can be defined as parameters that can be objectively measured or evaluated in order to get either information of a physiologic/pathologic situation or a response to a therapeutic intervention.1 Although biomarkers can be physically measured (e.g., body temperature or thickness of a nerve fiber), most common biomarkers, the so-called molecular biomarkers, are measured biochemically.2 Usually molecular biomarkers are molecules biologically relevant for the intra- or intercellular function, and their expression or presence is altered by a nonregular situation or activity of a living entity. In medicine, the interest of biomarkers lays on the possibility to relate an altered parameter to a certain pathologic condition, for instance, overexpression of maternal superoxide dismutase to screen the potential risk of Down syndrome,3 prostate-specific antigen (PSA) as biomarker for prostate cancer,4 C-reactive protein as inflammation and cardiovascular risk biomarker,5 and so on.
Nowadays, thanks to the sophisticated equipment available in laboratories, it is possible to make very sensitive detection of a wide range of molecules.1 Techniques, such as 2-D gel electrophoresis,6 mass spectroscopy,7–9 and isotope-coded affinity tags,10 allow researchers to make detection of very small amounts of biomolecules under study. Furthermore, the cited techniques are not only able to perform detection but also capable of giving valuable information about other characteristics of the biomolecules under study, for instance, their modification states, conformation, or interactions with other molecules. The above-mentioned techniques are very sensitive, as they require the analyte in the proper context to carry out the detection; therefore, there is a need to treat the samples prior to the detection; these treatments involve mainly purification and concentration processes usually done by chromatography. These extra steps represent a huge drawback for the application of the techniques in real situations out of the lab and enormously limit the possibilities of processing high number of samples and its feasibility in terms of time and costs. Moreover, the experimental procedure has to be carried out by trained personnel with broad expertise in the field. The cited techniques represent important and remarkable tools for basic research studies. However, owing to the drawbacks cited, they do not represent an attractive possibility for routine diagnosis or research that requires wide screening of several samples. Hence, it is interesting to develop not only new devices for detecting certain molecules or components in patients but also new sensing techniques to allow researchers to carry out studies to improve or generate knowledge around the disease or miss function.
The already known and described biomarkers, together with new discoveries in the field of nature sciences, have raised the demand of analytical devices for detecting and measuring a wide range of analytes. Analytes with interest in different areas such as food quality control, bio-security, contaminants/pollutants and diagnosis. The functioning of these types of new devices depends on the reliable monitoring of parameters of interest for the proper control of the state of goods and environmental conditions (food and drinks, drugs, air and gases etc.), the physiological conditions of living entities (bacteria, cells, organs, plants, animals etc.), or drug control tests. Such close control would make early detection more feasible, preventing unwanted or hazardous situations. In particular, in the field of clinics, early detection of biomarkers even prior to manifestation of any symptom of the disease is essential for the successful medical treatment and patient survival rates.11,12 It is worth mentioning the huge interest behind the discovery of reliable biomarkers for early detection of cancer to allow the possibility of quick screening of the population sector at risk.13 In this context, the development of point-of-care (POC) testing devices has been growing in last years.14 These devices are defined as ‘testing at or near the site of the patient care’.15 The main point of this type of sensing is to achieve the in situ and immediate patient parameter testing in order to facilitate the evidence-based diagnosis. The final goal when developing a POC test is to match the ASSURED criteria: affordable, sensitive, specific, user friendly, robust, equipment free, and deliverable to those in need. Their characteristics aim to promote these tests to the general public. This criteria was set by the World Health Organization (WHO) which gives strong priority to the tests that fulfill the mentioned characteristics.16
Biosensors represent a group of analytical devices that can be adapted to match the characteristics requested for POC testing and ASSURED criteria. Biosensors are defined as analytical devices in which the recognition system is based on biochemical or biological mechanisms.17 Thanks to the high specificity of the biological recognition systems, biosensors are provided with a high selectivity tool for detecting the analytes. In general terms, biosensors consist of two integrated components18 as shown in Figure 1:
Figure 1.

General scheme of parts of a biosensor. It represents how an analyte captured by a receptor induces a change in the transducer’s surface. The transducer is the responsible for translating the capturing event into an electrical signal.
The receptor, usually a biological element such as enzymes, antibodies, DNA, microorganisms, tissues, or even synthetic molecules.
The transducer, part of the sensor that transforms the recognition event into a measurable signal which can be used for the quantification of the analyte.
When the recognition event takes places in the biosensor, a significant change occurs in the properties of the system so the transducer can read it and transform the perturbation into an electrical signal. In some cases, signal labels are necessary in the system to achieve this readable signal. This type of sensors is referred as label-based biosensors. Usually labels are organic molecules, nanoparticles (NPs), or proteins (proteins or enzymes) which can generate a fluorescent or electrochemical signal. The other alternative is the so-called label-free biosensors, in which the interaction between the target and the recognition element generates a change, physical or chemical, that can be directly read by the transducer and hence used by itself to monitor the interactions in the biosensor. As a general rule, label-free biosensors are the preferred possibility owing to the disadvantages associated with label-based sensors: the costs of both the labels themselves and labeling the recognition elements, the additional steps in the detection procedure, the alteration of the binding properties of the recognition element due to the attachment of the label, and the nonspecific signal issues associated with the labeling.19,20 Unfortunately, the main limitation of label-free assays is the lack of significant changes in recognizing the event of the target. In order to move forward in the field of label-free sensing, it is necessary to find new strategies in which the binding of the target can develop a significant change such as nanochannels blocking21,22 and so on. Another possibility is to improve the already existing transducers to be capable of reading even smaller changes related to the target recognition, for example, modifying the electrodes with nanomaterials or using the same nanomaterials as electrodes.22–26
Examples of most used assay formats in biosensing are shown in Figure 2. In the scheme antibodies are used to exemplify capturing agents. Despite being the most popular, several other components can be used as capturing agents, for instance, DNA short sequences, RNA, locked DNA, peptide nucleic acids, cell membrane receptors, organic molecules, and so on. As shown in Figure 2, antibodies are labeled with an enzyme or NPs responsible for generating the signal. Signal is generated by the enzyme in the presence of a substrate. Since the amount of labeled antibodies is correlated to the amount of antigen (analyte), the signal of the labels is used to quantify the antigen.28 Different types of assays are displayed in Figure 2a:
Figure 2.

Examples of types of assay in biosensors using antibodies as selective biomolecules. Antibodies are labeled with an enzyme or nanoparticles, which in the presence of such labels generate a signal. Therefore, the amount of labeled antibodies is correlated to the amount of antigen/analyte. (a) Displays a direct, indirect, capture (“sandwich”), and competitive assay. Labeled antibody and labeled antigen are used to perform detection and the read out. (b) Example scheme of magneto-immunoassay on magnetic particles. In the presence of the analyte in solution, they form magneto-immunosandwiches displayed on the right. (c) Examples of label-free biosensing assay. First, label-free assay, displaying the principle of detection. Below, examples of label-free biosensing using an indicator, typical detection principle used in electrochemical label-free biosensors. Part figure b is Adapted from the open-access reference.27
Direct assay: Antigen is directly absorbed on the surface where the biosensing is performed, a detection antibody against the antigen is used.
Indirect assay: Antigen absorbed on the biosensing platform substrate and a primary antibody is used as intermediate between the analyte and labeled antibody.
Capture assay “sandwich”: A capturing antibody is preimmobilized on the substrate surface, a sandwich with the analyte is formed between the capturing antibody and the detecting antibody. A labeled antibody against the detection antibody is used to detect the analyte.
Competitive assay: Artificial analyte or analogues to the analyte is externally labeled, analyte from the sample competes with these labeled pseudo-analytes to capture the antibody. Native analyte in the sample displaces the labeled analyte from the capturing antibodies, washing away the labeled antigen; in the example displayed, the amount of analyte in the sample is related to the decrease in signal of the assay.
Figure 2b, shows an example scheme of magneto-immunoassay on magnetic particles. The capturing antibody is immobilized on the magnetic beads, while the detection antibodies are labeled with nanoparticles. In the presence of the analyte in solution, they form magneto-immunosandwiches as the scheme. In Figure 2c examples of label-free biosensing assay are presented. First, label-free assay, displaying the principle of detection, consists of capturing the analyte. Below are provided examples of label-free biosensing using an indicator, and the presence of the analyte prevents the indicator from reaching the transducer, the typical detection principle used in electrochemical label-free biosensors.
Owing to the biosensor’s versatility and applicability in concrete situations of detection, this field has experienced a sensational growth.29 This fact shows the necessity to incorporate new discoveries from different fields in improving performance of biosensors, therefore allowing researchers to adapt biosensors based on the characteristics they are required for in each scenario.
Advances in different disciplines of science and technology have provided the necessary techniques and equipment, enabling to study matter at smaller levels and allowing researchers to work at nanoscale. Thanks to this, today the whole field of nanotechnology, as we know, has been established. Although being an emerging discipline, nanotechnology has raised huge interest and expectations among researchers due to the possibilities of application in other fields of science and technology. Most of this enthusiasm comes from the fact that matter behaves in a different way at the nanoscale than at the macroscale, hence new possibilities and properties may emerge from macroscale materials when structured at the nanoscale. Generally, nanomaterials are those whose size ranges from 1 to 100 nm. Their main advantages are related to their large surface to volume ratio, their physicochemical properties regarding composition, their shape, and the unusual binding characteristics. Nanomaterials can be classified into several groups: NPs, quantum dots (QDs), graphene, graphene oxide (GO), carbon nanotubes (CNTs), and nanochannels.
Several reviews in the literature confirm the broad possibilities and applications of nanomaterials improving the existing technologies. For instance, generating motility,30 catalysis,31 new biomaterials,32 and phototherapy against cancer,33 especially in the field of sensing; new labels in electrochemical34 and optical35 sensors, signal amplification in biosensors,36 detection directly with undiluted real samples,37 enhancing pesticide detection and degradation,24 heavy metal detection,38 and so on. In the field of biosensors, huge improvements have been achieved, the overall aim being to obtain smaller, more portable, more sensitive, and more robust analytical devices, thanks to nanomaterials. Combination of nanomaterials with biosensors used for either building or modifying them gives rise to the so-called “nanobiosensors,” a term introduced by Malik and coworkers.39 It is interesting to point out that the term does not refer to sensors specialized to detect nanoscale events but to those in which nanomaterials are used for building or modifying the sensor.
The main focus of this review is to provide a brief introduction to each nanomaterial and its corresponding state-of-the-art of how they are applied in the field of biosensors. Special importance is given to those sensing systems with potential application in clinical diagnostics in a relative short- to mid-term, thanks to being capable of detecting relevant molecules for diagnostics (biomarkers, pathogens etc.) in real/complex samples.
Nanoparticles
NPs are considered clusters of atoms or molecules ranging in size from 1 to 100 nm. Beside single materials,40 alloys41 or core shell NPs42 are also reported. Compositions of the NPs may range from metals (gold,43 copper,44 silver,45 iron,46 titanium dioxide47 etc.) to carbon48 or even polymers.49 Generally, NPs can present characteristic properties such as optical, electronic, magnetic, chemical, mechanical, and catalytic. Furthermore, a very interesting issue is the fact that these properties can be easily tuned by changing parameters of the NPs such as size, shape, and composition.50 In addition, more functionalities and properties can be introduced into NPs by tailoring different molecules (chemical or biological) on their surface. Together with the high surface to area ratio, NPs can be found in several situations, carrying out different roles: optical/electrochemical labels, catalyzers, immobilization platforms, phototherapy, and so on.
The most obvious and exploited characteristic of NPs is their optical properties, mainly those related to their color, which is different from the typical color that the material shows in bulk, thanks to plasmons. Plasmons can be defined as an oscillation of the free electron cloud with respect to the fixed position of the atoms in the lattice that conforms the material51,52; when light is incident on NPs, electrons in the conduction band will show collective oscillation due to its interaction with the specific resonant wavelength. These oscillations are also called “localized surface plasmons.” Depending on the size, shape, ligands on the surface, and composition of the nanoparticle, the scattering would be at certain wavelengths. Thanks to this phenomenon, NPs can scatter light at a specific wavelength range, which gives the NPs their characteristic color.53,54 These properties have been exploited by applying NPs as optical reporters in two main ways (see Table 1). First, with the direct use of the NPs as labels, NPs are modified with a specific capturing agent against the analyte; and due to the interaction with the analyte, NPs are accumulated, and the presence of analyte is correlated with the accumulation of NPs, which are usually read by the color intensity specific of the nanoparticle. This principle of detection has been remarkably exploited in paper-based nanobiosensors using gold nanoparticles (AuNPs),69 especially in the case of lateral flow immunoassays (LFIAs).70 Second, the alteration in the plasmon oscillation due to the interaction with the analyte and the consequent change in the color of the nanoparticles.53,54
Table 1.
Biosensing with nanoparticle-based optical methods.
| Biomarker/analyte | Type of nanoparticle | LOD/LR | Detection principle; sample | Ref |
|---|---|---|---|---|
| Adenosine (biological cofactor) | Magnetic NPs (commercial) | 1.5 µM / 1.5 µM–19.3 mM | Magnetic NPs–DNA–adenosine aptamer. Adenosine competes for the aptamer, the ssDNA can bind to DNA-GOx probes. Paper-based biosensor, quantitative naked eye reading of the signal; human serum samples. | 55 |
| Breast cancer cells | NiONPs | 136 cells mL−1 / 500–40,000 cells mL−1 | SPR detection of NiONPs conjugated to a peptide specific for breast cancer cells; cell culture samples. | 56 |
| Cholesterol | AuNPs | 100 ng mL−1 / 160–600 ng mL−1 | Ligand immobilized on the AuNPs induces aggregation in the presence of cholesterol; standards in buffer. | 57 |
| Cathepsin – G. (periodonitis biomarker) | Commercial magnetic nanoparticles. | 1 fg mL−1 / - - | Magnetic NPs immobilized on plated gold masking the gold. Activity of the analyte cleaves connection of NPs to the gold. The developing of gold is related to the amount of analyte; saliva samples. | 58 |
| Dengue, yellow fever and Ebola | Multicolored silver nanoparticles | 150 ng mL−1 (the three of them) | LFIA. Proved the viability for the multiplexed detection of all three analytes in one assay; human serum samples. | 59 |
| DNA from HIV | AgNPs | 0.195 pmol mL−1 /0.3–2 pmol mL−1 | Sandwich assay using AgNPs. Aggregation induced by the presence of the target sequence results in color change; HIV standards in buffer. | 60 |
| HNE (Periodonitis biomarker) | Commercial magnetic nanoparticles. | 1 pg mL−1 / - - | Magnetic NPs immobilized on plated gold masking the gold. Activity of the analyte cleaves connection of NPs to the gold. The developing of gold is related to the amount of analyte; saliva samples. | 58 |
| Melamine | AuNPs | 17.1 pg mL−1 / 0.05–1 ng mL−1 | Presence of the analyte prevents AuNPs from catalyzing the degradation of fluorescent dyes; milk samples. | 61 |
| Hg2+ ions | Gold nanoclusters | 8.6 nM / 37.5 nM–3.75 µM | Alteration of fluorescence due to aggregation induced by the analytes. Turn off sensing for Hg2+ detection and turn on for OTC; human serum samples. | 62 |
| miRNAs from cancer cells | Fe3O4@Ag magnetic nanoparticles | 0.3 fM / 1 fM–1 nM | Fe3O4@AgNPs with a DNA-Cy3, miRNA hybridizes to the DNA-Cyt, nuclease cleaves the DNA releasing the Cy3, reducing the SERS signal; cell culture extracts. | 63 |
| miRNAs | AuNPs | 5 pM / 10–200 pM | DNA labeled in 5’ with fluorescein, and by 3’ to AuNPs. Analyte complementary to DNA, DSN cleaves the duplex, increasing the fluorescence of the sample; cell culture extracts. | 64 |
| OTC | Gold Nanoclusters | 0.15 µM / 0.375–12.5 µM | Alteration of fluorescence due to aggregation induced by the analytes. Turn off sensing for Hg2+ detection and turn on for OTC; human serum samples. | 62 |
| PGF (breast cancer biomarker) | Gold nanodots and AuNPs | 0.25 nM / 0.5–5 nM | Competitive assay. Fluorescence recovery due to the presence of analyte; cell culture supernatant and urine samples. | 65 |
| PTHLH | AuNPs | 1.42 ng mL−1 / 2–100 ng mL−1 | LFIA. Detection of PTHLH; cell culture medium, cell culture lysates and in human serum samples. | 66 |
| PSA | AuNPs | Qualitative | Protein corona formation of AuNPs. Early stage screening technique. DLS, not a quantitative method; human serum samples. | 67 |
| PSA | AuNPs | 3 pg mL−1 / 0.005–5 ng mL−1 | Label-free detection. When PSA binds the antibodies on AuNPs electroluminescence changes; human serum samples. | 68 |
AuNPs: gold nanoparticles; AgNPs: silver nanoparticles; PSA: prostate-specific antigen; Hg2+ ions: mercury (II) ions; HNE: human neutrophil elastase; LFIA: lateral flow immunoassay; NPs: nanoparticles; NiONPs: nickel oxide nanoparticles; DNA-GOx: glucose oxidase; DLS: dynamic light scattering; Fe3O4: iron (III) oxide; LFIA: lateral flow immunoassay; LOD: limits of detection; LR: linear range; PGF: platelet-derived growth factor; SPR: surface plasmon resonance; SERS: surface-enhanced Raman spectroscopy; GO: graphene oxide; PTHLH: parathyroid hormone–like hormone; OTC: oxytetracycline.
Besides the color signal achieved due to the plasmon absorption phenomena, a fluorescent signal can be obtained from NPs. When the size of the nanoparticle is reduced, the continuous density of states allows plasmons disappear, and hence there is a confinement of their free electrons leading to quantum transitions responsible for fluorescence.71,72 Size of the clusters plays a key role in the transition from plasmons to fluorescence emission, for instance, 2 nm is the critical diameter below which fluorescence emission of gold and silver nanoclusters will take place.71 Still, the main challenge in this particular field is the proper synthesis of the small nanoclusters with intense fluorescence signals. Although fluorescent, NPs will be discussed in the section on quantum dots/colloidal semiconductors nanocrystals. Fluorescent AuNPs represent a particular case in the literature, usually referred to as gold nanoclusters or gold nanodots, they are neither generally included in QD classifications nor referred to as QDs. As a consequence, gold nanoclusters are included within the section of nanoparticles.
Electroactive properties of nanoparticles toward certain reactions have been widely exploited in biosensing. In electrochemical sensors, NPs can be detected by direct or indirect electrochemical detection. In the former, NPs are detected by their own redox properties; therefore, they can be detected without any preliminary step, meaning that the metal forming the NPs is electrically detected in a direct mode. As a strong point, direct detection offers rapid responses with reasonable limits of detection (LOD), short analysis time, and the possibility to perform a compact/integrated assay.73 On the other hand, indirect electrochemical detection exploits the electrocatalytic properties of the AuNPs. As electrocatalyst, nanoparticles take part in the catalysis and contribute to the electron transfer between the electrode and the reagents involved. However, an alternative procedure to perform indirect electrochemical detection is the preliminary oxidative dissolution of the AuNPs in acidic medium followed by the detection of the metal ions released from the particle. Electrochemical signal from NPs can be easily monitored by electrochemical means such as chronoamperometry, differential pulse voltammetry, square wave voltammetry, electrochemical impedance spectroscopy, and so on. Thanks to the amplification nature of these procedures, low LOD, in order of pM have been achieved73(Table 2).
Table 2.
Nanoparticle-based electrical methods for biosensing.
| Biomarker/analyte | Type of nano-particle | LOD/LR | Detection principle; sample | Ref |
|---|---|---|---|---|
| AFP | AgNPs and CNTs | 0.061 pg mL−1 /0.1–5,000 pg mL−1 | AgNPs modified with antibody are loaded on CNTs. Capture “sandwich assay” is performed. Detection of Ag by SV; human serum samples. | 74 |
| ApoE (Alzheimer biomarker) | Iridium oxide NPs | 7nM / 0.7–35 nM | Magneto-immunosandwich using iridium oxide NPs as label, CA; human plasma samples. | 75 |
| ApoE | AuNPs | 80 pg mL−1 /100–12,500 pg mL−1 | Magneto immunosandwich on porous silica beads, using AuNPs as labels. CA reading of HER catalyzed by the AuNPs; cerebrospinal fluid samples. | 76 |
| Antibodies anti Hepatitis B virus | AuNPs | 3 mlU mL−1 / - - | Magneto immunosandwich on magnetic silica beads. CA reading of AuNPs by HER catalyzed; human serum. | 77 |
| Beta amyloid | AuNPs | 19 pg mL−1 /20–12,500 pg mL−1 | Magneto immunosandwich on porous silica beads, using AuNPs as labels. CA reading of HER catalyzed by the AuNPs; cerebrospinal fluid samples. | 76 |
| Apo-A1 (biomarker of risk of cardiovascular disease) | AgNPs and AuNPs | 0.02 pg mL−1/0.1 pg mL−1– 50 ng mL−1 | AgNP conjugated to labeling antibody and AuNPs to capture antibody on a screen printed carbon electrode. Detection of Ag by SV; mg mL−1 LOD for human serum samples. | 78 |
| Breast cancer biomarkers | AuNPs | 1.72 fM / 0.05–1000 pM | Label-free detection of cancer biomarker-related sequences. EIS using a redox indicator; human serum samples. | 79 |
| CEA | AgNPs and CNTs | 0.093 pg mL−1 /0.1–5000 pg mL−1 | AgNPs modified with antibody are loaded on CNTs. Capture “sandwich assay” is performed. Detection of Ag by SV; human serum samples. | 74 |
| Cortisol (biomarker of physiological conditions) | AuNPs | 10 pg mL−1 / 0.03–10,900 ng mL−1 | Aptamers against cortisol on AuNPs electrodeposited on graphene-modified GCE. Competitive assay using an electroactive analogue of cortisol detected by SWV; serum and saliva samples. | 80 |
| IgG | AuNPs | 0.31 ng mL−1/2–500 ng mL−1 | Capture assay using AuNPs as label. AuNPs read by EIS; IgG standards in buffer. | 81 |
| Leishmania kinetoplast DNA | AuNPs | 0.8 parasites per 1 mL of animal blood | Capture assay (magneto sandwich), capturing sequence on magnetic beads and detection sequence labeled with AuNPs, CA reading; amplified DNA extracted from blood. | 82 |
| miRNA-21 | SiO2-PLL-Au | 6.3 fM (0.02–120 pM) | SiO2-PLL-AuNPs conjugated to Fc molecules through a DNA. miRNA binds to the DNA pulling the Fc away from the SiO2-PLL-AuNPs, recovering ECL; human serum samples. | 83 |
| miRNA -141 | SiO2-PLL-Au | 8.6 fM (0.03–150 pM) | SiO2-PLL-AuNPs conjugated to Fc molecules through a DNA. miRNA binds to the DNA pulling the Fc away from the SiO2-PLL-AuNPs, recovering ECL; human serum samples. | 83 |
| Muc1 (tumor biomarker) | AuNPs | 0.1 nM / 1–10 nM | Aptamer on gold electrode with to a DNA-AuNP complex. Analyte competes for the aptamer and displaces the complex, modifying the interphase impedance; human serum samples. | 84 |
| CYFRA-21 -1 (tumor biomarker) | ZrO2 – rGO | 0.122 ng mL−1 (2–22 ng mL−1) | ZrO2 rGO electrodeposited on the sensor and modified with the antibodies. In presence of redox indicator analyte modifies DPV spectra; saliva samples. | 85 |
| PSA | PtNPs | 1 ng mL−1 /1–30 ng mL−1 | Capture assay, detection antibodies conjugated to PtNPs, capture on a gold electrode. Signal related to the current generated by the electrocatalysis of PtNPs toward H2O2; PSA standards in buffer. | 86 |
| Telomerase activity (tumor biomarker) | PtNPs | 100 cells mL−1 /5·102–1·107 cells mL−1 | GCE surface modified with a primer for telomerase activity. DNA-modified PtNPs bind to the telomerase elongated sequence. LSV using as redox indicator; cell extracts samples. | 87 |
AFP: α-fetoprotein; AgNPs: silver nanoparticles; ApoE: apolipoprotein E; Apo-A1: apolipoprotein A-1; AuNPs: gold nanoparticles; CNTs: carbon nanotubes; CEA: carcinoembryonic antigen; CA: chronoamperometry DPV: differential pulse voltammetry; ECL: electrochemiluminiscence; EIS: electrochemical impedance spectroscopy; Fc: ferrocene; GCE: glassy carbon electrode; IgG: human immunoglobulin; H2O2: hydrogen peroxide; HER: hydrogen evolution reaction; LOD: limits of detection; LR: linear range; LSV: linear sweep voltammetry; Muc 1: Mucin 1; miRNA: micro RNA; NPs: nanoparticles CYFRA-21 -1: oral cancer biomarker: cytokeratin-19; PSA: prostate-specific antigen PtNPs: platinum nanoparticles; rGO: reduced graphene oxide; SiO2-PLL-Au: silica–poly-l-lysine and AuNPs; ssDNA: single-stranded DNA; SWV: square wave voltammetry; SV: stripping voltammetry; ZrO2: zirconium dioxide.
Magnetic properties of NPs have been also exploited for performing detection in the field of biosensing (Table 3). Magnetic properties make possible to perform distance manipulation, thanks to applying external magnetic fields, giving several possibilities related to the localization or retention of the NPs in specific sites. Examples of these properties are the widely used protocols for purification and preconcentration of magnetic NPs.97–99 Here the biomolecule assemblies are built onto the surface of the magnetic particles, forming the so-called magneto-immunosandwiches when the detection is antibody based. In these situations, despite using magnetic particles, the magnetic properties are used merely for sample pretreatment, but they do not take part in the measurement. Nevertheless, magnetic properties of the nanoparticles can be exploited to obtain a signal or analytical value which can be used in detection.100 These approaches are based on two main strategies. The first and more direct is the reading of magnetic signal from the nanoparticles acting as a label; special sensors for magnetic reading are in need for this type of measurement,101 and fortunately they neither represent a technical limitation nor represent a demanding equipment, allowing researchers to develop biosensors based on this principle of detection.102 And the second is based on the modification of relaxation times in presence of the analyte,103 in most assays the analyte induces aggregation of magnetic NPs, which responsible for the relaxation time modification. Typical equipment employed in the detection of magnetic nanoparticles are giant magneto-resistive sensors, magnetic tunnel junction sensors, and superconduction quantum interference device.99 Magnetic measurements offer the advantage of noninvasive data acquisition, giving the chance to perform in vivo measurements of magnetic NPs directly in cultures or tissues. Besides, unlike in electrical and optical measurements, there is a lack of interferences coming from components of biological systems, regarding the magnetic properties. As a consequence, these types of measurements make feasible to perform in vivo detection through the skin in complex biological scenarios.
Table 3.
Biosensing with nanoparticle-based magnetic methods.
| Biomarker/ analyte | Type of nanoparticle | LOD/LR | Detection principle; sample | Ref |
|---|---|---|---|---|
| α-Thrombin | Au layer grown on Fe3O4 magnetic NPs | 1 nM / 1.6–30.4 nM | Fe3O4@AuNPs modified with two different aptamer aggregated in the presence of thrombin changing T-2 relaxation time; AFP; α-Thrombin standards in buffer. | 88 |
| AFP (tumor biomarker) | Fe3O4 magnetic NPs (Dynabeads) | 1 pg mL−1 / 1–10 ng mL−1 | Analyte captured on the sensor surface detected with antibody-modified magnetic beads; AFP standards in buffer. | 89 |
| CRP | Dynabeads Myone (commercial magnetic NPs) | 1 ng mL−1/ 1–10 ng mL−1 | Capture sandwich, using magnetic nanoparticles as label. Detection based in giant magneto; CRP standards in buffer. | 90 |
| CA72-4, (gastric cancer biomarker) | Fe3O4 | 0.38 IU mL−1 / 0- 100 IU mL−1 | LFIA using the magnetic nanoparticles as label. Quantification performed using a magnetic assay reader; human serum samples. | 91 |
| cTnI (biomarker for myocardial infarction) | Commercial magnetic NPs | 1.43 pg mL−1 / 1.43–1000 pg mL−1 | Capture assay, immunosandwich on electrodes surface. Magnetic NPs as labels; NT-proBNP standards in buffer; CTnl standards in buffer. | 92 |
| DNA short sequences from HPV | Fe2O3 NPs covered by dextran | <1 pM / - - | Capture assay, sandwich, using DNA, magnetic NPs – streptavidin and biotin-DNA; PCR-amplified products in buffer. | 93 |
| hCG | Commercial magnetic NPs (magnetic nanotags) | 2.4 pM / - - | Immunosandwich on surface using magnetic NPs as labels. Detection performed using giant magnetoresistive sensor; serum samples diluted 50%. | 94 |
| mRNA | Iron oxide magnetic NPs | 1 Copy in 1 µg of mRNA | DNA specific against analyte on the magnetic NPs. Analyte induced aggregation, modifies T2 relaxation; cell extract samples. | 95 |
| NT-proBNP, (risk factor of coronary disease) | Commercial magnetic NPs | 0.33 pg mL−1 / 0.33–500 pg mL−1 | Capture assay, immunosandwich on electrodes surface. Magnetic NPs as labels; NT-proBNP standards in buffer. | 92 |
| S. enterica | Magnetic beads | 102 cfu mL−1 / 102–108 cfu mL−1 | Presence of analyte triggers the immunoreaction with the antibodies on the magnetic nanoparticles, altering the transversal relaxation (T2); milk samples. | 96 |
| TNF-α | Magnetic iron NPs (magnetic nanotags) | 5.7 pM / - - | Immunosandwich on surface using magnetic NPs as labels. Detection performed using giant magnetoresistive sensor; serum samples diluted 50%. | 94 |
AFP: α-fetoprotein; CRP: C-reactive protein; Fe3O4: iron (III) oxide; hCG: human chorionic gonadotropin; HPV: human papillomavirus; LFIA: lateral flow immunoassay; LOD: limits of detection; LR: linear range; mRNA: messenger RNA; NPs: nanoparticles; NT-proBNP: N-terminal pro-brain natriuretic peptide; S. enterica: Salmonella enterica; TNF-α: tumor necrosis factor-α.
Quantum dots
Colloidal semiconductor nanocrystals, which also receive the name of quantum dots, are small crystalline particles with sizes ranging from 1 and 100 nm dispersed in a solvent, thanks to the help of a stabilizing ligand on their surface. QDs present fluorescent properties with enormous applicability in the field of sensing and imaging. The size and shape of QDs determine their optical and electrical properties, therefore QD’s properties can be engineered by changing the size of the crystals, without need to change the chemical composition.104 In semiconductors, the gap energy can be understood as the energy required to excite an electron from the valence band to the conduction band (see Figure 3). As a consequence, this energy gap determines both the absorption of photons capable to excite electrons from the valence band to the conduction band (excitation wavelength) and the fluorescence emitted by the electrons which relax back to the valence band (emission wavelength). The smaller the particle is, the band structure is shifted to higher energy by the quantum confinement effect,105,106 hence the emission of an excited electron would be at lower wavelengths.107
Figure 3.

Representation of electronic energy states of different size colloidal nanocrystals. Conduction bands (CBs), valence band (VB), and energy gap (Eg) are represented.
Generally, QDs are composed of an inorganic core, which contains between few hundred to thousands of atoms. Surrounding this core an outer layer of surfactant molecules acts as ligand, helps stabilization, and acts as passivation agents. Passivation of the surface of QDs plays a key role in avoiding nondesired relaxation pathways,108 ensuring a good quantum yield. In order to improve this passivation of QDs, a shell of a second semiconductor is overgrown onto the surface of the first, resulting in the conformation of a core/shell systems. This new type of QDs presents an enhanced fluorescence efficiency and better stability against photo-oxidation.108 Usually composition of core/shell QDs are expressed as component1@component2 where component 1 is the material of the core and component 2 the material of the shell. Several materials have been successfully applied in the fabrication of QDs: CdS,109 CdSe,109 CdTe,109 ZnSe,110 ZnSe,111 CdSe@ZnS,112 CdSe@CdS,113 and so on.
In order to be applied in biosensing, QDs need to be functionalized with the specific molecules necessary to perform the specific recognition. For such purpose, QDs should present a coating compatible with the molecules to be anchored onto their surface. These coatings are usually polymers—polyethylene glycol, polysaccharides, and so on—or bifunctional organic molecules, with an anchoring and a functional group at the end of the molecules.114 Noncovalent conjugation represents an interesting immobilization strategy due to its simplicity, in these approaches biomolecules were attached to the QD surface by electrostatic interaction. Other reported noncovalent binding is based on the modification of the biomolecules with a group that displaces the capping ligand and binds directly to the QD surface, thiol groups being the most extended examples.115 Moreover, the possibility to conjugate streptavidin on QDs meant the consolidation of QDs as an entity for universal immobilization of biomolecules, thanks to the widely applied immobilization through the streptavidin–biotin method.116,117
An important aspect in molecular biology is the understanding of interactions and localizations of different biological components either in in vitro or in in vivo situations. In order to study this, optical labels which allow the direct observation have come to be of special interest for researchers. QDs, thanks to their optical properties, can be successfully applied as labels for sensing and imaging. In fact, QDs present important advantages which make them a good choice compared to traditionally used organic dyes: high quantum yield and molar extinction coefficient, broad absorption with narrow symmetric emission spectra, large effective Stokes shift, high resistance to photobleaching, and high resistance to photo and chemical degradation.118 QDs have been applied to in vitro sensing as fluorescent and electrochemical label in multiple type of assays. Typically, QDs have been applied as substitutes of the fluorescent labels in traditional assays in regular sandwich assays: direct/indirect, competitive, and so on. Furthermore, QDs can interact with certain molecules in such a way that the resulting fluorescence emission is affected; this modulation can be used with sensing and biosensing purposes. QDs have been extensively applied in detection based on Föster resonance energy transfer (FRET); briefly, it is a phenomenon that takes place between two components. An acceptor is excited due to light absorption, and by FRET process it transfers the energy to the emitter, which reaches an excited state and relaxes the emitting fluorescence (see Figure 4). Depending on the QDs and the situation, they can act as either donors or acceptors. Modulation of FRET process by action of an analyte is used as the detection principle. Similar detection principles are based on the use of quenchers that fade the fluorescent emission of the QD. The modulation of the quenching activity by the presence of the analyte represents an alternative detection principle.
Figure 4.

Representation of fluorescence and FRET processes through Jablonsky diagrams. Left, situation of excitation and fluorescence relaxation process of a fluorophore. Right, emission phenomena through FRET process, the excited donor, thanks to the proximity, and the acceptor can relax through FRET exciting the acceptor which will relax through a fluorescence process emitting light at a different wavelength than the emission of the donor in a regular fluorescent process. FRET: Föster resonance energy transfer.
First example of protein detection using QDs was reported by Chan and Nie and coworkers,117 and in this work detection was based on agglutination of modified QDs caused by the analyte. Since then QDs have been applied in other regular types of assays (Table 4) such as detection on nitrocellulose membranes,139 Western blot,140 lateral flow,141 and even ELISA multiwell plate tests.142 Although electrochemical detection of QDs has not reached such a high impact and popularity as fluorescence-based assays, it still represents an interesting and useful approach with regard to its possibilities to be miniaturized and integrated within portable device.143 Several examples of successful reports can be found in the literature.122,144 QDs have also proved their feasibility to be used in electroluminescence (EL) and photoelectrochemistry (PE).145
Table 4.
Biosensing with quantum dots–based biosensors.
| Analyte | Type of QDs | LOD/LR | Detection principle; samples | Ref |
|---|---|---|---|---|
| AFP (tumor biomarker) | Mn-doped ZnS QDs | 4.8 pg mL−1 / 5–1000 pg mL−1 | MIP using α-fetoprotein as template synthetized on the QDs surface. Recognition enhances QDs’ fluorescence; human serum samples. | 119 |
| AFP | CdTe@CdS | 250 fM / 0.250–2500 pM | Regular capture assay, immunosandwich, in a µfluidic system, plastic surface; human serum samples. | 120 |
| ApoE (Alzheimer biomarker) | CdSe@ZnS | 62 pg mL−1 / 0.062–100 ng mL−1 | µArray on glass substrate. QDs show better fluorescence performance than organic dyes; diluted human serum samples. | 121 |
| ApoE | CdSe@ZnS | 12.5 ng mL−1 / 10–200 ng mL−1 | Magneto-immunosandwich in PDMS µchannels. SWV measurement of Cd2+ ions released from the quantum dots dissolution in acidic media; diluted human plasma. | 122 |
| Aβ 1-42 (Alzheimer biomarker) | CdSe/ZnS | 0.2 nM / 0.5–8 nM | QDs linked to magnetic beads via immunocomplex with the analyte. Precipitation of magnetic complexes decrease the fluorescence in the supernatant; human cerebrospinal fluid samples. | 123 |
| CA 19 (tumor biomarker) | ZnO | 0.04 U mL−1 / 1–180 U mL−1 | Capture assay, immunosandwich on silicon, ZnO QDs modified with antibody. Fluorescence and electrochemical reading; buffer samples. | 124 |
| CA 125 (tumor biomarker) | ZnS | 0.005 U mL−1 / 0.008–60 U mL−1 | Capture assay. Analytes captured on magnetic beads, dendrimers modified with the antibody and loaded with QDs. SV detection of each QD; human serum samples. | 125 |
| CA 15-3 (tumor biomarker) | CdS | 0.003 U mL−1 / 0.01–80 U mL−1 | ||
| CA 19-9 (tumor biomarker) | PbS | 0.002 U mL−1 / 0.01–60 U mL−1 | ||
| CEA (tumor biomarker) | CdTe@CdS | 250 fM /0.250–2500 pM | Regular capture assay, immunosandwich, in a µfluidic system, plastic surface; human serum samples. | 120 |
| CEA | CdSe@ZnS | 1 ng mL−1 / 10–100 ng mL−1 | Capture assay, immunosandwich on polystyrene beads, QDs as fluorescent labels; human serum samples. | 126 |
| CRP | PbS | 0.05 ng mL−1 / 0.2–100 ng mL−1 | Capture immunoassay on a Bismuth modified SPE, PbS QDs as labels. SV detection of PbII ions released by acidic dissolution of QDs; human serum samples diluted 1:500. | 127 |
| EGFR (tumor biomarker) | CdSe@ZnS or InGaP | 0.18 nM | Capture assay, immunosandwich. Tb-complex and QDs. Sandwich formation induce FRET process between Tb-Complex and QD; human serum samples. | 128 |
| hsa-miR-20a-5p, hsa-miR-20b-5p, and hsa-miR-21-5p. (tumor biomarkers) | CdSe@ZnS | 0.2nM / 0.2–20 nM | miRNA stabilize the interaction of QDs with DNA probe labeled with Lumi-Tb complexes, these complexes show FRET; human serum samples diluted at 10%. | 129 |
| MMP-2 (tumor biomarker) | CdTe and CdTeS | Imaging screening of metastatic tumor cells | MMP-2 activity induces the fluorescence recovery by cleaving a FRET acceptor attached to the QD; imaging in vitro (cell cultures) and in vivo (mice). | 130 |
| miRNA-141 (prostate cancer biomarker) | CdSE@ZnS | 0.28 pM / - - | QDs conjugated to quencher through ssDNA which binds to miRNA-141. DNS cleaves the DNA-miRNA, ending the quenching. Signal amplification by telomerase activity generating chemiluminiscence in presence of hemin; human serum samples. | 131 |
| NSE (lung cancer biomarker) | CdSe@ZnS | 1 ng mL−1 / 3–100 ng mL−1 | Capture assay, immunosandwich on polystyrene beads, QDs as fluorescent labels; human serum samples. | 126 |
| Progesterone (reproductive function indicator) | CdSe@ZnS | 0.21 ng mL−1 / 0.385 – 4.55 ng mL−1 | QDs with antibodies immobilized on the bottom of a multiwell plate. Detection by change in fluorescence upon analyte capture; human serum samples. | 132 |
| PSA | CuS | 0.1 pg mL−1 / 0.5–50·103 pg mL−1 | Capture immunoassay on indium tin oxide with CNTs using QDs as labels, which catalyze oxidation of a substrate into a fluorescent product; human serum samples. | 133 |
| PSA | CdSe@ZnS | 1.6 ng mL−1 / 1.6–480 ng mL−1 | FRET assay, Tb as donors and QDs acceptors. Immunosandwich between Tb and QD, when brought close they show FRET; human serum samples. | 134 |
| S100B (biomarker for brain injury) | CdSe@(Cd, Zn)S | 10 pg mL−1 / 0.01–10 ng mL−1 | Capture assay: Magneto Immunosandwich capturing S100B between magnetic beads (immobilization platform) and quantum dots. Fluorescence reading; human serum samples. | 135 |
| sCD40 L biomarker or CVD | - - | 5 ng mL−1 / 5–166.7 ng mL−1 | Capture assay, magneto-immunosandwich. Capturing sCD40 L between magnetic beads and QDs (fluorescence reading); sCD40 L standards in buffer. | 136 |
| Type A influenza virus H5 and H9 subtypes | CdSe@ZnS | For H5 0.016 HAU, for H9 0.25 HAU | Single lateral flow assay for both subtypes at the same time; human serum samples. | 137 |
| VEGF165 | ZnS | 0.08nM / 0.1–16 nM | QD–aptamer for VEGF165. Quencher–ssDNA forms duplex with the aptamer. Analyte competes for the aptamer recovering fluorescence. AgNPs used to enhance QD signal; human serum samples. | 138 |
AFP: α-fetoprotein; Aβ 1–42: amyloid β peptide 1–42; ApoE: apolipoprotein E; CdS: cadmium sulfide; CdSe: cadmium selenide; CNTs: carbon nanotubes; CuS: copper sulfide; CEA: carcinoma embryonic antigen; CVD: cardiovascular disease; DNS: duplex-specific nuclease; EGFR: epidermal growth factor receptor; FRET: Föster resonance energy transfer; HAU: hemagglutinating units; LOD: limits of detection; LR: linear range; MMP-2: matrix metalloproteinase-2; MIP: molecular imprinted polymer; NSE: neuron-specific enolase; PbS: lead sulfide; PDMS: polydimethyl siloxane PSA: prostate-specific antigen; QDs: quantum dots; SPE: screen printed electrode; SV: stripping voltammetry; SWV: square wave voltammetry; VEGF165: vascular endothelial growth factor 165; ZnS: zinc sulfide.
Graphene, graphene oxide, and carbon nanotubes
These types of carbon nanostructures share an atomic configuration of sp2 hexagonal networks resulting in one atom thick planar structures, which make them share remarkable properties146 such as high specific surface area, extraordinary electronic properties, good electron transport capabilities, pliability and impermeability, mechanical strength, and excellent thermal and electrical conductivities.147,148 Although they all share the same honeycomb basic atomic disposition (see Figure 5), their space disposition is different. Graphene presents a planar structure,149,150 which is mostly used in the form of flakes since obtaining relatively big continuous structures still remains a challenge. Similar to graphene is GO, which presents oxide groups as characteristic connected to the carbon, disrupting the uniformity of hexagonal network.23 CNTs are nanoscale tubes made of the same hexagonal carbon network as graphene, and they can be understood as the material obtained when folding a graphene sheet into a cylinder. Making single-walled CNTs is its just a single cylinder of graphene, or a multi-walled CNTs if more than one cylinder are concentrically placed.
Figure 5.

Examples of carbon nanomaterials. Atomic structure display of the carbon nanoallotropes. From left to right: Graphene, graphene oxide, multiwall and single-wall carbon nanotubes. The basic atomic composition and distribution is shown.
The cited carbon nanoallotropes have been applied in biosensing assays in several ways,151 introducing new properties, enhancing stability, or even generating new functionalities. Thanks to this, they have found their place in several types of biosensors: electrochemical, electro/chemiluminescent, biological field effect transistors (bio-FET), and fluorescence-based biosensors. Depending on the type of measurement, carbon nanomaterials can adopt different roles in the sensing systems; for instance, the enhancement of the electrocatalytic properties of the sensors’ transducers by increasing the roughness and active area of the sensor surface, or the enhancement of enzymatic activity.152 In fluorescence-based bioassays, quenching properties of graphene and GO flakes are widely exploited in order to perform the detection.23,153 Graphene QDs are small graphene monolayers (disks) with sizes ranging between 2 and 20 nm. Thanks to their small size, they present quantum confinement effect, which provides them with very interesting optical and electrical properties, in particular, the capability to carry out fluorescent emission.146,154 The property contrasts with the quenching properties that present bigger monolayers or “flakes” of graphene.146
It is worth mentioning the particular case of FETs based on graphene or CNTs. Typically, regular FETs (see Figure 6) are composed by a source and a drain on a semiconductor substrate connected by a dielectric (channel). Source and drain consist of regions (wells) doped with either n- or p-type dopants. A gate is placed on top of the dielectric. It is through source and drain that the current is injected and collected, respectively. In regular FETs, the flow of charge between source and drain is blocked, the application of a voltage through the gate brings carriers close to the surface, which opens a channel that allows the flow of charge from source to drain. This current flow can be controlled by the potential applied through the gate. Application of FETs for biosensing (BioFETs) has been achieved by carrying out the detection event on the gate surface. Modification of gate’s properties due to the sensing process induces modulation in the current between source and drain.157 This principle can be applied in the fabrication of different devices for biosensing, for instance, Medina-Sánchez and coworkers reported the successful detection of proteins using a BioFET fabricated by Ink-Jet.158 Graphene and CNTs represent suitable materials for FET sensors, thanks to their zero-energy band gap. Their electronic properties can be changed surface modifications, making it a feasible principle to be applied in detection.153
Figure 6.
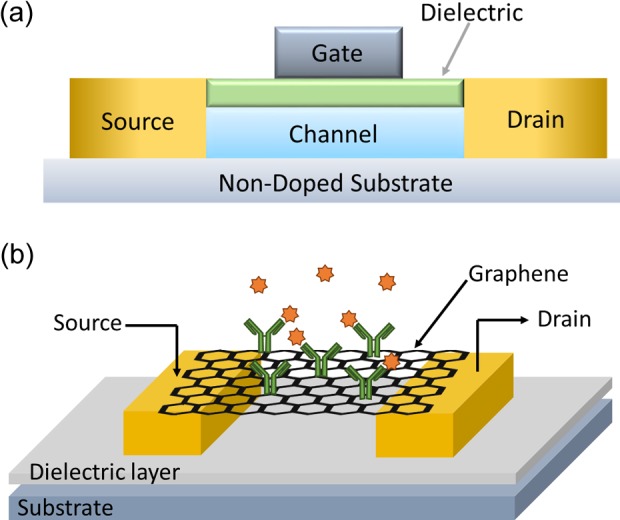
(a) Scheme of main components of an FET. (b) Example of graphene applied in an FET for sensing of human IgG. Source and drain connected by a graphene sheet decorated with AuNPs modified with capturing antibodies. The presence of analyte induced changes in the electrical properties of graphene, modulating the current between source and drain. Part figure a and b extracted from references155 and,156 respectively. FET: field effect transistor; IgG: human immunoglobulin G; AuNPs: gold nanoparticles.
In their reduced form, both graphene and CNTs present relatively limited applications due to the strong hydrophobicity. The use of these materials in their oxidized forms has been significantly spread for two main reasons23,147: First, introducing oxygen groups in the structure turn the graphene into more hydrophilic, making it easier to disperse more solvents. Second, oxygen acts as reactive groups to tailor other molecules, giving the possibility to introduce the desired functionalization.159
However, introducing oxygen groups in the carbon structure generates defects in the uniformity of the carbon lattice, making the resulting structure less planar.160 In the particular case of electrochemical biosensors, edges and defects in the GO structure introduce points for electron transfer between the electrode and the solution (heterogeneous electron transfer),153 an interesting property for the electrochemical measurements and electrochemistry studies. In some situations, after taking advantage of the oxygen groups within the carbon lattice, a reduction process of the nanomaterials is performed in order to recover the reduced material and the interesting properties corresponding to the reduced stage. A nice example of this strategy has been reported by Baptista-Pires and coworkers161 in which GO is printed/transferred on a substrate to later reduce it, this technology can be further applied to fabricate graphene biosensors with all shapes and on several different surfaces (Table 5).
Table 5.
Biosensing using graphene, graphene oxide, and carbon nanotubes.
| Analyte | Type of nano material | LOD/LR | Detection principle; sample | Ref. |
|---|---|---|---|---|
| β-Lactoglobulin (milk allergen) | Graphene | 0.85 pg mL−1 / 0.001–100 ng mL−1 | SPE modified with graphene. Capture antibodies covalently attached to the graphene. Captured analyte blocks diffusion of a redox indicator; food samples. | 162 |
| CEA and SCCA (tumor biomarkers) | rGO | CEA: 13 pg mL−1 / 0.05–20 ng mL−1 | Simultaneous detection of both biomarkers. Immunosandwich performed on a GCE modified with rGO. Redox labels give two electrochemical signals in parallel; human serum samples. | 163 |
| SCCA: 10 pg mL−1 / 0.03–20 ng mL−1 | ||||
| CEA (tumor biomarker) | CNTs | 0.018 ng mL−1 / 0.05–5 ng mL−1 | Capture assay formed between gold electrode CNTs modified with HRP. Amperometric detection of HRP with an electroactive substrate; human serum samples. | 164 |
| CEA | Graphene nanosheets | 40 fg mL−1 / 0.0001–10 ng mL−1 | GCE is modified with graphene, AuNPs. Formation of immunocomplex with the analyte blocks the diffusion of redox indicator; ng mL−1 of LOD for human serum samples diluted 1 in 100. | 165 |
| CRP | rGO | 0.08 ng mL−1 /2–1000 ng mL−1 | Graphene and AuNPs composite on ITO electrode. Analyte captured changes the charge transfer on the electrode surface. EIS using redox indicator; human serum samples. | 166 |
| Cyclin A2 (cancer biomarker) | GO | 0.5 nM / - - | Peptide modified with dye, free in solution it binds to GO (quencher). Cyclin A prevents the peptide from interacting with GO avoiding quenching; cell extract samples. | 167 |
| CNTs | 5 nM / - - | |||
| Cyclin A2 | Graphene | 1.02 pM / 3–10 pM and 10–100 pM | GCE modified with graphene. Capture of Cyclin A with specific peptide on graphene, blocking a redox from electrode surface. Label-free detection by EIS; cell extracts samples. | 168 |
| DNA methyl-transferase | CNTs | 1·10−4 U mL−1 / 1·10−4–100 U mL−1 | DNA-dye with endonuclease / methylase target sequence, and a CNT binding region. Endonuclease activity releases dye. Methylase avoids the release, keeping the fluorescence polarization signal; human serum samples. | 169 |
| DNA short sequences | rGO | 100 fM / 0.1–1000 pM | bioFET with rGO modified with PNAs. Interaction of analyte with PNAs induces to changes in the electrical properties of the graphene; DNA standards in buffer. | 170 |
| GO | 0.2 fM / 1–1·106 M | Carbon paste electrode modified with rGO and xanthurenic acid. DNA immobilized on available COOH groups. DNA captures target sequence and changes the interface impedance; DNA standards in buffer. | 171 | |
| E. coli O157: H7 pathogen strain. | GO | 5 cfu mL−1 / - - | E. coli captured by antibodies on CdSe@ZnS QDs prevent GO flakes from quenching the QD surface; tap water samples. | 172 |
| E. coli O157: H7 (pathogen bacteria) | GO | 100 cfu mL−1 / - - | LFIA with QDs–antibodies lines capture the analyte, which prevents GO from causing quenching of the QDs; bottle water and milk samples. | 173 |
| FR (tumor biomarker for metastatic cancers) | GO | 0.81 ng mL−1 /1–80 ng mL−1 | Fluorescein–ssDNA–folate. FR binds to folate and avoids exonuclease activity, consequently fluorescein is prevented from interacting with GO (quencher); human serum samples at 2%. | 174 |
| FR | rGO | 1 pM / 1–100 pM | Folic acid immobilized onto rGO. Capture of analyte on rGO induce changes in the DPV using a redox indicator; human serum samples. | 175 |
| DNA from HIV virus | Graphene and rGO | 0.158 pM / 1–1·105 pM | ssDNA probe immobilized on rGO on SPE. Target DNA captured affects the diffusion of a redox indicator. CV and DPV measurements; DNA standards in buffer. | 176 |
| Glycoprotein from African trypanosomes | SWCNTs | 4 fM / 1–1000 pM | CNTs modified with aptamer deposited on a GCE. Potentiomeric measurements, changes introduced by the analyte-binding aptamer; human blood samples diluted 1 in 100. | 177 |
| hCG | Graphene | 0.62 ng mL−1 / 0.62–5.62 ng mL−1 | Graphene modified with an antibody for hCG patterned in channels. When the analyte binds the antibody it increases the resistance; synthetic urea samples. | 178 |
| HIV antibody | GO | 2 nM / 5–150 nM | Glycoprotein gp120 of HIV conjugated to fluorescent nanoparticles bind spontaneously to GO (quencher). Anti-HIV antibodies for gp120 prevent quenching of GO; diluted human serum samples. | 179 |
| miRNA (cancer biomarker) | GO | 10.8 fM / - - | miRNA absorbed on GO, hybridizes with probe, allowing amplification. Sylber green intercalates in the formed dsDNA generating the fluorescent signal. Cell culture extracts. | 180 |
| Mucin 1 (cancer biomarker) | GO | 40 nM / 64.9–1036.8 nM | Aptamer for Mucin 1 attached to chemiluminescent molecule, quenched by GO. The analyte interacts with the aptamer and displaces the GO; cancer cells extract. | 181 |
| Osteoponin (cancer biomarker) | SWCNTs | 0.3 pg mL−1 / 0.001–1000 ng mL−1 | Label-free detection bioFET using SWCNT modified with antibodies. Capture of the analyte changes resistance of CNTs; human serum samples. | 182 |
| PMPs (risk factor for arterial pro-thrombotic pathologies) | GO | 100 µparticles µL−1 / 100–7000 µparticles/ µL−1) | GCE modified with GO and antibodies. In presence of redox indicator EIS value increases upon capture of analyte on GO; human blood samples. | 183 |
| Troponin I | Graphene bioFET | 0.1 pg mL−1 /1–1000 pg mL−1 | FET built using graphene sheets acting as gates label-free detection through the antibodies immobilized on the graphene; Troponin I standards in buffer. | 184 |
bioFET: biosensor-based field effect transistor; CRP: C-reactive protein; CNTs: carbon nanotubes; CEA: carcinoembryonic antigen; CV: cyclic voltammetry; DPV: differential pulse voltammetry; dsDNA: double-stranded DNA; EIS: electrochemical impedance spectroscopy; FR: folate receptor; GCE: glassy carbon electrode; GO: graphene oxide; HRP: horseradish peroxidase; hCG: human chorionic gonadotropin; HIV: human immunodeficiency virus; ITO: indium tin oxide; LFIA: lateral flow immunoassay; LOD: limits of detection; LR: linear range; miRNA: micro RNA; MWCNTs: multiwall CNTs; PMPs: plate-derived microparticles; PNA: peptide nucleic acid; rGO: reduced graphene oxide; SPE: screen-printed electrodes; SWCNTs: single-walled CNTs; SCCA: squamous cell carcinoma antigen.
Nanochannels
Nanochannels and nanopores have emerged as systems inspired by ion channels and pores already found in cell membranes.185 According to different authors, when the pore depth is much larger than the diameter, the resulting structure will be considered nanochannel. Pores with diameters within 1 and 100 nm are considered nanopores, as long as the pore diameter is larger than the depth.22,185 These pore and channel elements found in nature act as “smart gates” in charge of transport of specific molecules across biological membranes. This transport mechanism across barriers allows the cell to control a steady-state situation and the presence of certain molecules inside and outside of the cell. This principle of transport control easily caught the attention of researchers, and its applicability to sensing was rapidly accepted.186 The fundamental sensing using nanochannels is based on the Coulter counter concept,187,188 when a microscopic particle enters through a µchannel, a change in the electrical conductance would be recorded as electric current pulse. This electric pulse can be correlated with the nature and properties of the particle and used to make quantification of the number of particles. Furthermore, since changes introduced by the presence of an analyte in the channels or pores can also be read by optical means, optical reading (fluorescence, interferometry, SPR, etc.) represents an alternative to electrical measurements. Initially most of the works were driven by the development of sensors for DNA detection, mainly due to the possibility to perform direct DNA sequencing while the DNA strain is traveling in a linear conformation through the pore/channel (Figure 7).189,190
Figure 7.
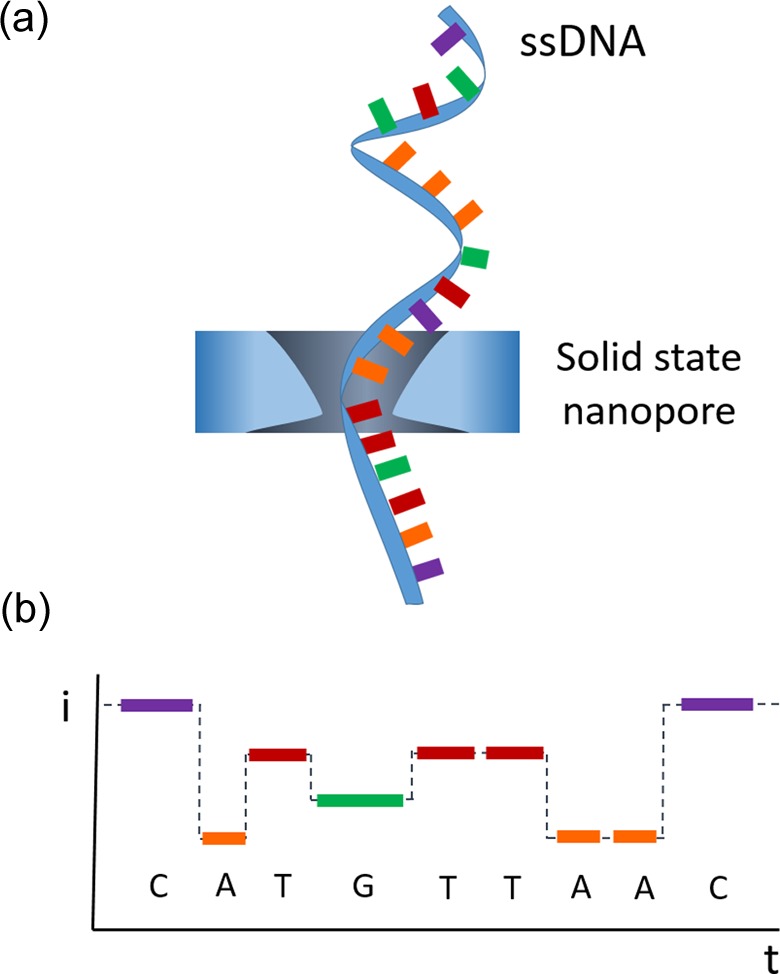
Example of detection using nanochannels. Detection and sequencing of ssDNA traveling through α-hemolysine pore, identification of each nucleotide due to their characteristic time recordings acting as fingerprint signal for each base. ssDNA: single-stranded DNA.
Biological nanopores and nanochannels found in nature are not only made of organic materials but also embedded in lipid bilayers, becoming especially susceptible to deterioration when subject to certain harsh conditions such as pH, temperature, mechanical stress, and so on.191 Much effort has been applied with the aim to create reproducible, stable, and robust solid-state nanopores/nanochannels, for the application in sensing;192 nevertheless, biological nanopores/nanochannels present some properties against which synthetic cannot compete yet.193 With this aim, several nanopore-based sensors have been developed.194 For instance, Singer and his team reported the detection and sequencing of DNA using a nanopore-based device, where the pore has been performed in a free-standing silicon nitride membrane with a silicon chip as the frame.195 Unfortunately, the real applicability of single pore devices for analysis is limited by the fabrication procedures. Every single reproduction of the device requires long and tedious clean room procedures, with several time-consuming and expensive steps. Furthermore, the signals that can be achieved with such small devices require very specific and sophisticated instrumentation.
In order to overcome the above-cited drawbacks, nanochannel arrays emerged as a feasible solution, setting a new line of nanochannel/nanopore-based biosensors. First, the array global result can be understood as the parallel and simultaneous behavior of all the single channels,196 hence the small signal coming from a single channel is magnified as the sum of all channels in the array generating a larger signal easier and more feasible to read. Second, the device fabrication of a bigger area with an array of channels represents an easier and more feasible alternative that can be performed through conventional chemistry procedures in contrast with the equipment and facilities necessary for single pore/channel fabrication. Most common and popular material for making these nanochannel arrays is the anodized aluminum oxide.
The simplest and most straightforward application of solid-state nanochannels arrays in biosensing is their integration/coupling with conventional electro transducer surfaces. The parameter measured is the electrochemical response generated by electroactive species (redox indicators) that are able to diffuse through the channel and reach the transducer surface. When the analyte is captured by the ligands immobilized on the walls of the nanochannels, the assembly formed prevents the electroactive species from reaching the transducer surface, thus decreasing the electrochemical signal read by the sensor. An important issue to take into account is the fact that the achievable signal change is related to the blocking capabilities of the analyte once captured by the ligand immobilized on the nanochannel array. The bulkier the analyte is, or more electrostatic repulsion with the electroactive indicator has, the more sensitive the system will be (Figure 8).
Figure 8.

Principle of electrochemical detection using AAO nanochannel array membranes. Scheme of the sensing principle for a nonspecific assay (left) and for a specific assay with unlabeled (middle) and 20 nm AuNPs labeled (right) target ssDNA. (Bottom) The corresponding DPVs for nonspecific target ssDNA (a) and for unlabeled (b) and 20 nm AuNPs labeled–specific target ssDNA (c). Reproduced with permission from reference.197 AAO: anodized aluminum oxide; AuNPs: gold nanoparticles; ssDNA: single-stranded DNA; DPVs: differential pulse voltammograms.
In some cases, direct contact of certain molecule or components in the sample may interfere or foul the sensing surface disrupting the measurement; solid-state nanochannel detection by the very principle of detection offer the possibility to be used as a barrier protecting the electrode acting as filtering platform avoiding possible interferences caused by different components in the sample medium, for instance, de la Escosura-Muñiz reported the measurement biomarkers in untreated blood samples, thanks to the filtering effect of the nanochannel arrays toward red blood cells, preventing them from reaching the transducer surface and hence avoiding the interference in the measurement.198
Besides the electrochemical-based sensing using nanochannels, optical ways of detection represent a feasible approach for nanochannel-based sensing. It is possible, thanks to the characteristic response of the nanochannel arrays when exposed to light. The presence of biomolecules on the surface of the nanochannels may alter the interaction and hence shift the light emission pattern199; fluorescence and photoluminescence, surface plasmon resonance, surface-enhanced Raman scattering, interference spectroscopy, and so on.22,199
Nanopore/nanochannel-based sensing offers several new possibilities to study biomolecules with interest in clinics, although most expectations are still focused on the possibility to perform real-time sequencing of nucleic acids and peptides, several interesting approaches for biosensing have been successfully proved and reported (Table 6).
Table 6.
Nanochannel-based biosensors.
| Analyte | Type of nanochannel | LOD/LR | Detection principle; sample | Ref. |
|---|---|---|---|---|
| CA15-3 (breast cancer biomarker) | 20 nm diameter nanochannel array AAO | 52 U mL−1 / 60–240 U mL−1 | Aptamer on nanochannels and antibody-AuNPs generate a sandwich with the analyte, preventing the diffusion of a redox indicator. Silver deposition on AuNPs to enhance signal; human whole blood samples | 198 |
| Cocaine | α-hemolysin pores in lipidic membrane | - - / 5–500 µM | Aptamer forming a DNA duplex. Analyte competes for the aptamer, displaced DNA which has a target sequence to be captured by α-hemolysin generating a characteristic current; cocaine standards in buffer. | 200 |
| CTC | Nanoporous AAO | <1000 cells/mL /1000–100,000 cells mL−1 | CTCs captured by the EpCAM immobilized on the AAO surface. CTCs introduce a change in the optical reflection. RiS; blood samples diluted 1 in 10 in PBS. | 201 |
| DNA sequencing | MspA nanopore in a lipidic membrane | Up to 4.5 Kpb of DNA | DNA translocated through protein pore MspA, generates an electrical pattern allowing sequencing; DNA standards in buffer. | 202 |
| DNA, 20 pb of anthrax lethal factor | α-hemolysin pore in a lipid bilayer | 1 pM / 0.001–10 nM | Target DNA and probe hybridize, creating a characteristic electrical signal; DNA standards in buffer. | 203 |
| E. coli | Nanopore array in silicon | 103 cfu mL−1 /103–107 cfu mL−1 | Shift of EOT in the nanochannel array due to of BSA. E. coli captured on the pores prevent BSA from reaching the nanochannels; E. coli cultures samples. | 204 |
| Human IgG in urine | 200 nm LB forming monolayers on ITO-coated PET | 580 ng mL−1 /0.125–100 µg mL−1 | Antibodies against human IgG immobilized on LB. Captured analyte prevents diffusion of redox indicator; human urine samples. | 205 |
| HIV protease activity | α-hemolysin pore in a lipid bilayer | 0.47 ng mL−1 / - - | Translocation of peptide fragments after protease activity generate different electrical pattern than that obtained in the absence of protease. | 206 |
| Lung cancer miRNA | α-hemolysin pore in a lipid bilayer | 0.1 pM / 0.1–100 pM | microRNA of interest is captured by an ssDNA probe, which has an extra sequence to be translocated by α-hemolysin; human serum samples. | 207 |
| PTHLH (tumor biomarker) | 20 nm diameter nanochannel array AAO | 50 ng mL−1 / 50–500 ng mL−1 | Label-free detection. PTHLH captured by antibodies prevents a redox indicator from diffusing through the nanochannels, DPV detection; cell extract samples. | 208 |
| Renin activity (indicator of hypertension) | α-hemolysin pores in lipidic membrane | Qualitative detection | Renin cleaves angiotensinogen Nterm region, the resulting fragment is purified, and quantified by signal through α-hemolysin pores; human serum samples. | 209 |
| Thrombin | 20 nm diameter nanochannel array AAO | 1.8 ng mL−1 / 2–100 ng mL−1 | Aptamer on nanochannels and antibody-AuNPs generate a sandwich with the analyte, preventing the diffusion of a redox indicator, DPV detection; human whole blood samples. | 210 |
| Thrombin | α-hemolysin pores in lipidic membrane | - - / 5–500 nM | Aptamer forming a DNA duplex. Analyte competes for the aptamer, displaced DNA which is captured by α-hemolysin, generating a characteristic current; thrombin standards in buffer. | 200 |
| VEGF | α-hemolysin pores in lipidic membrane | - - /5–500 pM | Aptamer forming a DNA duplex. Analyte competes for the aptamer, displaced DNA which is captured by α-hemolysin, generating a characteristic current; VEGF standards in buffer. | 200 |
AAO: anodized aluminum oxide; AuNPs: gold nanoparticles; CNTs: carbon nanotubes; CA: chronoamperometry; CTC: circulating cancer cells; DPV: differential pulse voltammetry; E. coli: Escherichia coli; EOT: effective optical thickness; HIV: human immunodeficiency virus; ITO: indium tin oxide; LB: latex beads; LOD: limits of detection; LR: linear range; miRNA: micro RNA; MspA: Mycobacterium smegmatis porin A; NPs: nanoparticles; PBS: phosphate-buffered saline; PET: polyethylene substrate; PTHLH: parathyroid hormone-related hormone; RiS: reflectometric interference spectroscopy; ssDNA: single-stranded DNA; VEGF: vascular endothelial growth factor.
Conclusions
Despite being launched decades ago, amperometric glucose meter and lateral flow pregnancy tests remain the most commercialized biosensors.29 Back in 2008, glucose meter meant just by itself 85% of the total biosensor market,29,211 and still new glucose meters are being developed and launched; for instance, Abbott in fall 2015 launched a patch-based sensor for continuous monitoring of glucose in blood,212 by the same time Dexcom launched a similar device for continuous glucose monitoring in blood.213 Yet, it is important not to neglect the traditional stick-based glucose meters already discussed and described in the literature.29 Furthermore, other successful biosensors for other small analytes and biomarkers have been developed and commercialized. Nevertheless, despite all the achievements there is still a strong demand for affordable POC biosensors in order to carry out a close monitoring of certain biomarkers, with a special focus on the cancer biomarker.214 Hence, simple and cheap devices that can be used by nontrained personnel in nonspecialized facilities are strongly desired.
Nanomaterials represent new source of alternatives to be applied in biosensing devices; they can enhance several aspects of the performance of the biosensor, for instance, improve the sensitivity, increase stability and shelf life, achieve better signal to noise ratio, better time of response, and so on. In the same line, they are potential candidates for reducing fabrication costs, allowing to develop cost-effective sensing devices compared to the current alternatives of detection,215 furthermore, the possibility to develop small compact devices. Unfortunately, an issue that limits the development and application of nanobiosensors in real life is related to the safety and toxicity regarding nanomaterials, their composition, and particular properties.216 There is still a controversial discussion which requires more studies related to these materials and their effects.
In recent years, several biosensors taking advantage of nanomaterials have been reported, generating a huge amount of published literature. The interesting issue is the practical and useful point of view given to all this research, looking for devices with potential applicability and the aim of solving real problems. However, many of the developed sensing strategies are rather complicated; and despite representing a solution to a problem, they do not solve it in the practical way needed to be an interesting alternative to other already available possibilities. Therefore, some of them do not represent a feasible approach to be easily brought to a commercial sensor. This is shown by the lack of attention regarding the time of response and time of operation of new reported biosensing techniques. Despite being crucial parameters of any biosensor applied in any real situation, they are not often described, the LOD and linear range of response still being the main focus of attention. An important and successful application of nanomaterials in biosensors is the nanopore-based portable sequencing device launched by Nanopore,217 in which the nanopores introduce a new functionality instead of just substituting or enhancing already existing properties. Most applied biosensors for commercial purposes are based on electrochemical transductors, mainly due to their advantages (low cost, simple equipment, easy to fabricate, strong signal etc.) and their suitability to successfully develop a device ready for commercialization.29
Finally, new frontiers for biosensing are still focused on the integration of sensing systems with technology already available in common everyday life, allowing the patient or healthy individual to carry out certain tests themselves and incorporate this data to their own record.29 A tremendous number of possibilities rely on the use of the huge potential that smartphones offer,218 from optical reading of QDs-based test219 and LFIAs220 to electrochemical reading.221
Acknowledgements
The authors acknowledge the support from MINECO (project MAT2014-52485-P and Severo Ochoa Program, Grant SEV-2013-0295) and Secretaria d’Universitats i Recerca del Departament d’Economia i Coneixement de la Generalitat de Catalunya (2014 SGR 260).
Footnotes
Declaration of conflicting interests: The author(s) declared no potential conflicts of interest with respect to the research, authorship, and/or publication of this article.
Funding: The author(s) received no financial support for the research, authorship, and/or publication of this article.
References
- 1. Kumar S, Mohan A, Guleria R. Biomarkers in cancer screening, research and detection: present and future: a review. Biomarkers 2006; 11(5): 385–405. DOI: 10.1080/13547500600775011. [DOI] [PubMed] [Google Scholar]
- 2. Golubnitschaja O, Flammer J. What are the biomarkers for glaucoma? Surv Ophthalmol 2015; 52(6): S155–S161. DOI: 10.1016/j.survophthal.2007.08.011. [DOI] [PubMed] [Google Scholar]
- 3. Ognibene A, Ciuti R, Tozzi P, et al. Maternal serum superoxide dismutase (SOD): a possible marker for screening Down syndrome affected pregnancies. Prenat Diagn 1999; 19(11): 1058–1060. DOI: 10.1002/(SICI)1097-0223(199911)19:11<1058:: AID-PD685>3.0.CO;2-S. [PubMed] [Google Scholar]
- 4. Thompson IM, Pauler DK, Goodman PJ, et al. Prevalence of prostate cancer among men with a prostate-specific antigen level ≤4.0 ng per milliliter. New Engl J Med 2004; 350(22): 2239–2246. DOI: 10.1056/NEJMoa031918. [DOI] [PubMed] [Google Scholar]
- 5. Pepys MB, Hirschfield GM. C-reactive protein: a critical update. J Clin Invest 2003; 111(12): 1805–1812. DOI: 10.1172/JCI200318921. [DOI] [PMC free article] [PubMed] [Google Scholar]
- 6. Hanash SM. Biomedical applications of two-dimensional electrophoresis using immobilized pH gradients: current status. Electrophoresis 2000; 21(6): 1202–1209. DOI: 10.1002/(SICI)1522-2683(20000401)21:6<1202:: AID-ELPS1202>3.0.CO;2-I. [DOI] [PubMed] [Google Scholar]
- 7. Jiang L, Chughtai K, Purvine SO, et al. MALDI-mass spectrometric imaging revealing hypoxia-driven lipids and proteins in a breast tumor model. Anal Chem 2015; 87(12): 5947–5956. DOI: 10.1021/ac504503x. [DOI] [PMC free article] [PubMed] [Google Scholar]
- 8. Cheng F, Wang Z, Huang Y, et al. Investigation of salivary free amino acid profile for early diagnosis of breast cancer with ultra performance liquid chromatography-mass spectrometry. Clin Chim Acta 2015; 447: 23–31. DOI: http://dx.doi.org/10.1016/j.cca.2015.05.008. [DOI] [PubMed] [Google Scholar]
- 9. Nwosu C, Yau HK, Becht S. Assignment of core versus antenna fucosylation types in protein N-glycosylation via procainamide labeling and tandem mass spectrometry. Anal Chem 2015; 87(12): 5905–5913. DOI: 10.1021/ac5040743. [DOI] [PubMed] [Google Scholar]
- 10. Gygi SP, Rist B, Gerber SA, et al. Quantitative analysis of complex protein mixtures using isotope-coded affinity tags. Nat Biotechnol 1999; 17(10): 994–999. DOI: 10.1038/13690. [DOI] [PubMed] [Google Scholar]
- 11. de la Escosura-Muñiz A, Merkoçi A. Electrochemical detection of proteins using nanoparticles: applications to diagnostics. Expert Opin Med Diagn 2010; 4(1): 21–37. DOI: 10.1517/17530050903386661. [DOI] [PubMed] [Google Scholar]
- 12. Black WC, Welch HG. Advances in diagnostic imaging and overestimations of disease prevalence and the benefits of therapy. New Engl J Med 1993; 328(17): 1237–1243. DOI: 10.1056/NEJM199304293281706. [DOI] [PubMed] [Google Scholar]
- 13. Pepe MS, Etzioni R, Feng Z, et al. Phases of biomarker development for early detection of cancer. J Natl Cancer Inst 2001; 93(14): 1054–1061. [DOI] [PubMed] [Google Scholar]
- 14. Luppa PB, Müller C, Schlichtiger A, et al. Point-of-care testing (POCT): current techniques and future perspectives. Trends Anal Chem 2011; 30(6): 887–898. DOI: http://dx.doi.org/10.1016/j.trac.2011.01.019. [DOI] [PMC free article] [PubMed] [Google Scholar]
- 15. Kost GJ. Point-of-care testing In: Encyclopedia of Analytical Chemistry. John Wiley & Sons, Ltd, 2006. ISBN: 9780470027318. DOI: 10.1002/9780470027318.a0540. [Google Scholar]
- 16. Peeling RW, Mabey D. Point-of-care tests for diagnosing infections in the developing world. Clin Microbiol Infect 2010; 16(8): 1062–1069. DOI: http://dx.doi.org/10.1111/j.1469-0691.2010.03279.x. [DOI] [PubMed] [Google Scholar]
- 17. Thévenot DR, Toth K, Durst RA, et al. Electrochemical biosensors: recommended definitions and classification1. Biosens Bioelectron 2001. January; 16(1–2): 121–131. DOI: http://dx.doi.org/10.1016/S0956-5663(01)00115-4. [DOI] [PubMed] [Google Scholar]
- 18. Rackus DG, Shamsi MH, Wheeler AR. Electrochemistry, biosensors and microfluidics: a convergence of fields. Chem Soc Rev 2015; 44(15): 5320–5340. DOI: 10.1039/C4CS00369A. [DOI] [PubMed] [Google Scholar]
- 19. Daniels JS, Pourmand N. Label-free impedance biosensors: opportunities and challenges. Electroanalysis 2007; 19(12): 1239–1257. DOI: 10.1002/elan.200603855. [DOI] [PMC free article] [PubMed] [Google Scholar]
- 20. Luo X, Davis JJ. Electrical biosensors and the label free detection of protein disease biomarkers. Chem Soc Rev 2013; 42(13): 5944–5962. DOI: 10.1039/C3CS60077G. [DOI] [PubMed] [Google Scholar]
- 21. Yang W, Zhu X, Liu Q, et al. Label-free detection of telomerase activity in HeLa cells using electrochemical impedance spectroscopy. Chem Commun 2011; 47(11): 3129–3131. DOI: 10.1039/C0CC05230B. [DOI] [PubMed] [Google Scholar]
- 22. de la Escosura-Muñiz A, Merkoçi A. Nanochannels preparation and application in biosensing. ACS Nano 2012; 6(9): 7556–7583. DOI: 10.1021/nn301368z. [DOI] [PubMed] [Google Scholar]
- 23. Morales-Narváez E, Merkoçi A. Graphene oxide as an optical biosensing platform. Adv Mater 2012; 24(25): 3298–3308. DOI: 10.1002/adma.201200373. [DOI] [PubMed] [Google Scholar]
- 24. Aragay G, Pino F, Merkoçi A. Nanomaterials for sensing and destroying pesticides. Chem Rev 2012; 112(10): 5317–5338. DOI: 10.1021/cr300020c. [DOI] [PubMed] [Google Scholar]
- 25. Ohno Y, Maehashi K, Yamashiro Y, et al. Electrolyte-gated graphene field-effect transistors for detecting ph and protein adsorption. Nano Lett 2009; 9(9): 3318–3322. DOI: 10.1021/nl901596 m. [DOI] [PubMed] [Google Scholar]
- 26. Kauffman DR, Star A. Electronically monitoring biological interactions with carbon nanotube field-effect transistors. Chem Soc Rev 2008; 37(6): 1197–1206. DOI: 10.1039/B709567 H. [DOI] [PubMed] [Google Scholar]
- 27. Kuang H, Cui G, Chen X, et al. A one-step homogeneous sandwich immunosensor for Salmonella detection based on magnetic nanoparticles (MNPs) and quantum Dots (QDs). Int J Mol Sci 2013; 14(4): 8603–8610. DOI: 10.3390/ijms14048603. [DOI] [PMC free article] [PubMed] [Google Scholar]
- 28. Thermo Fisher Scientific. Web site [Internet], https://www.thermofisher.com/es/en/home/life-science/protein-biology/protein-biology-learning-center/protein-biology-resource-library/pierce-protein-methods/overview-elisa.html (accessed 15 May 2016).
- 29. Turner APF. Biosensors: sense and sensibility. Chem Soc Rev 2013; 42(8): 3184–3196. DOI: 10.1039/C3CS35528D. [DOI] [PubMed] [Google Scholar]
- 30. Guix M, Mayorga-Martinez CC, Merkoçi A. Nano/micromotors in (bio)chemical science applications. Chem Rev 2014; 114(12): 6285–6322. DOI: 10.1021/cr400273r. [DOI] [PubMed] [Google Scholar]
- 31. Alves A, Berutti F, Sánchez F. Nanomaterials and catalysis In: Bergmann C, de Andrade M. (eds) Nanostructured Materials for Engineering Applications SE - 7. Berlin Heidelberg: Springer-Verlag, 2011, pp. 93–117. DOI: 10.1007/978-3-642-19131-2_7. [Google Scholar]
- 32. Cheng L, Wang C, Feng L, et al. Functional nanomaterials for phototherapies of cancer. Chem Rev 2014; 114(21): 10869–10939. DOI: 10.1021/cr400532z. [DOI] [PubMed] [Google Scholar]
- 33. Saito N, Haniu H, Usui Y, et al. Safe clinical use of carbon nanotubes as innovative biomaterials. Chem Rev 2014; 114(11): 6040–6079. DOI: 10.1021/cr400341 h. [DOI] [PMC free article] [PubMed] [Google Scholar]
- 34. Liu G, Lin Y. Nanomaterial labels in electrochemical immunosensors and immunoassays. Talanta 2007; 74(3): 308–317. DOI: http://dx.doi.org/10.1016/j.talanta.2007.10.014. [DOI] [PMC free article] [PubMed] [Google Scholar]
- 35. Yao J, Yang M, Duan Y. Chemistry, biology, and medicine of fluorescent nanomaterials and related systems: new insights into biosensing, bioimaging, genomics, diagnostics, and therapy. Chem Rev 2014; 114(12): 6130–6178. DOI: 10.1021/cr200359p. [DOI] [PubMed] [Google Scholar]
- 36. Lei J, Ju H. Signal amplification using functional nanomaterials for biosensing. Chem Soc Rev 2012; 41(6): 2122–2134. DOI: 10.1039/C1CS15274B. [DOI] [PubMed] [Google Scholar]
- 37. Khor SM, Liu G, Peterson JR, et al. An electrochemical immunobiosensor for direct detection of veterinary drug residues in undiluted complex matrices. Electroanalysis 2011; 23(8): 1797–1804. DOI: 10.1002/elan.201100205. [Google Scholar]
- 38. Aragay G, Pons J, Merkoçi A. Recent trends in macro-, micro-, and nanomaterial-based tools and strategies for heavy-metal detection. Chem Rev 2011; 111(5): 3433–3458. DOI: 10.1021/cr100383r. [DOI] [PubMed] [Google Scholar]
- 39. Malik P, Katyal V, Malik V, et al. Nanobiosensors: concepts and variations. ISRN Nanomater 2013; 2013: 1–9. DOI: 10.1155/2013/327435. [Google Scholar]
- 40. Mody VV, Siwale R, Singh A, et al. Introduction to metallic nanoparticles. J Pharm Bioall Sci 2010; 2(4): 282–289. DOI: 10.4103/0975-7406.72127. [DOI] [PMC free article] [PubMed] [Google Scholar]
- 41. Guczi L. Bimetallic nano-particles: featuring structure and reactivity. Catal Today 2005; 101(2): 53–64. DOI: http://dx.doi.org/10.1016/j.cattod.2005.01.002. [Google Scholar]
- 42. Zhou HS, Honma I, Komiyama H, et al. Coated semiconductor nanoparticles; the cadmium sulfide/lead sulfide system’s synthesis and properties. J Phys Chem 1993; 97(4): 895–901. DOI: 10.1021/j100106a015. [Google Scholar]
- 43. Saha K, Agasti SS, Kim C, et al. Gold nanoparticles in chemical and biological sensing. Chem Rev 2012; 112(5): 2739–2779. DOI: 10.1021/cr2001178. [DOI] [PMC free article] [PubMed] [Google Scholar]
- 44. Zhang Q, Zhang K, Xu D, et al. CuO nanostructures: synthesis, characterization, growth mechanisms, fundamental properties, and applications. Progr Mater Sci 2014; 60: 208–337. DOI: http://dx.doi.org/10.1016/j.pmatsci.2013.09.003. [Google Scholar]
- 45. Ravindran A, Chandran P, Khan SS. Biofunctionalized silver nanoparticles: advances and prospects. Colloids Surf B Biointerfaces 2013; 105: 342–352. DOI: http://dx.doi.org/10.1016/j.colsurfb.2012.07.036. [DOI] [PubMed] [Google Scholar]
- 46. Laurent S, Forge D, Port M, et al. Magnetic iron oxide nanoparticles: synthesis, stabilization, vectorization, physicochemical characterizations, and biological applications. Chem Rev 2008; 108(6): 2064–2110. DOI: 10.1021/cr068445e. [DOI] [PubMed] [Google Scholar]
- 47. Chen X, Mao SS. Titanium dioxide nanomaterials: synthesis, properties, modifications, and applications. Chem Rev 2007; 10 7(7): 2891–2959. DOI: 10.1021/cr0500535. [DOI] [PubMed] [Google Scholar]
- 48. Szot K, Opallo M. (Bio)electroanalytical applications of carbon nanoparticles. Electroanalysis 2016; 28(1): 46–57. DOI: 10.1002/elan.201500478. [Google Scholar]
- 49. Pecher J, Mecking S. Nanoparticles of conjugated polymers. Chem Rev 2010; 110(10): 6260–6279. DOI: 10.1021/cr100132y. [DOI] [PubMed] [Google Scholar]
- 50. Zamborini FP, Bao L, Dasari R. Nanoparticles in measurement science. Anal Chem 2012; 84(2): 541–576. DOI: 10.1021/ac203233q. [DOI] [PubMed] [Google Scholar]
- 51. Holzinger M, Le Goff A, Cosnier S. Nanomaterials for biosensing applications: a review. Front Chem 2014; 2: 63 DOI: 10.3389/fchem.2014.00063. [DOI] [PMC free article] [PubMed] [Google Scholar]
- 52. Rycenga M, Cobley CM, Zeng J, et al. Controlling the synthesis and assembly of silver nanostructures for plasmonic applications. Chem Rev 2011; 111(6): 3669–3712. DOI: 10.1021/cr100275d. [DOI] [PMC free article] [PubMed] [Google Scholar]
- 53. Tokel O, Inci F, Demirci U. Advances in plasmonic technologies for point of care applications. Chem Rev 2014; 114(11): 5728–5752. DOI: 10.1021/cr4000623. [DOI] [PMC free article] [PubMed] [Google Scholar]
- 54. Daniel MC, Astruc D. Gold nanoparticles: assembly, supramolecular chemistry, quantum-size-related properties, and applications toward biology, catalysis, and nanotechnology. Chem Rev 2004; 104(1): 293–346. DOI: 10.1021/cr030698+. [DOI] [PubMed] [Google Scholar]
- 55. Zhang Y, Gao D, Fan J, et al. Naked-eye quantitative aptamer-based assay on paper device. Biosens Bioelectron 2016; 78: 538–546. DOI: http://dx.doi.org/10.1016/j.bios.2015.12.003. [DOI] [PubMed] [Google Scholar]
- 56. Jia S, Li P, Koh K, et al. A cytosensor based on NiO nanoparticle-enhanced surface plasmon resonance for detection of the breast cancer cell line MCF-7. Microchimica Acta 2015; 183(2): 683–688. DOI: 10.1007/s00604-015-1700-8. [Google Scholar]
- 57. Raj V, Jaime R, Astruc D, et al. Detection of cholesterol by digitonin conjugated gold nanoparticles. Biosens Bioelectron 2011; 27(1): 197–200. DOI: http://dx.doi.org/10.1016/j.bios.2011.06.015. [DOI] [PubMed] [Google Scholar]
- 58. Wignarajah S, Suaifan GARY, Bizzarro S, et al. Colorimetric assay for the detection of typical biomarkers for periodontitis using a magnetic nanoparticle biosensor. Anal Chem 2015; 87(24): 12161–12168. DOI: 10.1021/acs.analchem.5b03018. [DOI] [PubMed] [Google Scholar]
- 59. Yen C-W, de Puig H, Tam JO, et al. Multicolored silver nanoparticles for multiplexed disease diagnostics: distinguishing dengue, yellow fever, and Ebola viruses. Lab Chip 2015; 15(7): 1638–1641. DOI: 10.1039/C5LC00055F. [DOI] [PMC free article] [PubMed] [Google Scholar]
- 60. Liu Y, Huang CZ. One-step conjugation chemistry of DNA with highly scattered silver nanoparticles for sandwich detection of DNA. Analyst 2012; 137(15): 3434–3436. DOI: 10.1039/C2AN35167F. [DOI] [PubMed] [Google Scholar]
- 61. Wang X, Pauli J, Niessner R, et al. Gold nanoparticle-catalyzed uranine reduction for signal amplification in fluorescent assays for melamine and aflatoxin B1. Analyst 2015; 140(21): 7305–7312. DOI: 10.1039/C5AN01300C. [DOI] [PubMed] [Google Scholar]
- 62. Xu S, Li X, Mao Y, et al. Novel dual ligand co-functionalized fluorescent gold nanoclusters as a versatile probe for sensitive analysis of Hg2+ and oxytetracycline. Analytical and Bioanalytical Chemistry 2015; 408(11): 2955–2962. DOI: 10.1007/s00216-015-9175-3. [DOI] [PubMed] [Google Scholar]
- 63. Pang Y, Wang C, Wang J, et al. Fe3O4@Ag magnetic nanoparticles for microRNA capture and duplex-specific nuclease signal amplification based SERS detection in cancer cells. Biosens Bioelectron 2016; 79: 574–580. DOI: http://dx.doi.org/10.1016/j.bios.2015.12.052. [DOI] [PubMed] [Google Scholar]
- 64. Degliangeli F, Kshirsagar P, Brunetti V, et al. Absolute and direct microRNA quantification using DNA–gold nanoparticle probes. J Am Chem Soc 2014; 136(6): 2264–2267. DOI: 10.1021/ja412152x. [DOI] [PubMed] [Google Scholar]
- 65. Huang C-C, Chiang C-K, Lin Z-H, et al. Bioconjugated gold nanodots and nanoparticles for protein assays based on photoluminescence quenching. Anal Chem 2008; 80(5): 1497–1504. DOI: 10.1021/ac701998 f. [DOI] [PubMed] [Google Scholar]
- 66. Chamorro-Garcia A, dela Escosura-Muñiz A, Espinosa-Castañeda M, et al. Detection of parathyroid hormone-like hormone in cancer cell cultures by gold nanoparticle-based lateral flow immunoassays. Nanomedicine 2016; 12(1): 53–61. DOI: http://dx.doi.org/10.1016/j.nano.2015.09.012. [DOI] [PubMed] [Google Scholar]
- 67. Zheng T, Pierre-Pierre N, Yan X, et al. Gold nanoparticle-enabled blood test for early stage cancer detection and risk assessment. ACS Appl Mater Interf 2015; 7(12): 6819–6827. DOI: 10.1021/acsami.5b00371. [DOI] [PubMed] [Google Scholar]
- 68. Li J, Ma H, Wu D, et al. A label-free electrochemiluminescence immunosensor based on KNbO3-Au nanoparticles@Bi2S3 for the detection of prostate specific antigen. Biosens Bioelectron 2015; 74: 104–112. DOI: 10.1016/j.bios.2015.06.027. [DOI] [PubMed] [Google Scholar]
- 69. Parolo C, Merkoci A. Paper-based nanobiosensors for diagnostics. Chem Soc Rev 2013; 42(2): 450–457. DOI: 10.1039/C2CS35255A. [DOI] [PubMed] [Google Scholar]
- 70. Quesada-González D, Merkoçi A. Nanoparticle-based lateral flow biosensors. Biosens Bioelectron 2015; 73: 47–63. DOI: http://dx.doi.org/10.1016/j.bios.2015.05.050. [DOI] [PubMed] [Google Scholar]
- 71. Qian H, Zhu M, Wu Z, et al. Quantum sized gold nanoclusters with atomic precision. Acc Chem Res 2012; 45(9): 1470–1479. DOI: 10.1021/ar200331z. [DOI] [PubMed] [Google Scholar]
- 72. Zheng J, Zhang C, Dickson RM. Highly fluorescent, water-soluble, size-tunable gold quantum dots. Phys Rev Lett 2004; 93(7): 77402 DOI: 10.1103/PhysRevLett.93.077402. [DOI] [PubMed] [Google Scholar]
- 73. de la Escosura-Muñiz A, Parolo C, Merkoçi A. Immunosensing using nanoparticles. Mater Today 2010; 13(7–8): 24–34. DOI: http://dx.doi.org/10.1016/S1369-7021(10)70125-5. [Google Scholar]
- 74. Lai G, Wu J, Ju H, et al. Streptavidin-functionalized silver-nanoparticle-enriched carbon nanotube tag for ultrasensitive multiplexed detection of tumor markers. Adv Funct Mater 2011; 21(15): 2938–2943. DOI: 10.1002/adfm.201100396. [Google Scholar]
- 75. Rivas L, de la Escosura-Muñiz A, Pons J, et al. Alzheimer disease biomarker detection through electrocatalytic water oxidation induced by iridium oxide nanoparticles. Electroanalysis 2014; 26(6): 1287–1294. DOI: 10.1002/elan.201400027. [Google Scholar]
- 76. de la Escosura-Muñiz A, Plichta Z, Horák D, et al. Alzheimer's disease biomarkers detection in human samples by efficient capturing through porous magnetic microspheres and labelling with electrocatalytic gold nanoparticles. Biosens Bioelectron 2015; 67: 162–169. DOI: http://dx.doi.org/10.1016/j.bios.2014.07.086. [DOI] [PubMed] [Google Scholar]
- 77. de la Escosura-Muñiz A, Maltez-da Costa M, Sánchez-Espinel C, et al. Gold nanoparticle-based electrochemical magnetoimmunosensor for rapid detection of anti-hepatitis B virus antibodies in human serum. Biosens Bioelectron 2010; 26(4): 1710–1714. DOI: http://dx.doi.org/10.1016/j.bios.2010.07.069. [DOI] [PubMed] [Google Scholar]
- 78. Wang H, Li G, Zhang Y, et al. Nanobody-based electrochemical immunoassay for ultrasensitive determination of apolipoprotein-A1 using silver nanoparticles loaded nanohydroxyapatite as label. Anal Chem 2015; 87(22): 11209–11214. DOI: 10.1021/acs.analchem.5b04063. [DOI] [PubMed] [Google Scholar]
- 79. Wang W, Fan X, Xu S, et al. Low fouling label-free DNA sensor based on polyethylene glycols decorated with gold nanoparticles for the detection of breast cancer biomarkers. Biosens Bioelectron 2015; 71: 51–56. DOI: http://dx.doi.org/10.1016/j.bios.2015.04.018. [DOI] [PubMed] [Google Scholar]
- 80. Sanghavi BJ, Moore JA, Chávez JL, et al. Aptamer-functionalized nanoparticles for surface immobilization-free electrochemical detection of cortisol in a microfluidic device. Biosens Bioelectron 2016; 78: 244–252. DOI: http://dx.doi.org/10.1016/j.bios.2015.11.044. [DOI] [PubMed] [Google Scholar]
- 81. Mayorga-Martinez CC, Chamorro-Garcia A, Merkoçi A. Electrochemical Impedance Spectroscopy (bio)sensing through hydrogen evolution reaction induced by gold nanoparticles. Biosens Bioelectron 2015; 67: 53–58. DOI: http://dx.doi.org/10.1016/j.bios.2014.05.066. [DOI] [PubMed] [Google Scholar]
- 82. de la Escosura-Muñiz A, Baptista-Pires L, Serrano L, et al. Magnetic bead/gold nanoparticle double-labeled primers for electrochemical detection of isothermal amplified leishmania DNA. Small 2016; 12(2): 205–213. DOI: 10.1002/smll.201502350. [DOI] [PubMed] [Google Scholar]
- 83. Feng X, Gan N, Zhang H, et al. Ratiometric biosensor array for multiplexed detection of microRNAs based on electrochemiluminescence coupled with cyclic voltammetry. Biosens Bioelectron 2016; 75: 308–314. DOI: http://dx.doi.org/10.1016/j.bios.2015.08.048. [DOI] [PubMed] [Google Scholar]
- 84. Liu X, Qin Y, Deng C, et al. A simple and sensitive impedimetric aptasensor for the detection of tumor markers based on gold nanoparticles signal amplification. Talanta 2015; 132: 150–154. DOI: http://dx.doi.org/10.1016/j.talanta.2014.08.072. [DOI] [PubMed] [Google Scholar]
- 85. Kumar S, Sharma JG, Maji S, et al. Nanostructured zirconia decorated reduced graphene oxide based efficient biosensing platform for non-invasive oral cancer detection. Biosens Bioelectron 2016; 78: 497–504. DOI: http://dx.doi.org/10.1016/j.bios.2015.11.084. [DOI] [PubMed] [Google Scholar]
- 86. Spain E, Gilgunn S, Sharma S, et al. Detection of prostate specific antigen based on electrocatalytic platinum nanoparticles conjugated to a recombinant scFv antibody. Biosens Bioelectron 2016; 77: 759–766. DOI: http://dx.doi.org/10.1016/j.bios.2015.10.058. [DOI] [PubMed] [Google Scholar]
- 87. Ling P, Lei J, Jia L, et al. Platinum nanoparticles encapsulated metal-organic frameworks for the electrochemical detection of telomerase activity. Chem Commun 2016; 52(6): 1226–1229. DOI: 10.1039/C5CC08418 K. [DOI] [PubMed] [Google Scholar]
- 88. Liang G, Cai S, Zhang P, et al. Magnetic relaxation switch and colorimetric detection of thrombin using aptamer-functionalized gold-coated iron oxide nanoparticles. Anal Chim Acta 2011; 689(2): 243–249. DOI: http://dx.doi.org/10.1016/j.aca.2011.01.046. [DOI] [PubMed] [Google Scholar]
- 89. Wang T, Yang Z, Lei C, et al. An integrated giant magnetoimpedance biosensor for detection of biomarker. Biosens Bioelectron 2014; 58: 338–344. DOI: http://dx.doi.org/10.1016/j.bios.2014.03.008. [DOI] [PubMed] [Google Scholar]
- 90. Yang Z, Liu Y, Lei C, et al. A flexible giant magnetoimpedance-based biosensor for the determination of the biomarker C-reactive protein. Microchim Acta 2015; 182(15-16): 2411–2417. DOI: 10.1007/s00604-015-1587-4. [Google Scholar]
- 91. Chen Y, Wang K, Liu Z, et al. Rapid detection and quantification of tumor marker carbohydrate antigen 72-4 (CA72-4) using a superparamagnetic immunochromatographic strip. Anal Bioanal Chem 2016; 408(9): 2319–2327. DOI: 10.1007/s00216-016-9328-z. [DOI] [PubMed] [Google Scholar]
- 92. Huo W, Gao Y, Zhang L, et al. A novel high-sensitivity cardiac multibiomarker detection system based on microfluidic chip and GMR sensors. IEEE Trans Magn 2015; 51(11): 1–4. DOI: 10.1109/TMAG.2015.2457513.26203196 [Google Scholar]
- 93. Xu L, Yu H, Akhras MS, et al. Giant magnetoresistive biochip for DNA detection and HPV genotyping. Biosens Bioelectron 2008; 24(1): 99–103. DOI: http://dx.doi.org/10.1016/j.bios.2008.03.030. [DOI] [PMC free article] [PubMed] [Google Scholar]
- 94. Osterfeld SJ, Yu H, Gaster RS, et al. Multiplex protein assays based on real-time magnetic nanotag sensing. Proc Natl Acad Sci USA 2008; 105(52): 20637–20640. DOI: 10.1073/pnas.0810822105. [DOI] [PMC free article] [PubMed] [Google Scholar]
- 95. Perez JM, Josephson L, O’Loughlin T, et al. Magnetic relaxation switches capable of sensing molecular interactions. Nat Biotech 2002; 20(8): 816–820. [DOI] [PubMed] [Google Scholar]
- 96. Chen Y, Xianyu Y, Wang Y, et al. One-step detection of pathogens and viruses: combining magnetic relaxation switching and magnetic separation. ACS Nano 2015; 9(3): 3184–3191. DOI: 10.1021/acsnano.5b00240. [DOI] [PubMed] [Google Scholar]
- 97. Pankhurst QA, Connolly J, Jones SK, et al. Applications of magnetic nanoparticles in biomedicine. J Phys D Appl Phys 2003; 36(13): R167. [Google Scholar]
- 98. Nam J-M, Thaxton CS, Mirkin CA. Nanoparticle-based bio-bar codes for the ultrasensitive detection of proteins. Science 2003; 301(5641): 1884–1886. DOI: 10.1126/science.1088755. [DOI] [PubMed] [Google Scholar]
- 99. Beveridge JS, Stephens JR, Williams ME. The use of magnetic nanoparticles in analytical chemistry. Ann Rev Anal Chem 2011; 4(1): 251–273. DOI: 10.1146/annurev-anchem-061010-114041. [DOI] [PubMed] [Google Scholar]
- 100. Koh I, Josephson L. Magnetic nanoparticle sensors. Sensors 2009; 9(10): 8130–8145. DOI: 10.3390/s91008130. [DOI] [PMC free article] [PubMed] [Google Scholar]
- 101. Miller MM, Prinz GA, Cheng S-F, et al. Detection of a micron-sized magnetic sphere using a ring-shaped anisotropic magnetoresistance-based sensor: a model for a magnetoresistance-based biosensor. Appl Phys Lett 2002; 81(12): 2211–2213. [Google Scholar]
- 102. Wang SX, Li G. Advances in Giant magnetoresistance biosensors with magnetic nanoparticle tags: review and outlook. IEEE TransMagn 2008; 36(13): 1687–1702. DOI: 10.1109/TMAG.2008.920962. [Google Scholar]
- 103. Lee H, Shin T-H, Cheon J, et al. Recent developments in magnetic diagnostic systems. Chem Rev 2015; 115(19): 10690–10724. DOI: 10.1021/cr500698d. [DOI] [PMC free article] [PubMed] [Google Scholar]
- 104. Trindade T, O’Brien P, Pickett NL. Nanocrystalline semiconductors: synthesis, properties, and perspectives. Chem Mater 2001; 13(11): 3843–3858. DOI: 10.1021/cm000843p. [Google Scholar]
- 105. Steigerwald ML, Brus LE. Semiconductor crystallites: a class of large molecules. Acc Chem Res 1990; 23(6): 183–188. DOI: 10.1021/ar00174a003. [Google Scholar]
- 106. Bawendi MG, Steigerwald ML, Brus LE. The quantum mechanics of larger semiconductor clusters (“quantum dots”). Ann Rev Phys Chem 1990; 41(1): 477–496. DOI: 10.1146/annurev.pc.41.100190.002401. [Google Scholar]
- 107. de Mello Donegá C. Synthesis and properties of colloidal heteronanocrystals. Chem Soc Rev 2011; 40(3): 1512–1546. DOI: 10.1039/C0CS00055 H. [DOI] [PubMed] [Google Scholar]
- 108. Reiss P, Protière M, Li L. Core/shell semiconductor nanocrystals. Small 2009; 5(2): 154–168. DOI: 10.1002/smll.200800841. [DOI] [PubMed] [Google Scholar]
- 109. Murray CB, Norris DJ, Bawendi MG. Synthesis and characterization of nearly monodisperse CdE (E = sulfur, selenium, tellurium) semiconductor nanocrystallites. J Am Chem Soc 1993; 115(19): 8706–8715. DOI: 10.1021/ja00072a025. [Google Scholar]
- 110. Zheng Y, Yang Z, Ying JY. Aqueous synthesis of glutathione-capped ZnSe and Zn1–xCdxSe alloyed quantum dots. Adv Mater 2007; 19(11): 1475–1479. DOI: 10.1002/adma.200601939. [Google Scholar]
- 111. Shavel A, Gaponik N, Eychmüller A. Efficient UV-blue photoluminescing thiol-stabilized water-soluble alloyed ZnSe(S) nanocrystals. J Phys Chem B 2004; 108(19): 5905–5908. DOI: 10.1021/jp037941t. [Google Scholar]
- 112. Dabbousi BO, Rodriguez-Viejo J, Mikulec FV, et al. (CdSe)ZnS core−shell quantum dots: synthesis and characterization of a size series of highly luminescent nanocrystallites. J Phys Chem B 1997; 10 1(46): 9463–9475. DOI: 10.1021/jp971091y. [Google Scholar]
- 113. Cirillo M, Aubert T, Gomes R, et al. “Flash“ synthesis of CdSe/CdS core–shell quantum dots. Chem Mater 2014; 26(2): 1154–1160. DOI: 10.1021/cm403518a. [Google Scholar]
- 114. Blanco-Canosa JB, Wu M, Susumu K, et al. Recent progress in the bioconjugation of quantum dots. Coord Chem Rev 2014; 263–264: 101–137. DOI: http://dx.doi.org/10.1016/j.ccr.2013.08.030. [Google Scholar]
- 115. Sutherland AJ. Quantum dots as luminescent probes in biological systems. Curr Opin Solid State Mater Sci 2002; 6(4): 365–370. DOI: http://dx.doi.org/10.1016/S1359-0286(02)00081-5. [Google Scholar]
- 116. Xing Y, Chaudry Q, Shen C, et al. Bioconjugated quantum dots for multiplexed and quantitative immunohistochemistry. Nat Protocols 2007; 2(5): 1152–1165. [DOI] [PubMed] [Google Scholar]
- 117. Chan WCW, Nie S. Quantum dot bioconjugates for ultrasensitive nonisotopic detection. Science 1998; 281(5385): 2016–2018. DOI: 10.1126/science.281.5385.2016. [DOI] [PubMed] [Google Scholar]
- 118. Medintz IL, Uyeda HT, Goldman ER, et al. Quantum dot bioconjugates for imaging, labelling and sensing. Nat Mater 2005; 4(6): 435–446. [DOI] [PubMed] [Google Scholar]
- 119. Tan L, Chen K, Huang C, et al. A fluorescent turn-on detection scheme for α-fetoprotein using quantum dots placed in a boronate-modified molecularly imprinted polymer with high affinity for glycoproteins. Microchim Acta 2015; 182(15–16): 2615–2622. DOI: 10.1007/s00604-015-1642 -1. [Google Scholar]
- 120. Hu M, Yan J, He Y, et al. Ultrasensitive, multiplexed detection of cancer biomarkers directly in serum by using a quantum dot-based microfluidic protein chip. ACS Nano 2010; 4(1): 488–494. DOI: 10.1021/nn901404 h. [DOI] [PubMed] [Google Scholar]
- 121. Morales-Narváez E, Montón H, Fomicheva A, et al. Signal enhancement in antibody microarrays using quantum dots nanocrystals: application to potential alzheimer’s disease biomarker screening. Anal Chem 2012; 84(15): 6821–6827. DOI: 10.1021/ac301369e. [DOI] [PubMed] [Google Scholar]
- 122. Medina-Sánchez M, Miserere S, Morales-Narváez E, et al. On-chip magneto-immunoassay for Alzheimer’s biomarker electrochemical detection by using quantum dots as labels. Biosens Bioelectron 2014; 54: 279–284. DOI: http://dx.doi.org/10.1016/j.bios.2013.10.069. [DOI] [PubMed] [Google Scholar]
- 123. Pi J, Long Y, Huang N, et al. A sandwich immunoassay for detection of Aβ1-42 based on quantum dots. Talanta 2016; 146: 10–15. DOI: http://dx.doi.org/10.1016/j.talanta.2015.08.022. [DOI] [PubMed] [Google Scholar]
- 124. Gu B, Xu C, Yang C, et al. ZnO quantum dot labeled immunosensor for carbohydrate antigen 19-9. Biosens Bioelectron 2011; 26(5): 2720–2723. DOI: http://dx.doi.org/10.1016/j.bios.2010.09.031. [DOI] [PubMed] [Google Scholar]
- 125. Tang D, Hou L, Niessner R, et al. Multiplexed electrochemical immunoassay of biomarkers using metal sulfide quantum dot nanolabels and trifunctionalized magnetic beads. Biosens Bioelectron 2013; 46: 37–43. DOI: http://dx.doi.org/10.1016/j.bios.2013.02.027. [DOI] [PubMed] [Google Scholar]
- 126. Li H, Cao Z, Zhang Y, et al. Simultaneous detection of two lung cancer biomarkers using dual-color fluorescence quantum dots. Analyst 2011; 136(7): 1399–1405. DOI: 10.1039/C0AN00704 H. [DOI] [PubMed] [Google Scholar]
- 127. Kokkinos C, Prodromidis M, Economou A, et al. Disposable integrated bismuth citrate-modified screen-printed immunosensor for ultrasensitive quantum dot-based electrochemical assay of C-reactive protein in human serum. Anal Chim Acta 2015; 886: 29–36. DOI: http://dx.doi.org/10.1016/j.aca.2015.05.035. [DOI] [PubMed] [Google Scholar]
- 128. Wegner KD, Lindén S, Jin Z, et al. Nanobodies and nanocrystals: highly sensitive quantum dot-based homogeneous FRET immunoassay for serum-based EGFR detection. Small 2014; 10(4): 734–740. DOI: 10.1002/smll.201302383. [DOI] [PubMed] [Google Scholar]
- 129. Qiu X, Hildebrandt N. Rapid and multiplexed microRNA diagnostic assay using quantum dot-based förster resonance energy transfer. ACS Nano 2015; 9(8): 8449–8457. DOI: 10.1021/acsnano.5b03364. [DOI] [PubMed] [Google Scholar]
- 130. Li X, Deng D, Xue J, et al. Quantum dots based molecular beacons for in vitro and in vivo detection of MMP-2 on tumor. Biosens Bioelectron 2014; 61: 512–518. DOI: http://dx.doi.org/10.1016/j.bios.2014.05.035. [DOI] [PubMed] [Google Scholar]
- 131. Jou AF, Lu C-H, Ou Y-C, et al. Diagnosing the miR-141 prostate cancer biomarker using nucleic acid-functionalized CdSe/ZnS QDs and telomerase. Chem Sci 2015; 6(1): 659–665. DOI: 10.1039/C4SC02104E. [DOI] [PMC free article] [PubMed] [Google Scholar]
- 132. Oh S-D, Duong HD, Rhee J. Il. Simple and sensitive progesterone detection in human serum using a CdSe/ZnS quantum dot-based direct binding assay. Anal Biochem 2015; 483: 54–61. DOI: http://dx.doi.org/10.1016/j.ab.2015.05.001. [DOI] [PubMed] [Google Scholar]
- 133. Zhu Y-D, Peng J, Jiang L-P, et al. Fluorescent immunosensor based on CuS nanoparticles for sensitive detection of cancer biomarker. Analyst 2014; 139(3): 649–655. DOI: 10.1039/C3AN01987 J. [DOI] [PubMed] [Google Scholar]
- 134. Wegner KD, Jin Z, Lindén S, et al. Quantum-dot-based förster resonance energy transfer immunoassay for sensitive clinical diagnostics of low-volume serum samples. ACS Nano 2013; 7(8): 7411–7419. DOI: 10.1021/nn403253y. [DOI] [PubMed] [Google Scholar]
- 135. Kim C, Searson PC. Magnetic bead-quantum dot assay for detection of a biomarker for traumatic brain injury. Nanoscale 2015; 7(42): 17820–17826. DOI: 10.1039/C5NR05608 J. [DOI] [PubMed] [Google Scholar]
- 136. Park H, Lee J-W, Hwang MP, et al. Quantification of cardiovascular disease biomarkers via functionalized magnetic beads and on-demand detachable quantum dots. Nanoscale 2013; 5(18): 8609–8615. DOI: 10.1039/C3NR02357E. [DOI] [PubMed] [Google Scholar]
- 137. Wu F, Yuan H, Zhou C, et al. Multiplexed detection of influenza A virus subtype H5 and H9 via quantum dot-based immunoassay. Biosens Bioelectron 2016; 77: 464–470. DOI: http://dx.doi.org/10.1016/j.bios.2015.10.002. [DOI] [PMC free article] [PubMed] [Google Scholar]
- 138. Zhu D, Li W, Wen H-M, et al. Silver nanoparticles-enhanced time-resolved fluorescence sensor for VEGF165 based on Mn-doped ZnS quantum dots. Biosens Bioelectron 2015; 74: 1053–1060. DOI: http://dx.doi.org/10.1016/j.bios.2015.08.005. [DOI] [PubMed] [Google Scholar]
- 139. Berlina AN, Taranova NA, Zherdev AV, et al. Quantum-dot-based immunochromatographic assay for total ige in human serum. PLoS One 2013; 8(10): e77485. [DOI] [PMC free article] [PubMed] [Google Scholar]
- 140. Ornberg RL, Harper TF, Liu H. Western blot analysis with quantum dot fluorescence technology: a sensitive and quantitative method for multiplexed proteomics. Nat Meth 2005; 2(1): 79–81. [Google Scholar]
- 141. Berlina AN, Taranova NA, Zherdev AV, et al. Quantum dot-based lateral flow immunoassay for detection of chloramphenicol in milk. Anal Bioanal Chem. 2013; 405(14): 4997–5000. DOI: 10.1007/s00216-013-6876-3. [DOI] [PubMed] [Google Scholar]
- 142. Luo Y, Zhang B, Chen M, et al. Sensitive and rapid quantification of C-reactive protein using quantum dot-labeled microplate immunoassay. J Transl Med 2012; 10: 24 DOI: 10.1186/1479-5876-10-24. [DOI] [PMC free article] [PubMed] [Google Scholar]
- 143. Huang H, Zhu J-J. The electrochemical applications of quantum dots. Analyst 2013; 138(20): 5855–5865. DOI: 10.1039/C3AN01034A. [DOI] [PubMed] [Google Scholar]
- 144. Monton H, Parolo C, Aranda-Ramos A, et al. Annexin-V/quantum dot probes for multimodal apoptosis monitoring in living cells: improving bioanalysis using electrochemistry. Nanoscale 2015; 7(9): 4097–4104. DOI: 10.1039/C4NR07191C. [DOI] [PubMed] [Google Scholar]
- 145. Zhao W-W, Wang J, Zhu Y-C, et al. Quantum dots: electrochemiluminescent and photoelectrochemical bioanalysis. Anal Chem 2015; 87(19): 9520–9231. DOI: 10.1021/acs.analchem.5b00497. [DOI] [PubMed] [Google Scholar]
- 146. Georgakilas V, Perman JA, Tucek J, et al. Broad family of carbon nanoallotropes: classification, chemistry, and applications of fullerenes, carbon dots, nanotubes, graphene, nanodiamonds, and combined superstructures. Chem Rev 2015; 115(11): 4744–4822. DOI: 10.1021/cr500304 f. [DOI] [PubMed] [Google Scholar]
- 147. Chen D, Feng H, Li J. Graphene oxide: preparation, functionalization, and electrochemical applications. Chem Rev 2012; 112(11): 6027–6053. DOI: 10.1021/cr300115 g. [DOI] [PubMed] [Google Scholar]
- 148. Li Z, Liu Z, Sun H, et al. Superstructured assembly of nanocarbons: fullerenes, nanotubes, and graphene. Chem Rev 2015; 115(15): 7046–7117. DOI: 10.1021/acs.chemrev.5b00102. [DOI] [PubMed] [Google Scholar]
- 149. Novoselov KS, Fal[prime]ko VI, Colombo L, et al. A roadmap for graphene. Nature 2012; 490(7419): 192–200. [DOI] [PubMed] [Google Scholar]
- 150. Fan X, Peng W, Li Y, et al. Deoxygenation of exfoliated graphite oxide under alkaline conditions: a green route to graphene preparation. Adv Mater 2008; 20(23): 4490–4493. DOI: 10.1002/adma.200801306. [Google Scholar]
- 151. Lacerda L, Raffa S, Prato M, et al. Cell-penetrating CNTs for delivery of therapeutics. Nano Today 2007; 2(6): 38–43. DOI: http://dx.doi.org/10.1016/S1748-0132(07)70172-X. [Google Scholar]
- 152. Ambrosi A, Chua CK, Bonanni A, et al. Electrochemistry of graphene and related materials. Chem Rev 2014; 114(14): 7150–7188. DOI: 10.1021/cr500023c. [DOI] [PubMed] [Google Scholar]
- 153. Pumera M. Graphene in biosensing. Mater Today 2011; 14(7–8): 308–315. DOI: http://dx.doi.org/10.1016/S1369-7021(11)70160-2. [Google Scholar]
- 154. Ponomarenko LA, Schedin F, Katsnelson MI, et al. Chaotic dirac billiard in graphene quantum dots. Science 2008; 320(5874): 356–358. [DOI] [PubMed] [Google Scholar]
- 155. Zhang A, Lieber CM. Nano-bioelectronics. Chem Rev 2016; 116(1): 215–257. DOI: 10.1021/acs.chemrev.5b00608. [DOI] [PMC free article] [PubMed] [Google Scholar]
- 156. Mao S, Lu G, Yu K, et al. Specific protein detection using thermally reduced graphene oxide sheet decorated with gold nanoparticle-antibody conjugates. Adv Mater 2010; 22(32): 3521–3526. DOI: 10.1002/adma.201000520. [DOI] [PubMed] [Google Scholar]
- 157. Schoning MJ, Poghossian A. Recent advances in biologically sensitive field-effect transistors (BioFETs). Analyst 2002; 127(9): 1137–1151. DOI: 10.1039/B204444G. [DOI] [PubMed] [Google Scholar]
- 158. Medina-Sánchez M, Martínez-Domingo C, Ramon E, et al. An inkjet-printed field-effect transistor for label-free biosensing. Adv Funct Mater 2014; 24(40): 6291–6302. DOI: 10.1002/adfm.201401180. [Google Scholar]
- 159. Chen S, Li F, Fan C, et al. Graphene-based nanoprobes for molecular diagnostics. Analyst 2015; 140(19): 6439–6451. DOI: 10.1039/C5AN00848D. [DOI] [PubMed] [Google Scholar]
- 160. Dreyer DR, Park S, Bielawski CW, et al. The chemistry of graphene oxide. Chem Soc Rev 2010; 39(1): 228–240. DOI: 10.1039/B917103G. [DOI] [PubMed] [Google Scholar]
- 161. Baptista-Pires L, Mayorga-Martínez CC, Medina-Sánchez M, et al. Water activated graphene oxide transfer using wax printed membranes for fast patterning of a touch sensitive device. ACS Nano 2016; 16(1): 853–860. DOI: 10.1021/acsnano.5b05963. [DOI] [PubMed] [Google Scholar]
- 162. Eissa S, Tlili C, L’Hocine L, et al. Electrochemical immunosensor for the milk allergen β-lactoglobulin based on electrografting of organic film on graphene modified screen-printed carbon electrodes. Biosens Bioelectron 2012; 38(1): 308–313. DOI: http://dx.doi.org/10.1016/j.bios.2012.06.008. [DOI] [PubMed] [Google Scholar]
- 163. Wu D, Guo A, Guo Z, et al. Simultaneous electrochemical detection of cervical cancer markers using reduced graphene oxide-tetraethylene pentamine as electrode materials and distinguishable redox probes as labels. Biosens Bioelectron 2014; 54: 634–639. DOI: http://dx.doi.org/10.1016/j.bios.2013.11.042. [DOI] [PubMed] [Google Scholar]
- 164. Yang P, Li X, Wang L, et al. Sandwich-type amperometric immunosensor for cancer biomarker based on signal amplification strategy of multiple enzyme-linked antibodies as probes modified with carbon nanotubes and concanavalin A. J Electroanal Chem 2014; 732: 38–45. DOI: http://dx.doi.org/10.1016/j.jelechem.2014.08.030. [Google Scholar]
- 165. Liu Z, Wang Y, Guo Y, et al. Label-free electrochemical aptasensor for carcino-embryonic antigen based on ternary nanocomposite of gold nanoparticles, hemin and graphene. Electroanalysis 2016; 28(5): 1023–1028. DOI: 10.1002/elan.201500593. [Google Scholar]
- 166. Yagati AK, Pyun J-C, Min J, et al. Label-free and direct detection of C-reactive protein using reduced graphene oxide-nanoparticle hybrid impedimetric sensor. Bioelectrochemistry 2016; 107: 37–44. DOI: http://dx.doi.org/10.1016/j.bioelechem.2015.10.002. [DOI] [PubMed] [Google Scholar]
- 167. Wang X, Wang C, Qu K, et al. Ultrasensitive and selective detection of a prognostic indicator in early-stage cancer using graphene oxide and carbon nanotubes. Adv Funct Mater 2010; 20(22): 3967–3971. DOI: 10.1002/adfm.201001118. [Google Scholar]
- 168. Feng L, Wu L, Wang J, et al. Detection of a prognostic indicator in early-stage cancer using functionalized graphene-based peptide sensors. Adv Mater 2012; 24(1): 125–131. DOI: 10.1002/adma.201103205. [DOI] [PubMed] [Google Scholar]
- 169. Huang Y, Shi M, Zhao L, et al. Carbon nanotube signal amplification for ultrasensitive fluorescence polarization detection of DNA methyltransferase activity and inhibition. Biosens Bioelectron 2014; 54: 285–291. DOI: http://dx.doi.org/10.1016/j.bios.2013.10.065. [DOI] [PubMed] [Google Scholar]
- 170. Cai B, Wang S, Huang L, et al. Ultrasensitive label-free detection of pna–dna hybridization by reduced graphene oxide field-effect transistor biosensor. ACS Nano 2014; 8(3): 2632–2638. DOI: 10.1021/nn4063424. [DOI] [PubMed] [Google Scholar]
- 171. Yang T, Li X, Li Q, et al. Electrochemically reduced graphene oxide-enhanced electropolymerization of poly-xanthurenic acid for direct, “signal-on” and high sensitive impedimetric sensing of DNA. Polym Chem 2013; 4(4): 1228–1234. DOI: 10.1039/C2PY20655B. [Google Scholar]
- 172. Morales-Narváez E, Hassan A-R, Merkoçi A. Graphene oxide as a pathogen-revealing agent: sensing with a digital-like response. Angew Chem Int Ed Engl 2013; 52(51): 13779–13783. DOI: 10.1002/anie.201307740. [DOI] [PubMed] [Google Scholar]
- 173. Morales-Narváez E, Naghdi T, Zor E, et al. Photoluminescent lateral-flow immunoassay revealed by graphene oxide: highly sensitive paper-based pathogen detection. Anal Chem 2015; 87(16): 8573–8577. DOI: 10.1021/acs.analchem.5b02383. [DOI] [PubMed] [Google Scholar]
- 174. He Y, Jiao B. High performance system for protein assays: synergistic effect of terminal protection strategy and graphene oxide platform. RSC Adv 2015; 5(123): 101327–101332. DOI: 10.1039/C5RA21116F. [Google Scholar]
- 175. He L, Wang Q, Mandler D, et al. Detection of folic acid protein in human serum using reduced graphene oxide electrodes modified by folic-acid. Biosens Bioelectron 2016; 75: 389–395. DOI: http://dx.doi.org/10.1016/j.bios.2015.08.060. [DOI] [PubMed] [Google Scholar]
- 176. Li B, Pan G, Avent ND, et al. Graphene electrode modified with electrochemically reduced graphene oxide for label-free DNA detection. Biosens Bioelectron 2015; 72: 313–319. DOI: http://dx.doi.org/10.1016/j.bios.2015.05.034. [DOI] [PubMed] [Google Scholar]
- 177. Zelada-Guillén GA, Tweed-Kent A, Niemann M, et al. Ultrasensitive and real-time detection of proteins in blood using a potentiometric carbon-nanotube aptasensor. Biosens Bioelectron 2013; 41: 366–371. DOI: http://dx.doi.org/10.1016/j.bios.2012.08.055. [DOI] [PubMed] [Google Scholar]
- 178. Teixeira S, Burwell G, Castaing A, et al. Epitaxial graphene immunosensor for human chorionic gonadotropin. Sens Actuat B Chem 2014; 190: 723–729. DOI: http://dx.doi.org/10.1016/j.snb.2013.09.019. [Google Scholar]
- 179. Wu Y-M, Cen Y, Huang L-J, et al. Upconversion fluorescence resonance energy transfer biosensor for sensitive detection of human immunodeficiency virus antibodies in human serum. Chem Commun 2014; 50(36): 4759–4762. DOI: 10.1039/C4CC00569D. [DOI] [PubMed] [Google Scholar]
- 180. Liu H, Li L, Wang Q, et al. Graphene fluorescence switch-based cooperative amplification: a sensitive and accurate method to detection microRNA. Anal Chem 2014; 86(11): 5487–5493. DOI: 10.1021/ac500752t. [DOI] [PubMed] [Google Scholar]
- 181. Wei W, Li DF, Pan XH, et al. Electrochemiluminescent detection of Mucin 1 protein and MCF-7 cancer cells based on the resonance energy transfer. Analyst 2012; 137(9): 2101–2106. DOI: 10.1039/C2AN35059A. [DOI] [PubMed] [Google Scholar]
- 182. Sharma A, Hong S, Singh R, et al. Single-walled carbon nanotube based transparent immunosensor for detection of a prostate cancer biomarker osteopontin. Anal Chim Acta 2015; 869: 68–73. DOI: http://dx.doi.org/10.1016/j.aca.2015.02.010. [DOI] [PubMed] [Google Scholar]
- 183. Kailashiya J, Singh N, Singh SK, et al. Graphene oxide-based biosensor for detection of platelet-derived microparticles: a potential tool for thrombus risk identification. Biosens Bioelectron 2015; 65: 274–280. DOI: http://dx.doi.org/10.1016/j.bios.2014.10.056. [DOI] [PubMed] [Google Scholar]
- 184. Tuteja SK, Priyanka, Bhalla V, et al. Graphene-gated biochip for the detection of cardiac marker Troponin I. Anal Chim Acta 2014; 809: 148–154. DOI: http://dx.doi.org/10.1016/j.aca.2013.11.047. [DOI] [PubMed] [Google Scholar]
- 185. Hou X, Jiang L. Learning from nature: building bio-inspired smart nanochannels. ACS Nano 2009; 3(11): 3339–3342. DOI: 10.1021/nn901402b. [DOI] [PubMed] [Google Scholar]
- 186. Dekker C. Solid-state nanopores. Nat Nano 2007; 2(4): 209–215. [DOI] [PubMed] [Google Scholar]
- 187. Coulter W. Means for counting particles suspended in a fluid. 1953. U.S. Patent 2,656,508 (1953) Publication number: US2656508 A.
- 188. Graham MD. The coulter principle: foundation of an industry. J Assoc Lab Automat 2003; 8(6): 72–81. DOI: 10.1016/S1535-5535(03)00023-6. [Google Scholar]
- 189. Venkatesan BM, Bashir R. Nanopore sensors for nucleic acid analysis. Nat Nano 2011; 6(10): 615–624. [DOI] [PubMed] [Google Scholar]
- 190. Kasianowicz JJ, Robertson JWF, Chan ER, et al. Nanoscopic porous sensors. Ann Rev Anal Chem 2008; 1(1): 737–766. DOI: 10.1146/annurev.anchem.1.031207.112818. [DOI] [PubMed] [Google Scholar]
- 191. Wen L, Tian Y, Ma J, et al. Construction of biomimetic smart nanochannels with polymer membranes and application in energy conversion systems. Phys Chem Chem Phys 2012; 14(12): 4027–4042. DOI: 10.1039/C2CP23911F. [DOI] [PubMed] [Google Scholar]
- 192. Xia D, Yan J, Hou S. Fabrication of nanofluidic biochips with nanochannels for applications in DNA analysis. Small 2012; 8(18): 2787–2801. DOI: 10.1002/smll.201200240. [DOI] [PubMed] [Google Scholar]
- 193. Haque F, Li J, Wu H-C, et al. Solid-state and biological nanopore for real-time sensing of single chemical and sequencing of DNA. Nano Today 2013; 8(1): 56–74. DOI: http://dx.doi.org/10.1016/j.nantod.2012.12.008. [DOI] [PMC free article] [PubMed] [Google Scholar]
- 194. de la Escosura-Muñiz A, Merkoçi A. Nanochannels for electrical biosensing. Trends Anal Chem 2015; 79: 134–150. DOI: http://dx.doi.org/10.1016/j.trac.2015.12.003. [Google Scholar]
- 195. Singer A, Wanunu M, Morrison W, et al. Nanopore based sequence specific detection of duplex DNA for genomic profiling. Nano Lett 2010; 10(2): 738–742. DOI: 10.1021/nl100058y. [DOI] [PMC free article] [PubMed] [Google Scholar]
- 196. Sawafta F, Clancy B, Carlsen AT, et al. Solid-state nanopores and nanopore arrays optimized for optical detection. Nanoscale 2014; 6(12): 6991–6996. DOI: 10.1039/C4NR00305E. [DOI] [PubMed] [Google Scholar]
- 197. de la Escosura-Muniz A, Mekoci A. Nanoparticle based enhancement of electrochemical DNA hybridization signal using nanoporous electrodes. Chem Commun 2010; 46(47): 9007–9009. DOI: 10.1039/C0CC02683B. [DOI] [PubMed] [Google Scholar]
- 198. de la Escosura-Muñiz A, Merkoçi A. A nanochannel/nanoparticle-based filtering and sensing platform for direct detection of a cancer biomarker in blood. Small 2011; 7(5): 675–682. DOI: 10.1002/smll.201002349. [DOI] [PubMed] [Google Scholar]
- 199. Santos A, Kumeria T, Losic D. Nanoporous anodic aluminum oxide for chemical sensing and biosensors. Trends Anal Chem 2013; 44: 25–38. DOI: http://dx.doi.org/10.1016/j.trac.2012.11.007. [Google Scholar]
- 200. Li T, Liu L, Li Y, et al. A universal strategy for aptamer-based nanopore sensing through host–guest interactions inside α-hemolysin. Angew Chem 2015; 127(26): 7678–7681. DOI: 10.1002/ange.201502047. [DOI] [PubMed] [Google Scholar]
- 201. Kumeria T, Kurkuri MD, Diener KR, et al. Label-free reflectometric interference microchip biosensor based on nanoporous alumina for detection of circulating tumour cells. Biosens Bioelectron 2012; 35(1): 167–173. DOI: http://dx.doi.org/10.1016/j.bios.2012.02.038. [DOI] [PubMed] [Google Scholar]
- 202. Laszlo AH, Derrington IM, Ross BC, et al. Decoding long nanopore sequencing reads of natural DNA. Nat Biotech 2014; 32(8): 829–833. [DOI] [PMC free article] [PubMed] [Google Scholar]
- 203. Wang L, Han Y, Zhou S, et al. Nanopore biosensor for label-free and real-time detection of anthrax lethal factor. ACS Appl Mater Interfaces 2014; 6(10): 7334–7339. DOI: 10.1021/am500749p. [DOI] [PMC free article] [PubMed] [Google Scholar]
- 204. Tang Y, Li Z, Luo Q, et al. Bacteria detection based on its blockage effect on silicon nanopore array. Biosens Bioelectron 2016; 79: 715–720. DOI: http://dx.doi.org/10.1016/j.bios.2015.12.109. [DOI] [PubMed] [Google Scholar]
- 205. Escosura-Muñiz A, de la, Espinoza-Castañeda M, Hasegawa M, et al. Nanoparticles-based nanochannels assembled on a plastic flexible substrate for label-free immunosensing. Nano Res 2014; 8(4): 1180–1188. DOI: 10.1007/s12274-014-0598-5. [Google Scholar]
- 206. Wang L, Han Y, Zhou S, et al. Real-time label-free measurement of HIV-1 protease activity by nanopore analysis. Biosens Bioelectron 2014; 62: 158–162. DOI: http://dx.doi.org/10.1016/j.bios.2014.06.041. [DOI] [PMC free article] [PubMed] [Google Scholar]
- 207. Wang Y, Zheng D, Tan Q, et al. Nanopore-based detection of circulating microRNAs in lung cancer patients. Nat Nano 2011; 6(10): 668–674. [DOI] [PMC free article] [PubMed] [Google Scholar]
- 208. Espinoza-Castañeda M, de la Escosura-Muñiz A, Chamorro A, et al. Nanochannel array device operating through Prussian blue nanoparticles for sensitive label-free immunodetection of a cancer biomarker. Biosens Bioelectron 2015; 67: 107–114. DOI: http://dx.doi.org/10.1016/j.bios.2014.07.039. [DOI] [PubMed] [Google Scholar]
- 209. Kukwikila M, Howorka S. Nanopore-based electrical and label-free sensing of enzyme activity in blood serum. Anal Chem 2015; 87(18): 9149–9154. DOI: 10.1021/acs.analchem.5b01764. [DOI] [PubMed] [Google Scholar]
- 210. de la Escosura-Muñiz A, Chunglok W, Surareungchai W, et al. Nanochannels for diagnostic of thrombin-related diseases in human blood. Biosens Bioelectron 2013; 40(1): 24–31. DOI: http://dx.doi.org/10.1016/j.bios.2012.05.021. [DOI] [PubMed] [Google Scholar]
- 211. Wang J. Electrochemical glucose biosensors. Chem Rev 2008; 108(2): 814–825. DOI: 10.1021/cr068123a. [DOI] [PubMed] [Google Scholar]
- 212. Abbot FreeStyleLibre [Internet]. cited 2016 Feb 5], http://www.freestylelibre.co.uk/ (accessed 02 May 2016).
- 213. Dexcom [Internet]. [cited 2016 Feb 8], http://www.dexcom.com/dexcom-g4-platinum-share.
- 214. Tothill IE. Biosensors for cancer markers diagnosis. Semin Cell Dev Biol 2009; 20(1): 55–62. DOI: http://dx.doi.org/10.1016/j.semcdb.2009.01.015. [DOI] [PubMed] [Google Scholar]
- 215. Kumar S, Ahlawat W, Kumar R, et al. Graphene, carbon nanotubes, zinc oxide and gold as elite nanomaterials for fabrication of biosensors for healthcare. Biosens Bioelectron 2015; 70: 498–503. DOI: http://dx.doi.org/10.1016/j.bios.2015.03.062. [DOI] [PubMed] [Google Scholar]
- 216. Sharifi S, Behzadi S, Laurent S, et al. Toxicity of nanomaterials. Chem Soc Rev 2012; 41(6): 2323–2343. DOI: 10.1039/C1CS15188F. [DOI] [PMC free article] [PubMed] [Google Scholar]
- 217. Nanopore [Internet], https://nanoporetech.com/products-services/minion-mki (accessed 18 February 2016).
- 218. Ozcan A. Mobile phones democratize and cultivate next-generation imaging, diagnostics and measurement tools. Lab Chip 2014; 14(17): 3187–3194. DOI: 10.1039/c4lc00010b. [DOI] [PMC free article] [PubMed] [Google Scholar]
- 219. Petryayeva E, Algar WR. Single-step bioassays in serum and whole blood with a smartphone, quantum dots and paper-in-PDMS chips. Analyst 2015; 140(12): 4037–4045. DOI: 10.1039/C5AN00475F. [DOI] [PubMed] [Google Scholar]
- 220. Mudanyali O, Dimitrov S, Sikora U, et al. Integrated rapid-diagnostic-test reader platform on a cellphone. Lab Chip 2012; 12(15): 2678–2686. DOI: 10.1039/C2LC40235A. [DOI] [PMC free article] [PubMed] [Google Scholar]
- 221. Nemiroski A, Christodouleas DC, Hennek JW, et al. Universal mobile electrochemical detector designed for use in resource-limited applications. Proc Natl Acad Sci 2014; 111(33): 11984–11989. DOI: 10.1073/pnas.1405679111. [DOI] [PMC free article] [PubMed] [Google Scholar]