

Summary
Cancer-initiating cells (CICs) have been implicated in tumor development and aggressiveness. In ovarian carcinoma (OC), CICs drive tumor formation, dissemination, and recurrence, as well as drug resistance, thus accounting for the high death-to-incidence ratio of this neoplasm. However, the molecular mechanisms that underlie such a pathogenic role of ovarian CICs (OCICs) remain elusive. Here, we have capitalized on primary cells either from OC or from its tissues of origin to obtain the transcriptomic profile associated with OCICs. Among the genes differentially expressed in OCICs, we focused on CD73, which encodes the membrane-associated 5′-ectonucleotidase. The genetic inactivation of CD73 in OC cells revealed that this molecule is causally involved in sphere formation and tumor initiation, thus emerging as a driver of OCIC function. Furthermore, functional inhibition of CD73 via either a chemical compound or a neutralizing antibody reduced sphere formation and tumorigenesis, highlighting the druggability of CD73 in the context of OCIC-directed therapies. The biological function of CD73 in OCICs required its enzymatic activity and involved adenosine signaling. Mechanistically, CD73 promotes the expression of stemness and epithelial-mesenchymal transition-associated genes, implying a regulation of OCIC function at the transcriptional level. CD73, therefore, is involved in OCIC biology and may represent a therapeutic target for innovative treatments aimed at OC eradication.
Keywords: CD73, ovarian cancer, cancer-initiating cells, cancer stem cells, EMT, adenosine
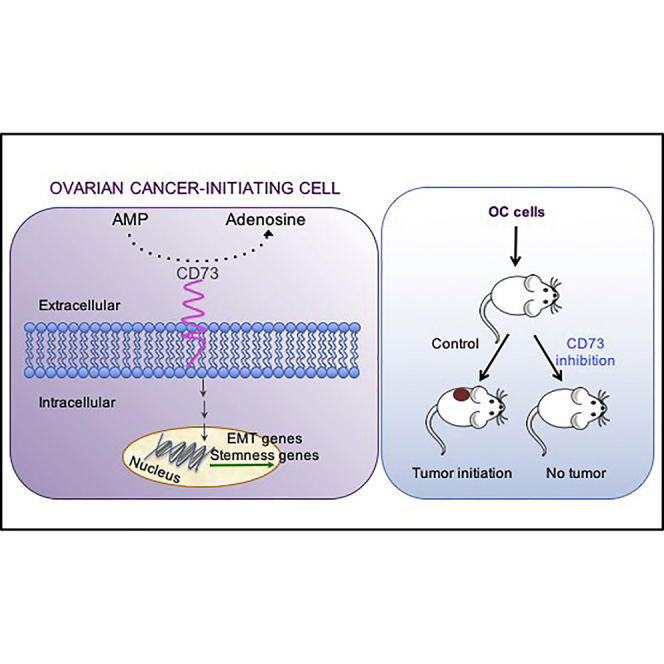
Graphical Abstract
Highlights
-
•
CD73 is enriched in ovarian cancer-initiating cells (OCICs)
-
•
CD73 orchestrates OCIC stemness and EMT
-
•
OC initiation and growth require CD73 activity
-
•
OCIC-associated CD73 is a therapeutic target useful for OC eradication
Cavallaro et al. characterized the transcriptome of OCIC-enriched primary cultures and found CD73 as an upregulated gene. CD73 was then shown to regulate the expression of stemness and EMT-associated genes. The expression and function of CD73 in OCICs is required for tumor initiation, and CD73-targeted drugs decrease the rate of tumor take and inhibit cancer growth.
Introduction
Epithelial ovarian carcinoma (OC) is the most lethal gynecological tumor in developed countries, with a 5-year survival rate below 45%. Approximately 225,000 new cases of OC and 140,000 deaths occur worldwide every year. The high death-to-incidence ratio of OC is essentially due to two factors: (1) the disease is usually diagnosed at advanced stage, due to the lack of specific symptoms; and (2) even after surgical resection, tumor relapse frequently occurs in different peritoneal sites and in most cases the recurrent disease is drug resistant (Matulonis et al., 2016).
The clinical evolution and the biological features of OC fit well with the cancer-initiating cell (CIC, also defined as cancer stem cell) model. The latter postulates a hierarchical organization in solid tumors, such as hematologic malignancies, which is to some extent analogous to that observed in normal tissue development and homeostasis. According to this model, at the apex of such a hierarchy there is a subpopulation of self-renewing CICs that are able to generate the entire progeny of short-lived, differentiated, and heterogeneous cells that compose the tumor bulk. CICs are thought to be relatively quiescent and to possess efficient detoxifying machineries, two features that would underlie their pivotal role in tumor resistance to radio- and chemotherapy (Nassar and Blanpain, 2016). Taken together, these characteristics imply that strategies aimed at interfering with CIC function would open novel perspectives for the eradication of several tumor types.
In the case of OC, ovarian CICs (OCICs) would drive and sustain not only tumorigenesis, but also peritoneal seeding as well as tumor relapse after primary cytoreduction, while conferring chemoresistance to the recurrent disease. Indeed, OCICs have been proposed to recapitulate the histopathological heterogeneity of the parental tumor, thus supporting the hierarchical organization of OC and providing the rationale to characterize OCICs as ideal targets for OC eradication. However, the unequivocal identification of OCICs has proven extremely challenging. Most of the studies performed so far relied either on putative markers of the tissue of origin or on markers that were inferred from the phenotype of CICs in other tumor types. The former strategy, however, has relevant limitations since the exact origin of the different subtypes of OC is still unclear. For example, high-grade serous OC (HGSOC) has long been thought to derive from the ovarian surface epithelium, while clinico-pathological and biological evidence has now pointed to the distal portion of fallopian tube epithelium (FTE) as the most prominent tissue of origin for this neoplasm (Perets and Drapkin, 2016). Sets of surface markers inferred from other CIC types, on the other hand, showed serious limitations not only due to poor specificity but also to controversial and heterogeneous results association with CIC features in OC (Lupia and Cavallaro, 2017), thus impeding the full reconstruction of OC subpopulation hierarchy.
Based on these considerations, as an approach to enrich for OCICs, we preferred not to rely on a priori selected markers but rather to harness the intrinsic biological properties that define CICs, and then search for OCIC-associated genes. We applied this concept to HGSOC, which is the most frequent and aggressive form of the disease, with the aim to define clinically relevant OCIC biomarkers. In particular, starting from a panel of patient-derived primary cell cultures established both from HGSOC and from its normal counterpart, FTE, we have enriched for cells endowed with CIC-related properties and obtained a set of genes differentially expressed in OCICs. Among these, we have defined the surface protein CD73 as a driver of OCIC function and a potential therapeutic target for the eradication of OC.
Results
Gene Expression Profiling of Stem Cells
Tumor-derived spheroid culture is a widely used method to enrich for CICs (or cancer stem cells), mainly due to the ability of this cell subpopulation to resist anoikis, to self-renew, and to proliferate when cultured under non-adherent conditions (Weiswald et al., 2015). In addition, sphere-forming cells derived from different cancer types, including OC (Liao et al., 2014), exhibit high tumor-initiating capacity. We established primary spheroid cultures (OC spheres) from HGSOC samples (Figure S1A). A qRT-PCR analysis confirmed that established CIC markers, such as ALDH1, CD44, NANOG, POU5F1, and SOX2, were expressed at higher level in sphere-forming OC primary cells compared with the bulk of parental cells cultured under adherent conditions (Figure S1B). Epithelial-mesenchymal transition (EMT), commonly considered as a hallmark of CICs (Pattabiraman and Weinberg, 2014), was also assessed. Indeed, we observed higher expression of EMT-associated factors, such as SNAI1, TWIST1, and ZEB1, in primary sphere-forming cells compared with adherent cells (Figure S1B). Finally, limiting dilution assays indicated that spheres contained a much higher number of sphere-forming cells than their parental population (Figure S1C). Overall, these findings supported the notion that sphere cultures were enriched in OCICs.
To determine the frequency of sphere-generating cells in a large cohort of OC-derived primary cultures, we measured the sphere-forming efficiency (SFE) in 29 HGSOC. This analysis was extended to 26 primary cultures from the distal FTE, which is considered the tissue of origin of most HGSOC (Perets and Drapkin, 2016). As shown in Figure 1A, the median of SFE values for OC-derived primary cells was 0.5%, consistent with previous reports (Janzen et al., 2015, Kwon et al., 2015, Pastò et al., 2014), while a median of 0.2% (p = 0.0004) was determined for FTE cells, which were not subjected to this assay in previous studies. This suggested that OC contains a higher proportion of cells with stemness traits than its tissue of origin.
Figure 1.

Sphere-Forming Efficiency of Primary Cells and Gene Expression Analysis of OC- and FTE-Derived Spheres
(A) Primary cultures derived from FTE (blue circles) and from OC (green squares) were grown under non-adherent conditions to test their ability to form monoclonal spheres. Sphere-forming efficiency (SFE), was calculated as the ratio between number of spheres and number of cells seeded. Data are expressed as median of SFE values. ∗p < 0.0005.
(B) Hierarchical clustering analysis of genes found differentially expressed (1,818; p < 0.01) in OC-derived spheres versus FTE-derived spheres. The heatmap indicates the trend of expression of significantly regulated genes, and relative log2 ratio values of expression (median centered) are shown in the legend.
(C) Lists of the top 20 upregulated (left) and top 20 downregulated genes (right) in OC-derived spheres as compared with FTE-derived spheres. See also Figures S1 and S2.
In an attempt to obtain a comprehensive molecular portrait of OCICs, which may help to identify novel CIC-related molecular mechanisms and markers, we employed the Affymetrix microarray technology to compare the transcriptome of OC-derived spheres with that of FTE-derived spheres. The analysis was performed on two independent pools of OC or FTE, each consisting of samples from three to five different patients (Table S1), aimed at reducing the effect of inter-individual genetic heterogeneity. The screening revealed the significant differential expression of 1,818 genes (p < 0.01; Figure 1B; Table S2). A subset of candidates from Affymetrix data, including VCAM1, CD44, CD24, and NrCAM, was validated at the protein level, confirming the higher amount of VCAM1 and CD44 and the lower amount of CD24 and NrCAM in primary OC spheres compared with FTE spheres (Figure S2).
To get more insights about the molecular mechanisms involved in OC spheres, we performed the Ingenuity Pathway Analysis (IPA)-Upstream Regulator analysis using the 1,818 gene set. This analysis predicted the activation in OC-derived spheres of transcription factors classically associated either with cancer stemness and EMT or with OC development, such as TWIST2, SNAI1 and SNAI2, NKX2-3, FOXM1, and HOXD3 (Table S3). This further supported the enrichment for OCICs in our primary cell-derived spheres.
CD73 Is Involved in OCIC Function
One of the most interesting candidates among the genes upregulated in OC-derived spheres was NT5E. This gene encodes CD73, a cell-surface protein endowed with 5′-ectonucleotidase activity and, hence, involved in the generation of extracellular adenosine (Antonioli et al., 2016). Since CD73 represents a potential therapeutic target, due to its cell-surface localization and enzymatic activity, and it has not been previously associated with OCIC function, we set out to define its functional role in this cell subpopulation.
OC spheres showed a 3.5-fold increase in NT5E expression as compared with FTE spheres (Table S2). Both fluorescence-activated cell sorting (FACS) analysis and immunofluorescence staining confirmed the gene expression data, showing that OC spheres contained higher levels of CD73 than FTE spheres (Figures 2A and 2B). FACS sorting the CD73high fraction of OC cells yielded cells with higher production of extracellular adenosine (Figure 2C) than CD73low cells, confirming the correlation between CD73 expression and 5′-ectonucleotidase activity and validating FACS-based separation of these cell subpopulations. CD73high fractions from different primary OC cell cultures (Figure 2D) exhibited higher SFE than their CD73low counterparts (Figures 2E and S3B). No alterations in CD73 expression during sphere formation were observed in the two sorted populations (not shown), consistent with the correlation between CD73 levels and SFE. Finally, CD73 expression was markedly upregulated, at both mRNA and protein levels, in OC-derived spheres as compared with their parental bulk cell population (Figures S3A and S3B). Co-expression of CD73 with known OC markers, such as PAX8 and Cytokeratin-8 (Figure S3C), confirmed that CD73-expressing cells are indeed OC cells.
Figure 2.

CD73 Is Enriched in OC-Derived Spheres
(A) Second-generation spheres from FTE and OC samples were analyzed by citofluorimetry for CD73 expression. Insets show the negative control analyses with no antibody. Data refer to a representative experiment out of three, which gave similar results.
(B) Representative images of second-generation spheres derived from primary samples (OC and FTE) stained for CD73 (red) and counterstained with DAPI (blue). Scale bars, 50 μm. The experiment was performed on three independent samples with similar results. See also Figures S3A and S3C.
(C) Adenosine production in OC primary cells, previously FACS-sorted into CD73high and CD73low cells, was measured as described by Chisci et al. (2017). Data refer to three independent experiments (each performed in triplicate) and are expressed as means ± SEM. ∗∗∗p < 0.0005.
(D–E) Four different primary OC cells were FACS-sorted into CD73high and CD73low cells (D), followed by sphere formation assay of the two subpopulations (E). The CD73high fraction was enriched in sphere-forming cells from four independent OC samples. Each primary cell culture was tested in triplicate and data are expressed as means ± SD. See also Figure S3B.
CD73 has been reported to contribute to the progression of various tumor types, mostly due to its role in immune evasion (Antonioli et al., 2016). However, whether this molecule plays a role in CICs, and particularly in OCICs, has remained elusive. Therefore, we set out to investigate the functional contribution of CD73 to OCIC properties.
First, we assessed the impact of ablating CD73 expression by short hairpin RNAs (shRNAs) on the SFE of primary OC cells. The silencing of CD73 with three different shRNAs (Figure S4A) resulted in decreased SFE (Figure 3A), which suggested that CD73 is functionally involved in OCICs. Along this line, the CD73 inhibitor APCP, which prevents adenosine production (Burger and Lowenstein, 1975), significantly reduced sphere formation in primary OC (Figure 3B). Similar results were obtained with the adenosine receptor antagonist caffeine (Fredholm et al., 1999) (Figure 3B). Finally, adenosine treatment was sufficient to enhance sphere formation in OC cells (Figure 3C). In support of such a role of adenosine, OC spheres expressed different members of the adenosine receptor family (Figure S5A). Overall, these data supported the notion that CD73 promotes OC stemness traits via adenosine production.
Figure 3.

CD73 Promotes OC Sphere Formation via Adenosine
(A) Primary tumor cells derived from four independent OC samples were transduced with three different shRNAs against CD73 (Sh2-4) or with control shRNA, followed by SFE assay. See also Figure S4.
(B and C) Primary tumor cells from three independent OC samples were subjected to sphere formation assay in the presence of 50 μM APCP, 100 μM caffeine (B), or 100 μM adenosine (C), or vehicle only. Spheres were counted at day 6. Data refer to primary cells from four (A) or three independent samples (B and C), each tested in triplicate, and are expressed as means ± SEM.
∗p < 0.05; ∗∗∗p < 0.005. See also Figures S5A and S5B.
We then tested whether CD73 also modulates the tumor-initiating potential of OCICs. Primary OC cells in which CD73 expression was reduced with two different shRNAs (Sh2 and Sh4; Figure S4A) were tested in tumor initiation assays upon subcutaneous injection into immunodeficient mice. At 180 days after injection, control OC cells formed tumors in all mice, with a tumor latency of 110–150 days. Conversely, no tumors were observed in mice injected with either Sh2- or Sh4-expressing cells. At 250 days, all mice injected with Sh2-expressing cells remained tumor free, while tumors were found in three out of four mice bearing Sh4 knockdown tumors. Furthermore, control OC cells exhibited a high tumor growth rate, whereas the tumors generated by Sh4-expressing cells were remarkably slow and remained very small even at late time points (Figure 4B).
Figure 4.

CD73 Is Involved in OC Initiation and Growth
OC5 primary cells transduced with either anti-CD73 shRNAs (Sh2 and Sh4) or with a control shRNA were injected subcutaneously into NSG mice at 5,000 cells/mouse (n = 4). Mice were assessed for tumor take at day 180 (A) and tumor growth was monitored at different time points (B). Data are expressed as means ± SEM. ∗p < 0.05 compared with control shRNA.
Thus, CD73 is required for OC initiation and growth, which confirms the pivotal role of this molecule in OCIC function.
CD73 as a Therapeutic Target in OCIC
CD73-neutralizing antibodies are emerging as potential therapeutic tools (Antonioli et al., 2016, Antonioli et al., 2017). In this context, the recently developed monoclonal antibody 2C5 has been reported to inhibit CD73 nucleotidase activity (Young et al., 2016). In agreement with our results on CD73 knockdown cells, 2C5 reduced the sphere-forming ability in primary OC cells from three different patients (Figure 5A), suggesting that antibody-mediated neutralization of CD73 targets OCIC function. This hypothesis was further supported by the observation that 2C5, but not a control antibody, dramatically delayed tumor initiation and tumor growth in patient-derived xenograft models in immunodeficient mice (Figure 5B). Furthermore, 2C5 inhibited the growth of pre-established OC xenografts, while a high tumor growth rate was observed with the control antibody (Figure 5C).
Figure 5.

CD73 Is a Potential Therapeutic Target
(A) Primary OC cells were subjected to sphere formation assay in the presence of anti-CD73 mAb 2C5 or the control mAb 1A7 (20 μg/mL). Spheres were counted at day 6. Data refer to cells from three independent OC samples (each tested in triplicate) and are expressed as means ± SEM. ∗p < 0.05 as compared with 1A7-treated cells.
(B) Tumor initiation assays in NSG mice (n = 8) were performed with patient-derived OC samples as described in Experimental Procedures. Mice were treated either with 2C5 or with the control antibody 1A7, and tumor growth was monitored (left graph). Tumor take was determined as number of mice with palpable tumors at the indicated time points (right table).
(C) Patient-derived OC xenografts in NSG mice (n = 8) were allowed to grow up to 70 mm3, followed by treatment with 2C5 or 1A7.
Data are expressed as means ± SEM. ∗∗∗p < 0.0001.
Thus, CD73 inactivation through neutralizing antibodies interfered with both sphere formation and tumorigenesis, supporting the feasibility of targeting this molecule to counteract OCIC function.
CD73 Regulates the Expression of Stemness- and EMT-Associated Genes
To gain insights into the possible molecular mechanisms that account for the role of CD73 in the CIC-like traits of OC cells, we tested the hypothesis that CD73 regulates the expression of key genes involved in stemness and/or EMT, namely two fundamental hallmarks of CICs. Indeed, shRNA-mediated silencing of CD73 in primary OC cells resulted in the decreased expression of different stemness and EMT-related genes including CD44, NANOG, POU5F1/OCT4, SNAI1, TWIST1, and ZEB1 (Figure 6A). Of note, the expression of EMT-associated transcription factors in primary OC cells was reduced by APCP and upregulated by exogenous adenosine (Figure S5B), thus implicating the ectonucleotidase activity of CD73 in its ability to regulate EMT.
Figure 6.

CD73 Regulates the Expression of Stemness- and EMT-Related Genes and OC Cell Morphology
(A) CD73 knockdown OC primary cells (OC5) were analyzed for the expression of genes related to stemness and EMT. Data are expressed as the relative mRNA expression (2−ΔΔCT) of reported genes in silenced cells as compared with control cells (dashed line). The experiment was performed in triplicate and data are expressed as means ± SD.
(B) Representative images of morphological changes in primary OC adherent cells after CD73 silencing. CD73 knockdown induced a phenotypic reversion from a mesenchymal to epithelial morphology in OC cells. Scale bars, 400 μm. See also Figure S5C.
Notably, an in silico analysis on the The Cancer Genome Atlas (TCGA) database (http://www.cbioportal.org) revealed that CD73 is co-regulated with several genes in OC, and among the top scorers we found genes implicated in EMT (FAP, FN1, WISP1, etc.) and cancer stemness (NNMT [D'Andrea et al., 2011], DCN [Farace et al., 2015], RUNX2 [Ferrari et al., 2015], and VCAN [Du et al., 2013]) (Table S4), thus supporting the association of CD73 with the OCIC phenotype.
Furthermore, the ablation of CD73 expression also promoted dramatic morphologic rearrangements in primary OC cells, which reverted from a mesenchymal to an epithelial-like phenotype (Figure 6B). Accordingly, CD73 knockdown cells exhibited upregulation of the epithelial marker E-cadherin, which localized at the cell-cell junctions. The levels of the mesenchymal markers N-cadherin and vimentin, conversely, were markedly reduced in CD73 knockdown cells (Figure S5C).
These findings suggest that CD73 orchestrates OCIC function by sustaining the expression of genes that play a pivotal role in stemness and in EMT.
Clinical Significance of CD73 in OC
Since CD73 was specifically enriched in OC-derived as opposed to FTE-derived spheres, we checked whether the protein was expressed at different levels between human OC and normal FTE. To this goal, an immunohistochemical screening for CD73 was conducted on a tissue microarray containing 115 HGSOC samples and 17 normal fimbriae. CD73 was not found in the epithelium of healthy fimbriae, while it was expressed in 71 OC samples (62%). Of note, the pattern of CD73 expression in tumors was quite heterogeneous, ranging from samples with only a small subset of positive cells to samples where the vast majority of tumor cells were CD73 positive (Figures S6A–S6D).
The level of CD73 in OC correlates with poor prognosis (Turcotte et al., 2015). We extended that observation by analyzing the prognostic significance of CD73 in patient subgroups. A meta-analysis conducted on 13 OC gene expression datasets including TCGA (http://kmplot.com/analysis/index.php?p=service&cancer=ovar) revealed that high CD73 expression was associated with a shorter progression-free and overall survival even in patients with low-grade serous OC (p < 0.01, Figures S6E and S6F), i.e., a cohort with a relatively favorable prognosis (Gershenson, 2016). A similar association of CD73 levels with shorter progression-free and overall survival was observed in OC patients with suboptimal debulking (p < 0.001; Figures S6G and S6H), while no association was found in optimally debulked patients (not shown). This role of CD73 as a biomarker of poor prognosis in OC is in agreement with its function in OCICs.
Discussion
Our study implicates CD73 as a player in OCICs. CD73 is a well-established surface marker of mesenchymal stem cells (Calloni et al., 2013). However, little is known about the expression and function of CD73 in other types of stem cells, in particular in CICs. In fact, to our knowledge, the functional contribution of CD73 to CICs has been reported only in cell lines from pancreatic neuroendocrine (Katsuta et al., 2016) and mammary tumors (Yu et al., 2017). The role of CD73 in OCIC function is consistent with previous reports on the expression and the biological activity of CD73 in OC. For example, among the molecular classes of OC identified by functional genomics, the CD73-encoding gene NT5E was found differentially expressed in the subtypes Stem-A and Stem-B (Tan et al., 2013). In addition, OCICs are thought to account for the development of chemoresistance, and CD73 is upregulated in cisplatin-resistant OC spheroids (Chowanadisai et al., 2016) and modulates platinum sensitivity in OC cells (Nevedomskaya et al., 2016). Finally, CD73 has been implicated in OC cell proliferation and inhibition of apoptosis (Turcotte et al., 2015). The functional role of CD73 in tumor cells is not limited to OC, since this molecule confers invasive properties to head and neck squamous carcinoma cells (Ren et al., 2016) and to mammary carcinoma cells (Zhi et al., 2007). Of note, CD73 marks a subpopulation of mammary cells endowed with lineage plasticity (Roy et al., 2013) and correlates with CIC traits in breast cancer cell lines (Yu et al., 2017).
We demonstrate here that not only CD73 is enriched in primary sphere-forming cells from OC compared with normal FTE, but it is also required for sphere formation and tumor initiation in OC cells. Sphere formation is a widely employed assay in the CIC field in that it allows studying stemness-associated features, such as resistance to anoikis, self-renewal, and differentiation potential, at the single-cell level (Weiswald et al., 2015). In this context, the molecular mechanism underlying the role of CD73 in OC sphere formation appears to entail the regulation of stemness-associated genes such as NANOG, POU5F1/OCT4, and SOX2, which encode transcription factors that drive self-renewal and multipotency. All these transcription factors are associated with malignancy and poor prognosis in OC and have been proposed to drive OCIC function (Bareiss et al., 2013, Peng et al., 2010, Siu et al., 2013), which, in turn, promotes OC initiation, progression, and chemoresistance (Lupia and Cavallaro, 2017).
An increasing body of evidence has implicated EMT as a defining property of CICs in several tumor types including OC (Chen et al., 2013). While it remains unclear to what extent EMT is required for the generation of CICs, many lines of evidence indicate that EMT is causally involved in maintaining cancer stemness and in CIC plasticity, thus contributing not only to tumor initiation, metastasis, and recurrence but also to tumor heterogeneity (Chen et al., 2013). The acquisition of mesenchymal traits in OC is accompanied by the upregulation of CD73 (Turcotte et al., 2015), an observation supported by our finding of the co-regulation of CD73 with EMT-associated genes in OC samples. In this context, it is possible that the sustained expression of CD73 during sphere formation is driven by OCIC-associated EMT. Nevertheless, whether CD73 plays a functional role in EMT remains to be established. CD73 has been proposed to act as an effector of transforming growth factor β1-induced EMT in gallbladder tumor cells. Our data in OC provide a mechanistic basis to these observations by implicating CD73 in the transcriptional regulation of key EMT driver genes such as SNAI1, TWIST1, and ZEB1. Given that CD73 can be expressed in a high proportion of OC cells within a tumor (which most likely include non-stem cancer cells), and that EMT contributes to various aspects of OC biology beyond its CIC compartment (Davidson et al., 2012), one can speculate that CD73-induced EMT mediates both OC stemness and progression. This implies that CD73-targeted treatments would offer the dual advantage of inhibiting OCIC function and counteracting EMT-dependent OC malignancy, resulting in a synergistic increase of therapeutic efficacy.
Our data on the regulation of both stemness- and EMT-associated genes indicate that CD73 can influence the transcriptional activity in OC cells. However, how CD73 exerts such a regulatory role remains elusive. As a 5′-ectonucleotidase, the main function of CD73 is the catabolism of extracellular AMP into adenosine. The latter has been reported to promote breast cancer cell migration and metastasis (Stagg et al., 2010), implying the ability of adenosine to trigger signaling pathways involved in tumor progression. Thus, adenosine could act as the effector of CD73-dependent regulation of gene expression in OC, as supported by our data on the expression of specific adenosine receptors in OCICs. This would be consistent with the observation that the expression of the stemness genes SOX2, NANOG and OCT3/4 requires CD73-generated adenosine (Pan et al., 2016). On the other hand, the small-molecule CD73 inhibitor APCP affected only to a certain extent CD73-induced expression of epidermal growth factor (EGF) receptor in colorectal cancer cells, while the genetic inactivation produced a much stronger effect (Wu et al., 2016), thus implicating also a non-enzymatic role of CD73 in this context. In addition, other studies in different experimental systems have supported the notion that CD73 can exert its biological function through both adenosine-dependent and -independent mechanisms (Allard et al., 2014, Mikhailov et al., 2008, Terp et al., 2013), implying that the same may occur for the regulation of gene expression and OCIC function. The identification of such mechanisms will provide novel and relevant insights into the pathophysiology of OCICs.
Our findings on the role of CD73 in OCICs might also have relevant immunological implications. In contrast to the immunostimulatory role of AMP, extracellular adenosine has immunosuppressive function in that it quenches the activity of various immune cell lineages, including T cells, natural killer cells, and antigen-presenting cells (Allard et al., 2016, Antonioli et al., 2013). The expression of CD73 in cancer cells and in the tumor microenvironment (regulatory T cells, myeloid-derived suppressor cells, and endothelial cells), therefore, has been causally linked to the ability of many tumor types to evade immune surveillance. Along this line, targeting CD73 is viewed as a promising strategy to support and enhance the anti-tumor immune response, thus synergizing with other immune-based or cytotoxic treatments (Allard et al., 2016, Antonioli et al., 2013). In the context of CD73-targeted therapies, our study offers an additional therapeutic opportunity based on the possibility to inhibit the immune evasion of OCICs. An increasing body of evidence, indeed, indicates that CICs from different tumor types utilize various molecular mechanisms to elude the immune cell response and to favor an immunosuppressive microenvironment (Codony-Servat and Rosell, 2015, Jachetti et al., 2015, Qian et al., 2015, Silver et al., 2016, Zhang et al., 2015). For example, the expression of cell-surface CD47 in certain CICs provides a “don't eat me” signal which protects CICs from macrophage phagocytosis (Chan et al., 2009, Krampitz et al., 2016, Zhang et al., 2015). By analogy to CD47, it is conceivable that CD73 in OCICs serves the function of evading innate immune surveillance, an intriguing hypothesis that deserves further investigation.
The development of CD73-targeting antibodies as therapeutic tools is becoming the focus of intense research (Antonioli et al., 2016, Antonioli et al., 2017, Hay et al., 2016). Such reagents have given promising results in OC models where, however, they have been mostly investigated in the context of immune evasion (Häusler et al., 2014, Wang et al., 2011). Based on our pilot studies with the 2C5 antibody, future work should address to what extent CD73-targeted therapies impact on OCIC function, thus paving the way to novel strategies aimed at the OC eradication through the simultaneous inhibition of cancer stemness, EMT and immune escape.
Experimental Procedures
Primary Cells
Fresh tissue samples were obtained upon informed consent from patients undergoing surgery at the Gynecology Division of the European Institute of Oncology, Milan (Table S1). High-grade serous epithelial OC cells were derived from peritoneal ascites or from tumor biopsies of patients who had primary, not recurrent, OC and had not yet undergone chemotherapy. Primary cells from FTE were derived from non-neoplastic fimbriae, from patients undergoing adnexectomy for non-ovarian gynecological pathologies. The isolation and culture of primary cells were performed as described previously (Francavilla et al., 2017). Tumor-derived cells were used at passage 1, while FTE-derived cells were mostly used at passage 3. The purity of primary cell cultures, monitored by immunostaining for the epithelial cytokeratins 5, 7, and 8, or for pan-cytokeratins, was consistently over 95%.
Sphere-Forming Assay
Single-cell suspensions from either normal or tumor primary cultures were seeded in poly-(2-hydroxyethyl methacrylate) (P3932-25G, Sigma)-coated dishes at a density of 5 × 10³ cells/mL in serum-free MEBM (Lonza) supplemented with 2 mM L-glutamine, 100 U/mL penicillin and 100 μg/mL streptomycin, 5 μg/mL insulin, 0.5 μg/mL hydrocortisone, 1 U/mL heparin, 2% B27, 20 ng/mL EGF, and 20 ng/mL basic fibroblast growth factor. Sphere formation was assessed 5–7 days after seeding. The SFE was defined as the ratio between the number of spheres and the number of cells seeded. To perform the gene expression analysis, first-generation spheres were dissociated and re-seeded as described above in order to obtain second-generation spheres.
When needed, 20 μg/mL of anti-CD73 antibody 2C5 or the isotype-matched control 1A7, 50 μM adenosine 5-(α,β-methylene)diphosphate (APCP; catalog no. M3763), 100 μM caffeine (catalog no. C0750), or 100 μM adenosine (catalog no. A4036; Sigma-Aldrich) were added to suspension cultures on day 0, 2, and 4 after seeding. Sphere formation was assessed 6 days after seeding.
qRT-PCR Analysis
Total RNA was isolated from adherent cultures or from spheres using the RNeasy Mini Kit (QIAGEN) according to manufacturer's protocol. cDNA samples (5 ng) were amplified in triplicate with the TaqMan 710 Gene Expression Assay (Applied Biosystems) using an ABI/Prism 7900 HT thermocycler (Applied Biosystems). Gene expression levels were normalized against housekeeping human GAPDH for primary adherent cells and for the corresponding second-generation spheres, and against the geometric mean of the human housekeeping genes GAPDH, GUSB, and HPRT1 for the silenced primary cells. TaqMan assays for specific genes are listed in Table S5. Normalized expression changes were determined with the comparative threshold cycle (2−ΔΔCT) method.
Gene Expression Profile
The Affymetrix microarray analysis was performed on second-generation spheres derived from the samples listed in Table S1. After RNA extraction, samples derived from OC or from FTE were grouped into two independent pools for each tissue type (Table S1). The Ovation Pico WTA System V2 (NuGEN) was used to amplify 5 ng of total RNA according to the manufacturer's protocol. Each pool was labeled and hybridized to the Affymetrix Human Gene 2.1 ST Array Strip according to the manufacturer’s instructions (Affymetrix). Data were normalized using the Robust Multiarray Average (Irizarry et al., 2003) using the Affymetrix Expression Console software. Raw and normalized data were deposited in GEO database (http://www.ncbi.nlm.nih.gov/geo/; accession number GSE90125).
Immunofluorescence
Cytospins where prepared with second-generation spheres derived from primary cells, while adherent primary cells were grown on collagen I-coated glass coverslips. Adherent cells and spheres were then fixed with 4% paraformaldehyde for 10 min at room temperature, followed by immunofluorescence staining with the following antibodies: anti-CD73 (clone AA60E3.3), generated by E. Dejana (Milan) and produced by the Biochemistry Unit at Cogentech, Milan; anti-CD24 (catalog no. 555427), anti-CD106 (catalog no. 555647), anti-E-cadherin (catalog no. 610182), and anti-N-cadherin (catalog no. 610921) from BD Biosciences; anti-NrCAM (ProteinTech, catalog no. 21,608-1-AP), anti-CD44 (clone Hermes-3, from U. Günthert, Basel), anti-vimentin (Abcam, catalog no. Ab92451), anti-CK8 (Troma-I, generated by R. Kemler and distributed by Developmental Studies Hybridoma Bank, University of Iowa), anti-PAX8 (ProteinTech, catalog no. 10,336-1-AP), anti-adenosine A2a receptor (Alpha Diagnostic International, catalog no. A2aR21-S), anti-adenosine A2b receptor (Alpha Diagnostic International, catalog no. A2bR23-S), and anti-adenosine A3 receptor (Alpha Diagnostic International, catalog no. A3R32-S). The staining was performed as described previously (Francavilla et al., 2017).
FACS Analysis
Both adherent cells and second-generation spheres were trypsinized to obtain a single-cell suspension. Cells were then stained with phycoerythrin-conjugated mouse anti-human CD73 (BD Biosciences, catalog no. 550257). The percentage of positive cells was measured by BD Influx Sorter (BD Biosciences).
Lentiviral Infection
Lentiviral vectors were generated by transient co-transfection of the packaging cell line HEK293T, purchased from ATCC and cultured as described previously (Francavilla et al., 2017), with 10 μg of the following anti-CD73 shRNA from Genecopoeia: Sh2 (5′-GAGGACACTCCAACACATT-3′; HSH011932-2-LVRU6P); Sh3 (5′-CCTAGGCTATCTGAAGATC-3′; HSH011932-3-LVRU6P); Sh4 (5′-AGCAGCATTCCTGAAGATC-3′, HSH011932-4-LVRU6P) or with the scrambled control (CSHCTR001-LVRU6P, Genecopoeia), and the following packaging vectors: PMD2G (3 μg), Rre (5 μg), and REV (2.5 μg), using the calcium phosphate precipitation method. The supernatant from HEK293T was then used to transduce the target cells. Selection of transduced cells was performed with 1 μg/mL puromycin for 5–7 days.
Cell Lysis and Immunoblotting
Primary ovarian cancer cells and ovarian cancer cell lines cultured in complete medium were lysed in RIPA buffer (0.1% SDS, 0.5% sodium deoxycholate, 1% Triton X-100, 150 mM NaCl, 50 mM Tris [pH 7.4], 1 mM Na-orthovanadate, 10 mM NaF, 200× Protease Inhibitor Cocktail from Calbiochem). Lysates were sonicated and centrifuged, and the pellets were discarded. Equal amount of proteins was separated by SDS-PAGE and transferred onto nitrocellulose membranes. Immunoblotting was performed with anti-CD73 (clone 1D7; Abcam, catalog no. ab91086) and anti-vinculin (Sigma, catalog no. V9131). The signal was detected by the Clarity Western ECL Substrate (Bio-Rad) and the images were acquired by ChemiDoc (Bio-Rad) and analyzed using the Image Lab software (Bio-Rad).
Immunohistochemistry
Immunohistochemical staining was performed either on 3-μm sections from formalin-fixed, paraffin-embedded tissue samples or on a tissue microarray with FTE and OC samples from patients operated at the European Institute of Oncology in Milan between 2014 and 2016. The staining was performed as described previously (Francavilla et al., 2017), after antigen retrieval with Tris-EDTA (pH 9.0), at 95°C for 50 min. The rabbit monoclonal anti-CD73 (clone D7F9A, Cell Signaling Technology, catalog no. 13160) was used as primary antibody. CD73 signal was analyzed and scored by a trained pathologist (G.B.).
In Vivo Models
All animal studies were performed following a protocol approved by the fully authorized animal facility of our Institution and by the Italian Ministry of Health (as required by the Italian Law) (IACUCs no. 757/2015) and in accordance with EU directive 2010/63.
OC primary cells were first subjected to next-generation sequencing to confirm their identity as HGSOC. Cells exhibited the TP53 mutation 796G > T (G266Ter). In addition, cells carried the 1114A > C (N372H) substitution in the BRCA2 gene, which has been associated with increased cancer risk (Li et al., 2017). Both mutations were also found in the original tumor, which had been diagnosed as an HGSOC by a trained pathologist (G.B.). Control or CD73 silenced primary cells were then trypsinized, counted, re-suspended in 100 μL PBS/Matrigel 1:1 solution, and injected subcutaneously into the flank of 6- to 7-week-old female NOD-scid IL2rγnull (NSG) mice (5 × 10³ cells/mouse). Tumor latencies were then determined as the time from the injection to the formation of palpable masses. For tumor initiation assays, mice were treated with the anti-CD73 antibody 2C5 starting from day 2 after OC injection. The treatment of mice with established tumors, instead, was started when tumor masses had reached a volume of approximately 70 mm3. Mice were treated biweekly with intra-peritoneal injection of 2C5 or the isotype-matched antibody 1A7 (20 mg/kg) (Young et al., 2016). Tumor size was determined by caliper measurement and the growth curves of different tumors were finally calculated with the formula Tumor volume = 1/2(length × width2) (Euhus et al., 1986).
Kaplan-Meier Curves
The Kaplan-Meier online plotter tool (http://kmplot.com/analysis/) was used to generate survival curves by combining NT5E/CD73 mRNA data from serous ovarian cancer patients from 13 public ovarian cancer datasets (Gyorffy et al., 2012), according to the best cutoff values auto-selected by the plotter tool. Log rank p value and hazard ratio (and 95% confidence intervals) were calculated and displayed on the webpage.
Statistical Analysis
Microarray Analysis
Affymetrix gene expression analysis was performed using BRB-ArrayTools 4.5.0 (https://brb.nci.nih.gov/BRB-ArrayTools/). All the 53,617 Affymetrix probesets (Human Gene 2.1 ST Array) were considered in the analysis. A two-sample t test (with random variance model) and with global test was performed. Hierarchical clustering analysis was performed using Cluster 3.0 (http://bonsai.hgc.jp/∼mdehoon/software/cluster/software.htm) using median centered log2 transformed data (uncentered correlation and centroid linkage), and displayed by Java Treeview (http://jtreeview.sourceforge.net).
Ingenuity Pathway Analysis
Ingenuity Pathway Analysis (IPA)-Upstream Regulator Analysis was performed using the IPA default statistical analysis settings to calculate Z score and p value.
Other Analyses
Two-tailed Student's t test was used to determine the statistical significance. Differences were considered significant at p ≤ 0.05.
Author Contributions
M.L. performed most of the experiments. F.A. helped with the in-vivo assays and critically evaluated the results. G.B. is the trained pathologist who evaluated all the IHC and TMA data. S.F. helped with FACS-sorting and confocal acquisition of immunofluorescence experiments. K.F.S. provided the monoclonal antibody 2C5. E. C., B.K.-Z., R. T. S. and R.G. contributed to the experiments on the production of adenosine. S.C. contributed to the analysis of IHC results. N.C. provided clinical information. F.B. performed the Affymetrix analysis and critically evaluated the results. M.L and U.C. conceived the study, designed the experiments, critically evaluated the results and wrote the manuscript.
Acknowledgments
We are grateful to R. Bettolini for help with tissue processing, the IEO Biobank staff for collection and annotation of surgical samples, G. Jodice and C. Luise for assistance with TMA preparation and immunohistochemistry, S. Pirroni and M. Tillhon for assistance with RNA extraction, E. Dama for help with statistics, E. Dejana for sharing reagents, P.P. Di Fiore for support, E. Hurt and E. Sult from MedImmune for critical reading of the manuscript and for the preparation of the 2C5 antibody, respectively, and M. Giordano for helpful discussion. This work was supported by research grants from the Associazione Italiana Ricerca sul Cancro (AIRC IG-14622 to U.C.), the Worldwide Cancer Research (formerly known as the Association for International Cancer Research; AICR 10-0091 to U.C.), and the Fondazione Istituto Europeo di Oncologia (to M.L.).
Published: March 15, 2018
Footnotes
Supplemental Information includes six figures and five tables and can be found with this article online at https://doi.org/10.1016/j.stemcr.2018.02.009.
Supplemental Information
References
- Allard B., Beavis P.A., Darcy P.K., Stagg J. Immunosuppressive activities of adenosine in cancer. Curr. Opin. Pharmacol. 2016;29:7–16. doi: 10.1016/j.coph.2016.04.001. [DOI] [PubMed] [Google Scholar]
- Allard B., Turcotte M., Spring K., Pommey S., Royal I., Stagg J. Anti-CD73 therapy impairs tumor angiogenesis. Int. J. Cancer. 2014;134:1466–1473. doi: 10.1002/ijc.28456. [DOI] [PubMed] [Google Scholar]
- Antonioli L., Pacher P., Vizi E.S., Hasko G. CD39 and CD73 in immunity and inflammation. Trends Mol. Med. 2013;19:355–367. doi: 10.1016/j.molmed.2013.03.005. [DOI] [PMC free article] [PubMed] [Google Scholar]
- Antonioli L., Yegutkin G.G., Pacher P., Blandizzi C., Hasko G. Anti-CD73 in cancer immunotherapy: awakening new opportunities. Trends Cancer. 2016;2:95–109. doi: 10.1016/j.trecan.2016.01.003. [DOI] [PMC free article] [PubMed] [Google Scholar]
- Antonioli L., Novitskiy S.V., Sachsenmeier K.F., Fornai M., Blandizzi C., Hasko G. Switching off CD73: a way to boost the activity of conventional and targeted antineoplastic therapies. Drug Discov. Today. 2017;22:1686–1696. doi: 10.1016/j.drudis.2017.06.005. [DOI] [PubMed] [Google Scholar]
- Bareiss P.M., Paczulla A., Wang H., Schairer R., Wiehr S., Kohlhofer U., Rothfuss O.C., Fischer A., Perner S., Staebler A. SOX2 expression associates with stem cell state in human ovarian carcinoma. Cancer Res. 2013;73:5544–5555. doi: 10.1158/0008-5472.CAN-12-4177. [DOI] [PubMed] [Google Scholar]
- Burger R.M., Lowenstein J.M. 5’-Nucleotidase from smooth muscle of small intestine and from brain. Inhibition of nucleotides. Biochemistry. 1975;14:2362–2366. doi: 10.1021/bi00682a014. [DOI] [PubMed] [Google Scholar]
- Calloni R., Cordero E.A., Henriques J.A., Bonatto D. Reviewing and updating the major molecular markers for stem cells. Stem Cells Dev. 2013;22:1455–1476. doi: 10.1089/scd.2012.0637. [DOI] [PMC free article] [PubMed] [Google Scholar]
- Chan K.S., Espinosa I., Chao M., Wong D., Ailles L., Diehn M., Gill H., Presti J., Chang H.Y., van de Rijn M. Identification, molecular characterization, clinical prognosis, and therapeutic targeting of human bladder tumor-initiating cells. Proc. Natl. Acad. Sci. USA. 2009;106:14016–14021. doi: 10.1073/pnas.0906549106. [DOI] [PMC free article] [PubMed] [Google Scholar]
- Chen X., Zhang J., Zhang Z., Li H., Cheng W., Liu J. Cancer stem cells, epithelial-mesenchymal transition, and drug resistance in high-grade ovarian serous carcinoma. Hum. Pathol. 2013;44:2373–2384. doi: 10.1016/j.humpath.2013.05.001. [DOI] [PMC free article] [PubMed] [Google Scholar]
- Chisci E., De Giorgi M., Zanfrini E., Testasecca A., Brambilla E., Cinti A., Farina L., Kutryb-Zajac B., Bugarin C., Villa C. Simultaneous overexpression of human E5NT and ENTPD1 protects porcine endothelial cells against H2O2-induced oxidative stress and cytotoxicity in vitro. Free Radic. Biol. Med. 2017;108:320–333. doi: 10.1016/j.freeradbiomed.2017.03.038. [DOI] [PubMed] [Google Scholar]
- Chowanadisai W., Messerli S.M., Miller D.H., Medina J.E., Hamilton J.W., Messerli M.A., Brodsky A.S. Cisplatin resistant spheroids model clinically relevant survival mechanisms in ovarian tumors. PLoS One. 2016;11:e0151089. doi: 10.1371/journal.pone.0151089. [DOI] [PMC free article] [PubMed] [Google Scholar]
- Codony-Servat J., Rosell R. Cancer stem cells and immunoresistance: clinical implications and solutions. Transl. Lung Cancer Res. 2015;4:689–703. doi: 10.3978/j.issn.2218-6751.2015.12.11. [DOI] [PMC free article] [PubMed] [Google Scholar]
- D'Andrea F.P., Safwat A., Kassem M., Gautier L., Overgaard J., Horsman M.R. Cancer stem cell overexpression of nicotinamide N-methyltransferase enhances cellular radiation resistance. Radiother. Oncol. 2011;99:373–378. doi: 10.1016/j.radonc.2011.05.086. [DOI] [PubMed] [Google Scholar]
- Davidson B., Trope C.G., Reich R. Epithelial-mesenchymal transition in ovarian carcinoma. Front. Oncol. 2012;2:33. doi: 10.3389/fonc.2012.00033. [DOI] [PMC free article] [PubMed] [Google Scholar]
- Du W.W., Fang L., Yang X., Sheng W., Yang B.L., Seth A., Zhang Y., Yang B.B., Yee A.J. The role of versican in modulating breast cancer cell self-renewal. Mol. Cancer Res. 2013;11:443–455. doi: 10.1158/1541-7786.MCR-12-0461. [DOI] [PubMed] [Google Scholar]
- Euhus D.M., Hudd C., LaRegina M.C., Johnson F.E. Tumor measurement in the nude mouse. J. Surg. Oncol. 1986;31:229–234. doi: 10.1002/jso.2930310402. [DOI] [PubMed] [Google Scholar]
- Farace C., Oliver J.A., Melguizo C., Alvarez P., Bandiera P., Rama A.R., Malaguarnera G., Ortiz R., Madeddu R., Prados J. Microenvironmental modulation of decorin and lumican in temozolomide-resistant glioblastoma and neuroblastoma cancer stem-like cells. PLoS One. 2015;10:e0134111. doi: 10.1371/journal.pone.0134111. [DOI] [PMC free article] [PubMed] [Google Scholar]
- Ferrari N., Riggio A.I., Mason S., McDonald L., King A., Higgins T., Rosewell I., Neil J.C., Smalley M.J., Sansom O.J. Runx2 contributes to the regenerative potential of the mammary epithelium. Sci. Rep. 2015;5:15658. doi: 10.1038/srep15658. [DOI] [PMC free article] [PubMed] [Google Scholar]
- Francavilla C., Lupia M., Tsafou K., Villa A., Kowalczyk K., Rakownikow Jersie-Christensen R., Bertalot G., Confalonieri S., Brunak S., Jensen L.J. Phosphoproteomics of primary cells reveals druggable kinase signatures in ovarian cancer. Cell Rep. 2017;18:3242–3256. doi: 10.1016/j.celrep.2017.03.015. [DOI] [PMC free article] [PubMed] [Google Scholar]
- Fredholm B.B., Battig K., Holmen J., Nehlig A., Zvartau E.E. Actions of caffeine in the brain with special reference to factors that contribute to its widespread use. Pharmacol. Rev. 1999;51:83–133. [PubMed] [Google Scholar]
- Gershenson D.M. Low-grade serous carcinoma of the ovary or peritoneum. Ann. Oncol. 2016;27(Suppl 1):i45–i49. doi: 10.1093/annonc/mdw085. [DOI] [PubMed] [Google Scholar]
- Gyorffy B., Lanczky A., Szallasi Z. Implementing an online tool for genome-wide validation of survival-associated biomarkers in ovarian-cancer using microarray data from 1287 patients. Endocr. Relat. Cancer. 2012;19:197–208. doi: 10.1530/ERC-11-0329. [DOI] [PubMed] [Google Scholar]
- Häusler S.F.M., del Barrio I.M., Diessner J., Stein R.G., Strohschein J., Hönig A., Dietl J., Wischhusen J. Anti-CD39 and anti-CD73 antibodies A1 and 7G2 improve targeted therapy in ovarian cancer by blocking adenosine-dependent immune evasion. Am. J. Transl. Res. 2014;6:129–139. [PMC free article] [PubMed] [Google Scholar]
- Hay C.M., Sult E., Huang Q., Mulgrew K., Fuhrmann S.R., McGlinchey K.A., Hammond S.A., Rothstein R., Rios-Doria J., Poon E. Targeting CD73 in the tumor microenvironment with MEDI9447. Oncoimmunology. 2016;5:e1208875. doi: 10.1080/2162402X.2016.1208875. [DOI] [PMC free article] [PubMed] [Google Scholar]
- Irizarry R.A., Hobbs B., Collin F., Beazer-Barclay Y.D., Antonellis K.J., Scherf U., Speed T.P. Exploration, normalization, and summaries of high density oligonucleotide array probe level data. Biostatistics. 2003;4:249–264. doi: 10.1093/biostatistics/4.2.249. [DOI] [PubMed] [Google Scholar]
- Jachetti E., Caputo S., Mazzoleni S., Brambillasca C.S., Parigi S.M., Grioni M., Piras I.S., Restuccia U., Calcinotto A., Freschi M. Tenascin-C protects cancer stem-like cells from immune surveillance by arresting T-cell activation. Cancer Res. 2015;75:2095–2108. doi: 10.1158/0008-5472.CAN-14-2346. [DOI] [PubMed] [Google Scholar]
- Janzen D.M., Tiourin E., Salehi J.A., Paik D.Y., Lu J., Pellegrini M., Memarzadeh S. An apoptosis-enhancing drug overcomes platinum resistance in a tumour-initiating subpopulation of ovarian cancer. Nat. Commun. 2015;6:7956. doi: 10.1038/ncomms8956. [DOI] [PMC free article] [PubMed] [Google Scholar] [Retracted]
- Katsuta E., Tanaka S., Mogushi K., Shimada S., Akiyama Y., Aihara A., Matsumura S., Mitsunori Y., Ban D., Ochiai T. CD73 as a therapeutic target for pancreatic neuroendocrine tumor stem cells. Int. J. Oncol. 2016;48:657–669. doi: 10.3892/ijo.2015.3299. [DOI] [PubMed] [Google Scholar]
- Krampitz G.W., George B.M., Willingham S.B., Volkmer J.P., Weiskopf K., Jahchan N., Newman A.M., Sahoo D., Zemek A.J., Yanovsky R.L. Identification of tumorigenic cells and therapeutic targets in pancreatic neuroendocrine tumors. Proc. Natl. Acad. Sci. USA. 2016;113:4464–4469. doi: 10.1073/pnas.1600007113. [DOI] [PMC free article] [PubMed] [Google Scholar]
- Kwon A.Y., Kim G.I., Jeong J.Y., Song J.Y., Kwack K.B., Lee C., Kang H.Y., Kim T.H., Heo J.H., An H.J. VAV3 overexpressed in cancer stem cells is a poor prognostic indicator in ovarian cancer patients. Stem Cells Dev. 2015;24:1521–1535. doi: 10.1089/scd.2014.0588. [DOI] [PMC free article] [PubMed] [Google Scholar]
- Li Q., Guan R., Qiao Y., Liu C., He N., Zhang X., Jia X., Sun H., Yu J., Xu L. Association between the BRCA2 rs144848 polymorphism and cancer susceptibility: a meta-analysis. Oncotarget. 2017;8:39818–39832. doi: 10.18632/oncotarget.16242. [DOI] [PMC free article] [PubMed] [Google Scholar]
- Liao J., Qian F., Tchabo N., Mhawech-Fauceglia P., Beck A., Qian Z., Wang X., Huss W.J., Lele S.B., Morrison C.D. Ovarian cancer spheroid cells with stem cell-like properties contribute to tumor generation, metastasis and chemotherapy resistance through hypoxia-resistant metabolism. PLoS One. 2014;9:e84941. doi: 10.1371/journal.pone.0084941. [DOI] [PMC free article] [PubMed] [Google Scholar]
- Lupia M., Cavallaro U. Ovarian cancer stem cells: still an elusive entity? Mol. Cancer. 2017;16:64. doi: 10.1186/s12943-017-0638-3. [DOI] [PMC free article] [PubMed] [Google Scholar]
- Matulonis U.A., Sood A.K., Fallowfield L., Howitt B.E., Sehouli J., Karlan B.Y. Ovarian cancer. Nat. Rev. Dis. Primers. 2016;2:16061. doi: 10.1038/nrdp.2016.61. [DOI] [PMC free article] [PubMed] [Google Scholar]
- Mikhailov A., Sokolovskaya A., Yegutkin G.G., Amdahl H., West A., Yagita H., Lahesmaa R., Thompson L.F., Jalkanen S., Blokhin D. CD73 participates in cellular multiresistance program and protects against TRAIL-induced apoptosis. J. Immunol. 2008;181:464–475. doi: 10.4049/jimmunol.181.1.464. [DOI] [PMC free article] [PubMed] [Google Scholar]
- Nassar D., Blanpain C. Cancer stem cells: basic concepts and therapeutic implications. Annu. Rev. Pathol. 2016;11:47–76. doi: 10.1146/annurev-pathol-012615-044438. [DOI] [PubMed] [Google Scholar]
- Nevedomskaya E., Perryman R., Solanki S., Syed N., Mayboroda O.A., Keun H.C. A systems oncology approach identifies NT5E as a key metabolic regulator in tumor cells and modulator of platinum sensitivity. J. Proteome Res. 2016;15:280–290. doi: 10.1021/acs.jproteome.5b00793. [DOI] [PubMed] [Google Scholar]
- Pan D., Roy S., Gascard P., Zhao J., Chen-Tanyolac C., Tlsty T.D. SOX2, OCT3/4 and NANOG expression and cellular plasticity in rare human somatic cells requires CD73. Cell Signal. 2016;28:1923–1932. doi: 10.1016/j.cellsig.2016.09.008. [DOI] [PMC free article] [PubMed] [Google Scholar]
- Pastò A., Bellio C., Pilotto G., Ciminale V., Silic-Benussi M., Guzzo G., Rasola A., Frasson C., Nardo G., Zulato E. Cancer stem cells from epithelial ovarian cancer patients privilege oxidative phosphorylation, and resist glucose deprivation. Oncotarget. 2014;5:4305–4319. doi: 10.18632/oncotarget.2010. [DOI] [PMC free article] [PubMed] [Google Scholar]
- Pattabiraman D.R., Weinberg R.A. Tackling the cancer stem cells - what challenges do they pose? Nat. Rev. Drug Discov. 2014;13:497–512. doi: 10.1038/nrd4253. [DOI] [PMC free article] [PubMed] [Google Scholar]
- Peng S., Maihle N.J., Huang Y. Pluripotency factors Lin28 and Oct4 identify a sub-population of stem cell-like cells in ovarian cancer. Oncogene. 2010;29:2153–2159. doi: 10.1038/onc.2009.500. [DOI] [PubMed] [Google Scholar]
- Perets R., Drapkin R. It's totally tubular…riding the new wave of ovarian cancer research. Cancer Res. 2016;76:10–17. doi: 10.1158/0008-5472.CAN-15-1382. [DOI] [PMC free article] [PubMed] [Google Scholar]
- Qian X., Ma C., Nie X., Lu J., Lenarz M., Kaufmann A.M., Albers A.E. Biology and immunology of cancer stem(-like) cells in head and neck cancer. Crit. Rev. Oncol. Hematol. 2015;95:337–345. doi: 10.1016/j.critrevonc.2015.03.009. [DOI] [PubMed] [Google Scholar]
- Ren Z.H., Lin C.Z., Cao W., Yang R., Lu W., Liu Z.Q., Chen Y.M., Yang X., Tian Z., Wang L.Z. CD73 is associated with poor prognosis in HNSCC. Oncotarget. 2016;7:61690–61702. doi: 10.18632/oncotarget.11435. [DOI] [PMC free article] [PubMed] [Google Scholar]
- Roy S., Gascard P., Dumont N., Zhao J., Pan D., Petrie S., Margeta M., Tlsty T.D. Rare somatic cells from human breast tissue exhibit extensive lineage plasticity. Proc. Natl. Acad. Sci. USA. 2013;110:4598–4603. doi: 10.1073/pnas.1218682110. [DOI] [PMC free article] [PubMed] [Google Scholar]
- Silver D.J., Sinyuk M., Vogelbaum M.A., Ahluwalia M.S., Lathia J.D. The intersection of cancer, cancer stem cells, and the immune system: therapeutic opportunities. Neuro Oncol. 2016;18:153–159. doi: 10.1093/neuonc/nov157. [DOI] [PMC free article] [PubMed] [Google Scholar]
- Siu M.K., Wong E.S., Kong D.S., Chan H.Y., Jiang L., Wong O.G., Lam E.W., Chan K.K., Ngan H.Y., Le X.F. Stem cell transcription factor NANOG controls cell migration and invasion via dysregulation of E-cadherin and FoxJ1 and contributes to adverse clinical outcome in ovarian cancers. Oncogene. 2013;32:3500–3509. doi: 10.1038/onc.2012.363. [DOI] [PubMed] [Google Scholar]
- Stagg J., Divisekera U., McLaughlin N., Sharkey J., Pommey S., Denoyer D., Dwyer K.M., Smyth M.J. Anti-CD73 antibody therapy inhibits breast tumor growth and metastasis. Proc. Natl. Acad. Sci. USA. 2010;107:1547–1552. doi: 10.1073/pnas.0908801107. [DOI] [PMC free article] [PubMed] [Google Scholar]
- Tan T.Z., Miow Q.H., Huang R.Y., Wong M.K., Ye J., Lau J.A., Wu M.C., Bin Abdul Hadi L.H., Soong R., Choolani M. Functional genomics identifies five distinct molecular subtypes with clinical relevance and pathways for growth control in epithelial ovarian cancer. EMBO Mol. Med. 2013;5:983–998. doi: 10.1002/emmm.201201823. [DOI] [PMC free article] [PubMed] [Google Scholar]
- Terp M.G., Olesen K.A., Arnspang E.C., Lund R.R., Lagerholm B.C., Ditzel H.J., Leth-Larsen R. Anti-human CD73 monoclonal antibody inhibits metastasis formation in human breast cancer by inducing clustering and internalization of CD73 expressed on the surface of cancer cells. J. Immunol. 2013;191:4165–4173. doi: 10.4049/jimmunol.1301274. [DOI] [PubMed] [Google Scholar]
- Turcotte M., Spring K., Pommey S., Chouinard G., Cousineau I., George J., Chen G.M., Gendoo D.M., Haibe-Kains B., Karn T. CD73 is associated with poor prognosis in high-grade serous ovarian cancer. Cancer Res. 2015;75:4494–4503. doi: 10.1158/0008-5472.CAN-14-3569. [DOI] [PubMed] [Google Scholar]
- Wang L., Fan J., Thompson L.F., Zhang Y., Shin T., Curiel T.J., Zhang B. CD73 has distinct roles in nonhematopoietic and hematopoietic cells to promote tumor growth in mice. J. Clin. Invest. 2011;121:2371–2382. doi: 10.1172/JCI45559. [DOI] [PMC free article] [PubMed] [Google Scholar]
- Weiswald L.B., Bellet D., Dangles-Marie V. Spherical cancer models in tumor biology. Neoplasia. 2015;17:1–15. doi: 10.1016/j.neo.2014.12.004. [DOI] [PMC free article] [PubMed] [Google Scholar]
- Wu R., Chen Y., Li F., Li W., Zhou H., Yang Y., Pei Z. Effects of CD73 on human colorectal cancer cell growth in vivo and in vitro. Oncol. Rep. 2016;35:1750–1756. doi: 10.3892/or.2015.4512. [DOI] [PubMed] [Google Scholar]
- Young A., Ngiow S.F., Barkauskas D.S., Sult E., Hay C., Blake S.J., Huang Q., Liu J., Takeda K., Teng M.W. Co-inhibition of CD73 and A2AR adenosine signaling improves anti-tumor immune responses. Cancer Cell. 2016;30:391–403. doi: 10.1016/j.ccell.2016.06.025. [DOI] [PubMed] [Google Scholar]
- Yu J., Liao X., Li L., Lv L., Zhi X., Yu J., Zhou P. A preliminary study of the role of extracellular -5’- nucleotidase in breast cancer stem cells and epithelial-mesenchymal transition. In Vitro Cell Dev. Biol. Anim. 2017;53:132–140. doi: 10.1007/s11626-016-0089-y. [DOI] [PubMed] [Google Scholar]
- Zhang H., Lu H., Xiang L., Bullen J.W., Zhang C., Samanta D., Gilkes D.M., He J., Semenza G.L. HIF-1 regulates CD47 expression in breast cancer cells to promote evasion of phagocytosis and maintenance of cancer stem cells. Proc. Natl. Acad. Sci. USA. 2015;112:E6215–E6223. doi: 10.1073/pnas.1520032112. [DOI] [PMC free article] [PubMed] [Google Scholar]
- Zhi X., Chen S., Zhou P., Shao Z., Wang L., Ou Z., Yin L. RNA interference of ecto-5’-nucleotidase (CD73) inhibits human breast cancer cell growth and invasion. Clin. Exp. Metastasis. 2007;24:439–448. doi: 10.1007/s10585-007-9081-y. [DOI] [PubMed] [Google Scholar]
Associated Data
This section collects any data citations, data availability statements, or supplementary materials included in this article.