

Abstract
Background: A substantial increase in triglycerides (TGs) after a meal is associated with an increased risk of cardiovascular disease. Most studies investigating the effects of a meal on TGs have not used meals that reflect typical consumption.
Objective: The objective of this study was to compare the TG and inflammatory responses of true-to-life meals, containing moderate fat and energy contents, with a high-fat, high-energy, low-carbohydrate meal (HFM) typically used to test TG responses.
Methods: Nine healthy, insufficiently active men [mean ± SD age: 25.1 ± 6.7 y; body mass index (in kg/m2): 25.8 ± 7.0; <150 min moderate- to vigorous-intensity physical activity/wk] completed 3 meal trials in random order: an HFM (17 kcal/kg, 60% fat), a moderate-fat meal (MFM; 8.5 kcal/kg, 30% fat), and a biphasic meal (BPM), in which participants consumed the full MFM at baseline and 3 h postmeal. Blood samples were collected via an indwelling catheter at baseline and hourly for 6 h.
Results: Peak blood TGs were significantly greater (P = 0.003) after the HFM (285.2 ± 169.7 mg/dL) than after the MFM (156.0 ± 98.7 mg/dL), but the BPM (198.3 ± 182.8 mg/dL) was not significantly different from the HFM (P = 0.06) or the MFM (P = 0.99). Total area under the curve for TGs was greater after the HFM (1348.8 ± 783.7 mg/dL × 6 h) than after the MFM (765.8 ± 486.8 mg/dL × 6 h; P = 0.0005) and the BPM (951.8 ± 787.7 mg/dL × 6 h; P = 0.03), although the MFM and BPM were not significantly different (P = 0.72). There was a significant time-by-meal interaction for interferon γ, but not for interleukins 6, 8, or 10.
Conclusion: These findings in insufficiently active, healthy young men suggest that the large TG response after HFMs in previous studies may not reflect the metabolic state of many individuals in daily life.
Keywords: triglyceride, postmeal, metabolic load index, moderate-fat meal, cytokine, interleukin
Introduction
Cardiovascular disease (CVD) represents a serious risk and burden for many adults in Western society (1). Previous research has linked increased CVD risk to both low levels of physical activity (2) and poor dietary habits (3). Specifically, there is evidence implicating the consumption of single high-fat meals (HFMs) in elevating CVD risk. An exaggerated postprandial TG response, termed postprandial lipemia, has been linked to a high risk of CVD (4). Mechanisms connecting HFM consumption to CVD risk are numerous and include subendothelial penetration of lipoproteins, increased oxidative stress, and impaired endothelial function (5). In particular, there is evidence that inflammation may increase acutely after an HFM, suggesting the potential activation of an inflammatory cascade after the intake of only one meal (6). Because inflammation is an important hallmark of CVD (7), it provides a potentially important connection between HFM intake and CVD risk.
However, there are several important methodologic considerations when interpreting the results of previous postprandial studies. First, many studies used test meals that were quite large, calorie-dense, and rich in fat (e.g., ∼1300 kcal and 60% fat) (8–15). In addition, the standard practice in postprandial studies is to have participants arrive at the laboratory fasted, consume the large meal, and then not eat again for 6–8 h while their postmeal response is monitored. These design features are understandable from a scientific standpoint but do not necessarily lend themselves well to understanding the actual postmeal challenges that many individuals face on a daily basis, because they do not represent typical eating patterns (16). More research into the postprandial response under true-to-life scenarios is warranted.
The purpose of this study was to compare metabolic and inflammatory responses to 3 different meal conditions in order to better understand the metabolic and inflammatory challenges faced by the body on a daily basis. We used an HFM, representative of meals used in previous postprandial studies, as well as a moderate-fat meal (MFM), and a third condition in which participants consumed the full MFM twice, 3 h apart [biphasic meal (BPM)]. We hypothesized that 1) the HFM would elicit a significantly greater TG response than the MFM and BPM and 2) there would be a greater inflammatory response after the HFM than after the other 2 meals.
Methods
Participants
Nine young men (aged 18–35 y) were recruited to participate in the present study. Participants were not regularly engaging in exercise (<30 min/wk) and were not meeting physical activity guidelines [<150 min moderate- to vigorous-intensity physical activity/wk (17)], according to self-report via the International Physical Activity Questionnaire. Participants were free of any ongoing chronic disease, as confirmed via medical history questionnaire. This study was approved by the Institutional Review Board at Kansas State University.
Overall study design
The present study used a randomized crossover design. Participants reported to the laboratory on 4 separate occasions. The first session consisted of an initial assessment, in which participants completed paperwork and anthropometric tests were conducted. Participants completed an informed consent, medical history questionnaire, and the physical activity questionnaire. Blood pressure was assessed at rest by using an automated blood pressure cuff (Omron International). Height was measured by using a portable stadiometer (Invictus Plastics), and weight was assessed via digital scale (Pelsar LLC). Body composition was then measured via DXA scan (GE Lunar Prodigy). For the 3 main assessments, participants consumed 1 of 3 test meals in randomized order: a standard HFM, an MFM, and a BPM, in which they consumed the MFM twice, separated by a period of 3 h. Blood draws were made at baseline and serially (each hour) for 6 h to assess the postprandial metabolic and inflammatory responses. Each meal trial was separated by ≥1 wk and ≤3 wk. A washout period of ≥1 wk was chosen to eliminate the possibility of a carry-over effect. Because previous studies suggest that postprandial TGs will return to baseline concentrations within 8–10 h post-HFM (18, 19), our 7-d washout period ensures the observance of independent meal effects.
Test meals
Three test meals were used in the present study: 1) an HFM [17 kcal/kg body mass; 64% fat (21% saturated fat), 16% carbohydrate, 20% protein; 3 g fiber/serving; energy density: 2.0 kcal/g], which consisted of potatoes, eggs, sausage, and cheddar cheese; 2) an MFM [8.5 kcal/kg body mass; 30% fat (13% saturated fat), 55% carbohydrate, 15% protein; 2 g fiber/serving; energy density: 2.1 kcal/g], which comprised sausage, egg, cheese, and whole-grain crust; and 3) a BPM in which the full MFM was consumed twice, 3 h apart. The HFM trial was designed to be representative of typical meals used in previous postprandial lipemia studies (8–15). The MFM was designed to be half the kilocalories of the HFM while presenting primarily the same contents (i.e., sausage, egg, cheese). In the BPM trial, we wanted to assess the potential compounding effects of smaller, more moderate meals, because it is reasonable for a person to eat twice in a 6-h period. In total, the BPM was equal in kilocalories to the HFM. When accounting for participant body mass, the HFM contained 1319 ± 338 kcal and the MFM contained 660 ± 169 kcal.
Meal test protocol
Before the first meal trial (HFM, MFM, or BPM), which was determined via random assignment for each participant, the participants were instructed to record their dietary habits for 3 full days. For the remaining 2 trials, participants were given a photocopy of their diet record from the first meal trial, which they were instructed to repeat. Participants were instructed to refrain from planned exercise for 2 full days before each meal trial. Participants also abstained from alcohol and caffeine for 12 h before each assessment. For each session, participants were given a hard-copy reminder sheet of these instructions, and no participants reported an impactful deviation from these instructions at any point throughout the study.
On each meal trial day, participants reported to the laboratory after a 10-h overnight fast. An indwelling safelet catheter was inserted into a forearm vein via a 24-gauge needle (Exelint International). The intravenous catheter was kept patent with a steady infusion of 0.9% NaCl solution (∼1 drip/s) and fixed in place via placement of Tegaderm film (3M Healthcare). When the intravenous catheter was in place, a baseline blood draw was performed. For each blood draw, a 3-mL syringe (BD) was used to clear the line of saline, after which a 5-mL syringe (BD) was used for the actual blood sample. Blood draws were used to assess whole-blood TGs, glucose, total cholesterol (TC), HDL cholesterol, LDL cholesterol, and markers of inflammation (see “Analytical procedures”). After the baseline/fasting blood draw, participants consumed the respective meal in ≤20 min. Water was available to participants ad libitum with each meal and throughout the postmeal period. Participants remained in the laboratory for 6 h after the completion of each meal, with timing started after the last bite of the meal. Blood draws were performed hourly for 6 h after the meal. Metabolic markers were assessed every hour, whereas inflammatory markers were assessed at baseline and 3 and 6 h postmeal. Markers of inflammation were assessed less frequently than metabolic markers primarily due to funding limitations. Inflammatory assessments were evenly spaced (baseline and 3 and 6 h postmeal) to best characterize the postprandial inflammatory response given the available resources.
Analytical procedures
Whole-blood metabolic measures (TGs, glucose, TC, HDL cholesterol, and LDL cholesterol) were determined via Cholestech LDX analyzer (Alere Cholestech). For each sample, several drops of whole blood were drawn into a capillary tube and plunged into a Cholestech LDX Lipid+Glu cassette (Alere Cholestech). The cassette was then inserted into the Cholestech LDX analyzer for processing. The remaining blood sample was then centrifuged at 1800 × g at room temperature for 12 min, and the plasma was pipetted into 0.6-mL snap-cap containers (Fisher). Plasma was stored at −60°C until study completion. At the conclusion of the study data collection, plasma samples were analyzed in duplicate via custom high-sensitivity T cell bead-based 4-plex assay (Eve Technologies). The multiplex assay was conducted at Eve Technologies via the Bio-Plex 200 system (Bio-Rad Laboratories, Inc.) and a Milliplex high-sensitivity custom human cytokine kit (Millipore) according to protocol specifications. The 4 markers of inflammation assessed in the present study were IL-6, IL-8, IL-10, and IFN-γ. CVs were <10% for all inflammatory marker analyses.
Statistical analyses
An a priori sample size calculation (α = 0.05, power = 0.80) determined that 6 participants would be needed to detect differences between meals in the postprandial TG total AUC (tAUC) response. However, 9 participants were recruited to increase power to detect differences in other outcomes, such as markers of inflammation (although an a priori sample size calculation was not conducted for inflammatory markers). tAUC, incremental AUC (iAUC), peak value, and time-to-peak value were determined for each of the metabolic and inflammatory markers in each meal trial. The data were checked for normality by using the Shapiro-Wilk formal normality test. If the data were normal, a 1-factor ANOVA was conducted to test for differences between meals. If the data were nonnormal, a nonparametric Friedman test was used to test for meal differences. Time-course changes in metabolic and inflammatory markers in response to each meal were determined via 2-factor (meal × time) repeated-measures ANOVA with Tukey's adjustment for post hoc pairwise comparisons. A type 1 error rate of 0.05 was allowed for all analyses in determining significant differences.
Results
Participant characteristics are presented in Table 1. Three participants had a systolic blood pressure >120 mm Hg. No participants were found to have a high diastolic blood pressure. With regard to BMI, 5 participants were normal weight (in kg/m2; 18.5–24.9), 2 were overweight (25.0–29.9), and 2 were obese (≥30) (20). Two participants presented with fasting TGs >150 mg/dL. All fasting glucose values were <110 mg/dL. No participants were found to have high fasting TC (>200 mg/dL). There were no differences between meals with regard to fasting metabolic markers (all P > 0.05).
TABLE 1.
Participant characteristics1
| Mean ± SD | |
|---|---|
| Age, y | 25.1 ± 6.8 |
| Height, cm | 173.5 ± 6.1 |
| Mass, kg | 77.6 ± 19.9 |
| BMI, kg/m2 | 25.8 ± 7.0 |
| Body fat, % | 20.5 ± 11.9 |
| Trunk fat, % | 26.5 ± 14.0 |
| Fasting TGs, mg/dL | 109.9 ± 65.0 |
| Fasting glucose, mg/dL | 88.0 ± 8.0 |
| Fasting total cholesterol, mg/dL | 146.0 ± 20.8 |
| Fasting LDL cholesterol, mg/dL | 90.5 ± 20.3 |
| Fasting HDL cholesterol, mg/dL | 35.7 ± 7.3 |
n = 9.
Postprandial metabolic data are presented in Table 2 and Figure 1. There were significant meal effects with regard to TG peak, time to peak, tAUC, and iAUC. A significantly higher TG peak was observed in after HFM than after the MFM (P = 0.003), but there were no differences between the BPM and the HFM (P = 0.06) or MFM (P = 0.99). The time-to-peak TG response was significantly longer in the HFM (P = 0.01) and BPM (P = 0.01) trials than in the MFM trial, with no difference (P = 0.29) between the HFM and BPM. The tAUC response for TGs was significantly larger in the HFM trial than in the BPM (P = 0.03) and MFM (P = 0.0005) trials, but there was no difference between the BPM and MFM trials (P = 0.72). Similarly, iAUC was greater in the HFM trial than in the BPM (P = 0.01) and MFM (P = 0.001) trials, whereas there was no difference between the BPM and the MFM trials (P = 0.99).
TABLE 2.
Postprandial metabolic data for the 3 meal trials (HFM, MFM, and BPM) in insufficiently active, healthy young men1
| HFM | MFM | BPM | P | |
|---|---|---|---|---|
| TGs | ||||
| Peak, mg/dL | 214.0 (154.5–415.5)a | 113.0 (85.0–221.0)b | 129.0 (103.5–228.5)a,b | 0.0013 |
| Time to peak, h | 3.8 ± 1.3a | 2.4 ± 1.4b | 4.4 ± 1.0a | 0.0017 |
| tAUC, mg/dL × 6 h | 1087.0 (769.5–1957.5)a | 546.0 (411.3–1150.3)b | 645.0 (514.0–1213.3)b | <0.0001 |
| iAUC, mg/dL × 6 h | 439.0 (360.8–939.0)a | 167.0 (66.1–313.8)b | 153.0 (111.7–381.5)b | 0.0002 |
| Glucose | ||||
| Peak, mg/dL | 98.0 (94.5–105.0) | 102.0 (93.0–136.5) | 110.0 (91.5–120.0) | 0.99 |
| Time to peak, h | 1.0 (0.5–3.5) | 1.0 (1.0–2.0) | 1.0 (1.0–5.0) | 0.30 |
| tAUC, mg/dL × 6 h | 531.2 ± 51.3 | 528.2 ± 55.8 | 543.0 ± 72.3 | 0.72 |
| iAUC, mg/dL × 6 h | −4.0 ± 44.2 | 12.2 ± 70.5 | 12.2 ± 60.1 | 0.70 |
| Metabolic load index | ||||
| Peak, mg/dL | 306.0 (240.5–510.5)a | 223.0 (188.5–314.5)b | 214.0 (194.0–331.5)b | 0.0030 |
| Time to peak, h | 3.4 ± 1.1a,b | 2.2 ± 1.6a | 4.3 ± 1.6b | 0.01 |
| tAUC, mg/dL × 6 h | 1607.0 (1299.0–2558.0)a | 1046.0 (919.8–1714.5)b | 1130.0 (1028.3–1798.0)a,b | 0.0013 |
| iAUC, mg/dL × 6 h | 648.7 ± 394.5a | 257.2 ± 198.2b | 316.4 ± 327.0b | 0.001 |
| Total cholesterol | ||||
| Peak, mg/dL | 152.1 ± 21.8 | 165.3 ± 20.0 | 148.9 ± 22.4 | 0.07 |
| Time to peak, h | 2.9 ± 2.1 | 4.1 ± 2.2 | 1.6 ± 1.8 | 0.06 |
| tAUC, mg/dL × 6 h | 856.2 ± 125.6 | 914.7 ± 99.4 | 822.6 ± 121.4 | 0.08 |
| iAUC, mg/dL × 6 h | −3.0 (−25.6–34.4) | −38.0 (−69.0–27.7) | −53.1 (−100.8–31.3) | 0.40 |
| LDL cholesterol | ||||
| Peak, mg/dL | 86.3 ± 21.4a | 104.0 ± 19.9b | 85.1 ± 23.9a | 0.0004 |
| Time to peak, h | 0.0 (0.0–1.0) | 3.0 (0.0–5.5) | 1.0 (0.0–2.0) | 0.19 |
| tAUC, mg/dL × 6 h | 360.8 ± 198.2a | 539.8 ± 130.5b | 396.1 ± 162.0a | 0.0013 |
| iAUC, mg/dL × 6 h | −68.3 ± 41.7 | −28.2 ± 92.9 | −47.4 ± 45.0 | 0.39 |
| HDL cholesterol | ||||
| Peak, mg/dL | 36.8 ± 8.5 | 43.3 ± 6.3 | 37.3 ± 7.6 | 0.02 |
| Time to peak, h | 1.0 (0.0–3.0) | 5.0 (0.0–6.0) | 0.0 (0.0–1.5) | 0.12 |
| tAUC, mg/dL × 6 h | 191.7 ± 53.4a | 224.8 ± 44.1b | 194.3 ± 53.4a | 0.03 |
| iAUC, mg/dL × 6 h | −15.7 ± 18.6 | −0.4 ± 25.4 | −10.8 ± 20.8 | 0.35 |
Normally distributed values are means ± SDs, and non–normally distributed values are medians (IQRs); n = 9. All metabolic markers were measured in whole blood. P values represent main effects between meals. Labeled means in a row without a common superscript letter differ, P < 0.05. See the Results section for pairwise comparison P values. BPM, biphasic meal; HFM, high-fat meal; iAUC, incremental AUC; MFM, moderate-fat meal; tAUC, total AUC.
FIGURE 1.
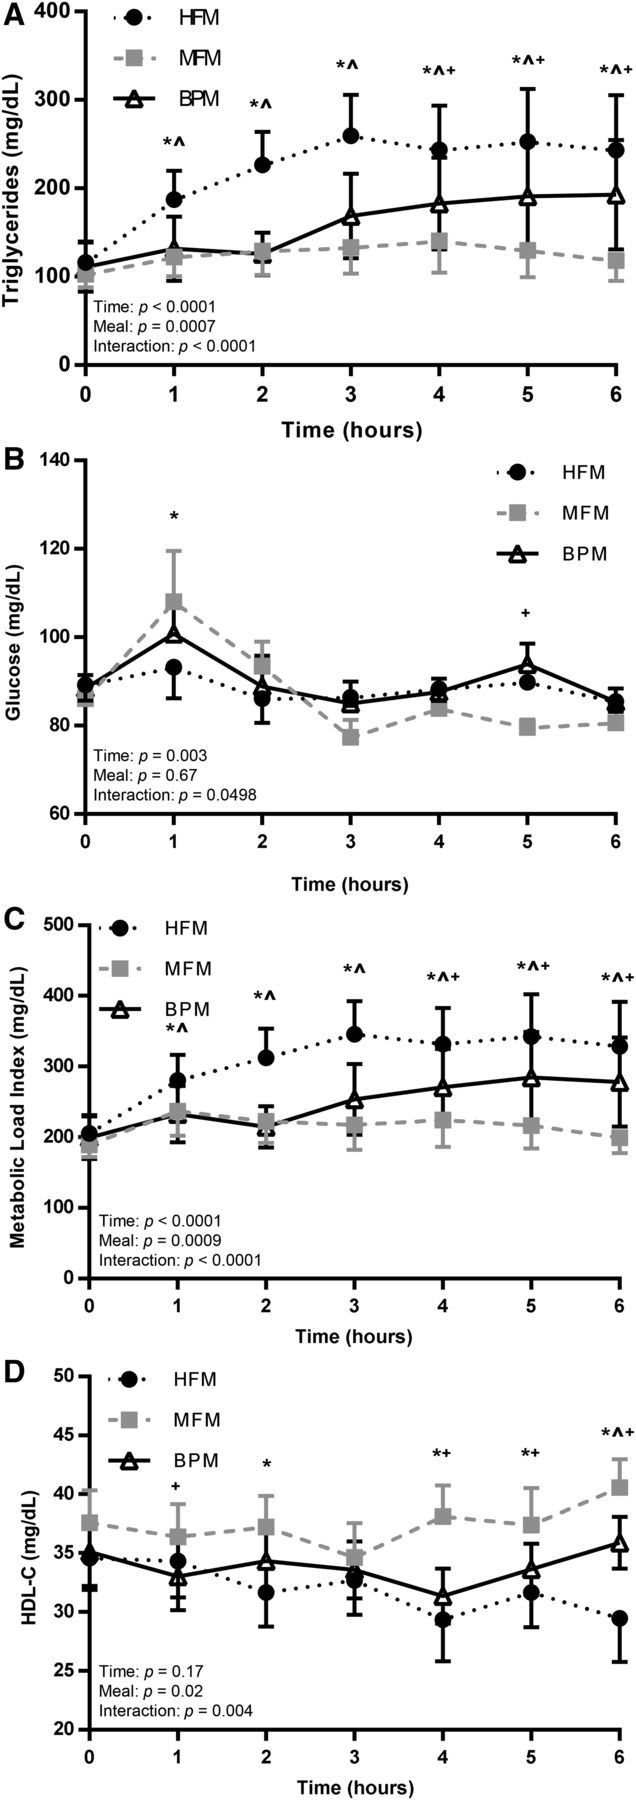
Postprandial metabolic responses after the 3 meal trials (HFM, MFM, and BPM) in insufficiently active, healthy young men. Metabolic markers in whole blood, including TGs (A), glucose (B), metabolic load index (C), and HDL-C (D) were assessed at baseline (time 0) and serially for 6 h after each meal trial (HFM, MFM, and BPM). Values are means ± SEMs, n = 9. *HFM compared with MFM; ^HFM compared with BPM; +MFM compared with BPM. BPM, biphasic meal; HDL-C, HDL cholesterol; HFM, high-fat meal; MFM, moderate-fat meal.
There were no significant meal effects with regard to glucose (Table 2). Time-course responses for glucose are shown in Figure 1B. Overall, there were no substantial differences between the 3 meal trials in terms of the glucose response.
Metabolic load index (MLI) is determined by adding circulating glucose and TGs in order to better characterize the metabolic challenge faced by the body, instead of looking at glucose and TGs separately (5). There was a significant meal effect for MLI across trials in terms of peak, time to peak, tAUC, and iAUC (Table 2). Within pairwise comparisons, the HFM elicited a greater peak than did the MFM (P = 0.007) and BPM (P = 0.03) trials, with no difference between the MFM and BPM (P = 0.99). The time-to-peak MLI response was significantly longer in the BPM condition than in the MFM condition (P = 0.048), but the HFM was not significantly different from the MFM (P = 0.06) or BPM (P = 0.09). With regard to tAUC, the HFM elicited a greater MLI response than did the MFM (P = 0.003), but not the BPM (P = 0.06); no difference was detected in tAUC in the MFM compared with the BPM (P = 0.99). The HFM produced a greater iAUC MLI response than the MFM (P = 0.003) and BPM (P = 0.02), and there was no difference between the MFM and BPM (P = 0.52). Figure 1C shows time-course changes for the MLI in the postprandial period in response to the 3 meals.
There were no significant meal effects with regard to TC. However, significant meal effects were determined for LDL-cholesterol peak and tAUC responses. The peak LDL-cholesterol response was significantly greater in the MFM condition than in the HFM (P = 0.007) and BPM (P = 0.007) conditions, although there was no difference between the HFM and BPM (P = 0.77). With regard to tAUC, the LDL-cholesterol response was significantly larger in the MFM trial than in the HFM (P = 0.0009) and BPM (P = 0.004) trials, with no difference between the HFM and BPM conditions (P = 0.46). A significant meal effect was detected with regard to the HDL-cholesterol tAUC response. The MFM elicited a significantly greater HDL-cholesterol tAUC response than did the HFM (P = 0.02) and the BPM (P = 0.047), but there was no difference between the HFM and BPM (P = 0.86). The postprandial time course for responses generally showed a steady increase in HDL cholesterol after the MFM, whereas HDL cholesterol tended to decrease after the HFM (Figure 1D).
Figure 2 and Table 3 shows fasting and postprandial values for 4 markers of inflammation assessed at baseline and at 3 and 6 h postmeal: IL-6, IL-8, IL-10, and IFN-γ. A significant meal effect was detected for IFN-γ iAUC. However, within this meal effect, there were no significant post hoc pairwise comparisons. No other meal effects were detected for other inflammatory markers with regard to fasting, peak, time-to-peak, tAUC, or iAUC values. There was no significant time × treatment interaction for IL-6 (P = 0.19), IL-8 (P = 0.06), or IL-10 (P = 0.16). However, there was a significant time × treatment interaction for IFN-γ (P = 0.01). In post hoc pairwise comparisons, IFN-γ was significantly higher (P = 0.02) in the BPM trial than in the HFM trial 3 h postmeal.
FIGURE 2.
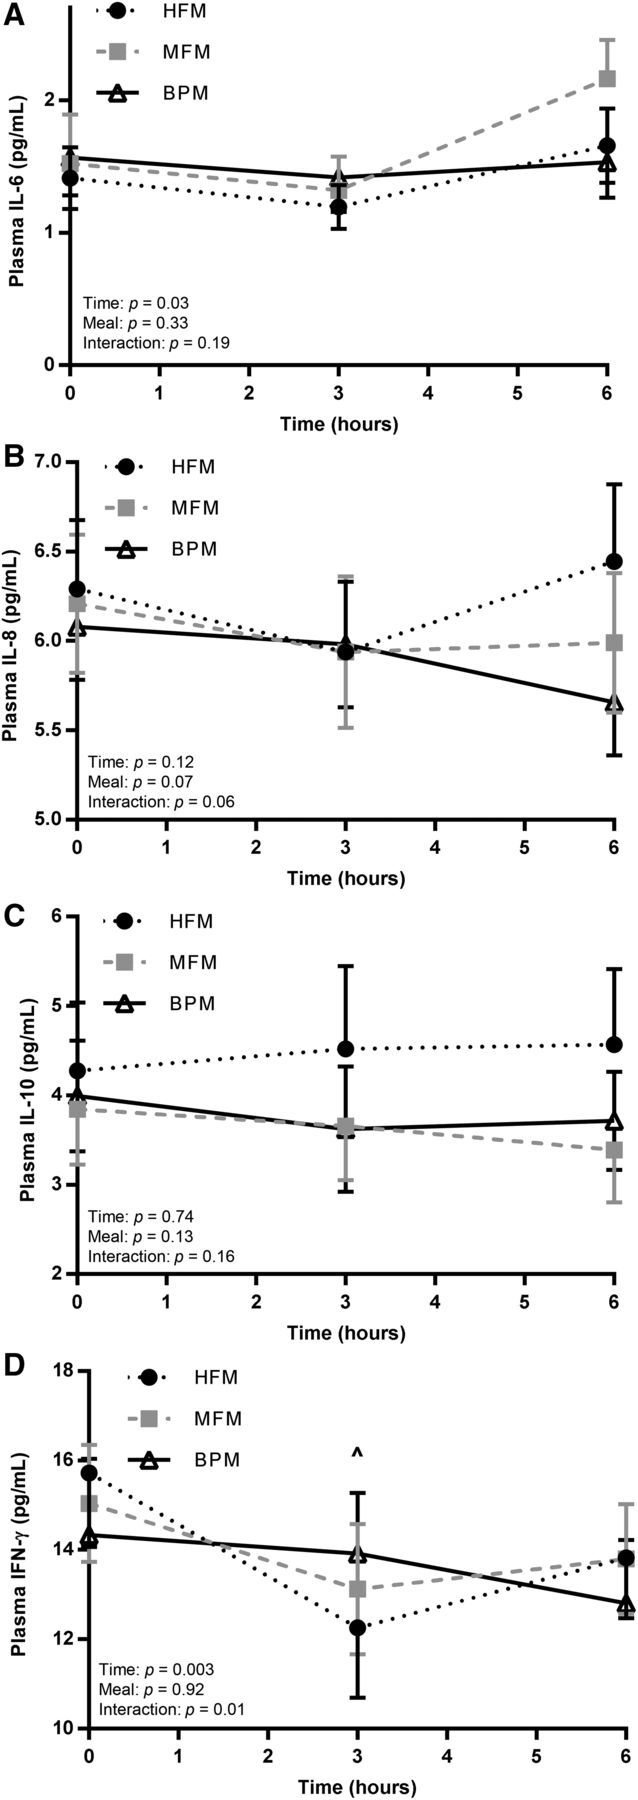
Postprandial inflammatory responses after the 3 meal trials (HFM, MFM, and BPM) in insufficiently active, healthy young men. Plasma inflammatory markers, including IL-6 (A), IL-8 (B), IL-10 (C), and IFN-γ (D) were assessed at baseline (time 0) and 3 and 6 h after each meal trial (HFM, MFM, and BPM). Values are means ± SEMs, n = 9. ^HFM compared with BPM. BPM, biphasic meal; HFM, high-fat meal; MFM, moderate-fat meal.
TABLE 3.
Postprandial inflammatory data for the 3 meal trials (HFM, MFM, and BPM) in insufficiently active, healthy young men1
| HFM | MFM | BPM | P | |
|---|---|---|---|---|
| IL-6 | ||||
| Fasting, pg/mL | 1.41 ± 0.65 | 1.64 ± 1.13 | 1.66 ± 0.86 | 0.53 |
| Peak, pg/mL | 1.75 ± 0.75 | 2.18 ± 1.04 | 1.83 ± 0.82 | 0.26 |
| Time to peak, h | 6.0 (1.5–6.0) | 6.0 (1.5–6.0) | 1.5 (0.0–5.3) | 0.12 |
| tAUC, pg/mL × 6 h | 3.08 ± 1.09 | 3.98 ± 2.47 | 3.78 ± 2.00 | 0.79 |
| iAUC, pg/mL × 6 h | −0.10 (−0.48 to 0.63) | −0.10 (−0.75 to 0.45) | −0.18 (−0.41 to 0.10) | 0.97 |
| IL-8 | ||||
| Fasting, pg/mL | 6.29 ± 1.09 | 6.38 ± 1.12 | 6.13 ± 0.93 | 0.13 |
| Peak, pg/mL | 6.73 ± 1.04 | 6.43 ± 1.12 | 6.33 ± 1.02 | 0.12 |
| Time to peak, h | 2.6 ± 3.0 | 0.8 ± 1.4 | 2.6 ± 2.5 | 0.18 |
| tAUC, pg/mL × 6 h | 12.31 ± 2.14 | 12.20 ± 2.47 | 11.96 ± 1.96 | 0.24 |
| iAUC, pg/mL × 6 h | −0.27 ± 0.79 | −0.56 ± 0.59 | −0.30 ± 0.63 | 0.47 |
| IL-10 | ||||
| Fasting, pg/mL | 4.28 ± 2.16 | 4.01 ± 1.91 | 4.27 ± 1.79 | 0.42 |
| Peak, pg/mL | 4.87 ± 2.54 | 4.20 ± 1.83 | 4.42 ± 1.85 | 0.18 |
| Time to peak, h | 4.5 (0.8–6.0) | 0.0 (0.0–3.0) | 1.5 (0.0–5.3) | 0.27 |
| tAUC, pg/mL × 6 h | 26.48 ± 14.70 | 22.98 ± 10.48 | 23.86 ± 10.93 | 0.18 |
| iAUC, pg/mL × 6 h | 1.17 ± 3.28 | −0.73 ± 2.01 | −1.37 ± 2.32 | 0.12 |
| IFN-γ | ||||
| Fasting, pg/mL | 15.73 ± 4.71 | 14.75 ± 4.11 | 14.59 ± 5.42 | 0.26 |
| Peak, pg/mL | 15.75 ± 4.64 | 15.32 ± 4.05 | 15.07 ± 4.91 | 0.45 |
| Time to peak, h | 0.0 (0.0–0.0) | 0.0 (0.0–3.0) | 1.5 (0.0–3.0) | 0.56 |
| tAUC, pg/mL × 6 h | >81.08 ± 25.62 | >83.64 ± 24.49 | >84.04 ± 27.33 | har=".">0.56 |
| iAUC, pg/mL × 6 h | −13.28 ± 5.99 | −4.88 ± 8.66 | −3.50 ± 7.74 | 0.046 |
Normally distributed values are means ± SDs, and non–normally distributed values are medians (IQRs); n = 9. All inflammatory markers were measured in plasma. P values represent main effects between meals. BPM, biphasic meal; HFM, high-fat meal; iAUC, incremental area under the curve; MFM, moderate-fat meal; tAUC, total AUC.
Discussion
Main findings
The purpose of the present study was to compare metabolic and inflammatory responses to 3 different meal conditions, with the intention of better assessing the metabolic and inflammatory challenges faced by the body under real-life circumstances. The main finding of the present study was that, overall, the HFM elicited a substantially greater TG response than the other 2 meal trials. This finding suggests that the single large bolus of fatty food, representative of meals used in previous postprandial studies, may induce a very different TG response than more reasonable meals (i.e., fewer kilocalories, less fat, divided into smaller meals over time) consumed in daily living. We also hypothesized that the HFM would elicit a greater inflammatory response than the MFM and BPM. However, this prediction was only partially supported. With the exception of a significant time × meal interaction for IFN-γ, there were no real appreciable differences between meal trials with regard to markers of inflammation.
Postprandial TG response
We found that, relative to the standard HFM, a meal more moderate in terms of kilocalories and percentage fat (i.e., the MFM) induced a blunted postprandial TG response. However, it should be noted that the MFM contained 660 ± 169 kcal, which is a relatively substantial meal. The MFM also contained generally the same ingredients (sausage, egg, cheese) as the HFM. Thus, the MFM, which is arguably representative of a reasonable meal consumed in daily living, induced a blunted change in TGs over the 6-h time course, whereas the HFM produced a large, sustained TG response. It has been reported that elevated postprandial TGs can independently increase myocardial infarction risk by 40% per 100-mg/dL increase in TGs (21, 22). Because, on average, the HFM elicited a peak TG response >100 mg/dL greater than the MFM, it is likely that the differences seen between meals with regard to postprandial lipemia have clinical significance.
For the first 3 h postmeal, the TG responses of the BPM mimicked the MFM; however, after the consumption of the second meal at hour 3, a compounding effect was observed, and the TG values for the BPM were significantly greater than the MFM at 4, 5, and 6 h postmeal. These findings support the notion that postprandial lipemic responses can be summative, affected by both the lingering TG concentrations of previous meals and the TG flux of a more recent meal. This conclusion is important to consider, because many postprandial studies only feature 1 meal followed by a prolonged period of assessment in which no additional snacks or meals are consumed. Thus, future research should further assess multiple meals in attempting to characterize the TG flux under normal dietary consumption and timing.
To our knowledge, only one previous study has investigated postprandial lipemia in the context of multiple sequential meals. Pfeiffer et al. (23) assessed postprandial lipemia in response to 2 meals that each provided approximately one-third of each participant's daily energy needs and contained 33% fat. However, the purpose of the study was to determine the minimum amount of walking required to blunt postprandial lipemia to the sequential meals. Thus, no comparison was made between the moderate, sequential meals with a standard HFM, as was done in the present study. Our results support the concept of summative TG responses to sequential meals, but we also found that the HFM elicited a significantly greater postprandial lipemia AUC response than did the BPM, even though the BPM contained the same amount of kilocalories. This finding could point to one or several considerations: 1) the 6-h postprandial duration may not have been sufficient to witness the entire BPM lipemic response, 2) the HFM may overwhelm the metabolic-clearing capacity of the body to a greater degree than the BPM, and 3) the difference between the HFM and BPM may simply be due to the different proportional fat contents. More research is needed to elucidate the potential response differences between 2 small meals and 1 very large meal.
Postprandial HDL-cholesterol response
An important finding in the present study was the divergent postprandial responses with regard to HDL cholesterol. There were no differences in HDL cholesterol between meals at baseline, but over the course of the 6-h postmeal period, HDL cholesterol tended to decrease in the HFM trial but remain steady in the MFM trial. There were also main meal effects with regard to HDL-cholesterol peak and tAUC. Clearly, these different meal trials produced different effects on HDL cholesterol. Previous evidence has shown that the response of HDL cholesterol is inversely related to the magnitude of postprandial lipemia (13), and it has been speculated that the lowering of HDL cholesterol in response to HFM consumption can be an avenue by which HFMs induce deleterious cardiovascular effects (24).
Markers of inflammation
To our knowledge, the present study is the first to investigate inflammatory responses to an HFM compared with more moderate meals, including sequential moderate meals. Investigating the inflammatory responses to these moderate meals is important, because inflammation has been mechanistically linked to the development and progression of CVD. In our cohort of young, insufficiently active men, with the exception of IFN-γ iAUC, there were no main postprandial effects seen across meals among the markers of inflammation. Furthermore, only IFN-γ exhibited a significant time × meal interaction in the postprandial period.
IFN-γ is an important cytokine released from activated macrophages and is an influential player in the inflammatory cascade that promotes atherosclerosis (25). IFN-γ has been minimally assessed in the postmeal period but was shown to increase in one study that used a very large HFM (26). In our study, which used meals of varying fat and energy content, despite a significant time × meal interaction, there were no clear and consistent postprandial differences between the 3 meal trials, although IFN-γ was significantly greater in the BPM than HFM 3 h postmeal.
IL-6 is an intriguing inflammatory marker, because it is both a cytokine and a myokine, and there is ongoing debate as to whether it is pro- or anti-inflammatory in nature. Across studies, there is fairly consistent evidence that IL-6 increases in response to HFM intake (27, 28). Whether this increase in IL-6 is beneficial or deleterious remains to be determined. Interestingly, there was no significant meal × time interaction for IL-6 in the postprandial period. The reason for the lack of change in IL-6 in the present study, particularly after the HFM, is unclear.
Strengths and experimental considerations
In our view, this study has several points of strength. First, this investigation was designed to be true to life and provide valuable data with regard to the postprandial metabolic and inflammatory challenges experienced by individuals on a daily basis. The HFM was very large, energy-dense, and rich in fat, similar to previous studies (8–15), whereas the BPM and MFM were moderate and reflective of more typical dietary behavior (16). Thus, the results of the present study are likely to reflect the postprandial circumstances for many individuals in daily life. Next, this study used a randomized crossover design, eliminating the possibility of systematic participant differences confounding the effects detected from the 3 meal trials. Last, within our cohort, variability existed with regard to body composition, fasting metabolic concentrations, and age. Nevertheless, we detected visible differences between the meals, thus increasing the generalizability of the present study.
However, several experimental considerations need to be made when interpreting our findings. Our findings cannot necessarily be extrapolated to women, older adults, physically active individuals, and diseased populations, because each of these groups has been shown to display different postprandial lipemic responses relative to young healthy men. In addition, it would have been potentially useful to have included a fourth trial in which the HFM was divided and delivered biphasically, similar to the BPM. From a study design perspective, that point is logical. However, the present study was intentionally designed to compare an HFM representative of those used in the literature with 2 other meal trials that were more realistic in nature with regard to size and timing. Delivering the HFM biphasically would have nonetheless resulted in participants consuming 2 meals that contained >60% fat, and would therefore shed light on whether TG differences between meal conditions in the present study were simply due to differences in fat content. Next, although participants were continually reminded of the necessary lifestyle controls leading up to each meal trial (avoidance of exercise and caffeine, replication of diet), adherence to these instructions was not formally documented, which represents a potential limitation of the present study. Finally, due to cost, markers of inflammation were assessed 3 and 6 h postmeal, as opposed to hourly in the case of metabolic markers. Consequently, our data are not equipped to characterize the postprandial response curve of these inflammatory markers with high precision.
Conclusions
The purpose of this investigation was to compare metabolic and inflammatory responses to 3 meal conditions in order to better define and understand the metabolic and inflammatory challenges that individuals experience in daily life. The main finding was that the HFM induced a considerably greater TG response than did the other realistic meal protocols, signifying that a single large intake of energy-dense, high-fat food, representative of meals used in previous postprandial studies, may result in a markedly different lipemic response than smaller, moderate-fat meals consumed in daily living. However, we found few clear and noteworthy differences between meal trials with regard to markers of inflammation. We encourage future research to assess the true-to-life postprandial metabolic and inflammatory responses in other relevant populations who are much less represented in the current literature, such as women, older adults, and diseased populations. In doing so, we can gain a better understanding of the metabolic and inflammatory challenges faced by individuals on a daily basis.
Acknowledgments
The authors' responsibilities were as follows—SRE: designed and conducted the research, analyzed data, and wrote the manuscript; SPK, CST, EME, BJC, and SKR: conducted the research and edited the final manuscript; MDH: helped design the research and read the manuscript; SKR: designed the research, provided essential materials, and had primary responsibility for final content; and all authors: read and approved the final manuscript.
Abbreviations
- BPM
biphasic meal
- CVD
cardiovascular disease
- HFM
high-fat meal
- iAUC
incremental area-under-the-curve
- MFM
moderate-fat meal
- MLI
metabolic load index
- tAUC
total AUC
- TC
total cholesterol
References
- 1. Heron M.. Deaths: leading causes for 2010. Natl Vital Stat Rep 2013;62:1–96. [PubMed] [Google Scholar]
- 2. Williams PT.. Physical fitness and activity as separate heart disease risk factors: a meta-analysis. Med Sci Sports Exerc 2001;33:754–61. [DOI] [PMC free article] [PubMed] [Google Scholar]
- 3. Hu FB, Rimm EB, Stampfer MJ, Ascherio A, Spiegelman D, Willett WC.. Prospective study of major dietary patterns and risk of coronary heart disease in men. Am J Clin Nutr 2000;72:912–21. [DOI] [PubMed] [Google Scholar]
- 4. Patsch JR, Miesenbock G, Hopferwieser T, Muhlberger V, Knapp E, Dunn JK, Gotto AM Jr, Patsch W.. Relation of triglyceride metabolism and coronary artery disease: studies in the postprandial state. Arterioscler Thromb 1992;12:1336–45. [DOI] [PubMed] [Google Scholar]
- 5. Emerson SR, Haub MD, Teeman CS, Kurti SP, Rosenkranz SK.. Summation of blood glucose and TAG to characterise the ‘metabolic load index’. Br J Nutr 2016;116:1553–63. [DOI] [PubMed] [Google Scholar]
- 6. Burdge GC, Calder PC.. Plasma cytokine response during the postprandial period: a potential causal process in vascular disease? Br J Nutr 2005;93:3–9. [DOI] [PubMed] [Google Scholar]
- 7. Hansson GK.. Inflammation, atherosclerosis, and coronary artery disease. N Engl J Med 2005;352:1685–95. [DOI] [PubMed] [Google Scholar]
- 8. Peddie MC, Rehrer NJ, Perry TL.. Physical activity and postprandial lipidemia: are energy expenditure and lipoprotein lipase activity the real modulators of the positive effect? Prog Lipid Res 2012;51:11–22. [DOI] [PubMed] [Google Scholar]
- 9. Brandauer J, Landers-Ramos RQ, Jenkins NT, Spangenburg EE, Hagberg JM, Prior SJ.. Effects of prior acute exercise on circulating cytokine concentration responses to a high-fat meal. Physiol Rep 2013;1:e00040. [DOI] [PMC free article] [PubMed] [Google Scholar]
- 10. Gill JM, Al-Mamari A, Ferrell WR, Cleland SJ, Packard CJ, Sattar N, Petrie JR, Caslake MJ.. Effects of prior moderate exercise on postprandial metabolism and vascular function in lean and centrally obese men. J Am Coll Cardiol 2004;44:2375–82. [DOI] [PubMed] [Google Scholar]
- 11. Harrison M, Murphy RP, O'Connor PL, O'Gorman DJ, McCaffrey N, Cummins PM, Moyna NM.. The endothelial microparticle response to a high fat meal is not attenuated by prior exercise. Eur J Appl Physiol 2009;106:555–62. [DOI] [PubMed] [Google Scholar]
- 12. Katsanos CS, Grandjean PW, Moffatt RJ.. Effects of low and moderate exercise intensity on postprandial lipemia and postheparin plasma lipoprotein lipase activity in physically active men. J Appl Physiol 2004;96:181–8. [DOI] [PubMed] [Google Scholar]
- 13. Patsch JR, Karlin JB, Scott LW, Smith LC, Gotto AM Jr.. Inverse relationship between blood levels of high density lipoprotein subfraction 2 and magnitude of postprandial lipemia. Proc Natl Acad Sci USA 1983;80:1449–53. [DOI] [PMC free article] [PubMed] [Google Scholar]
- 14. Peluso I, Raguzzini A, Villano DV, Cesqui E, Toti E, Catasta G, Serafini M.. High fat meal increase of IL-17 is prevented by ingestion of fruit juice drink in healthy overweight subjects. Curr Pharm Des 2012;18:85–90. [DOI] [PubMed] [Google Scholar]
- 15. Schwander F, Kopf-Bolanz KA, Buri C, Portmann R, Egger L, Chollet M, McTernan PG, Piya MK, Gijs MA, Vionnet N, et al. A dose-response strategy reveals differences between normal-weight and obese men in their metabolic and inflammatory responses to a high-fat meal. J Nutr 2014;144:1517–23. [DOI] [PMC free article] [PubMed] [Google Scholar]
- 16. Kerver JM, Yang EJ, Obayashi S, Bianchi L, Song WO.. Meal and snack patterns are associated with dietary intake of energy and nutrients in US adults. J Am Diet Assoc 2006;106:46–53. [DOI] [PubMed] [Google Scholar]
- 17. Garber CE, Blissmer B, Deschenes MR, Franklin BA, Lamonte MJ, Lee IM, Nieman DC, Swain DP American College of Sports Medicine.. Quantity and quality of exercise for developing and maintaining cardiorespiratory, musculoskeletal, and neuromotor fitness in apparently healthy adults: guidance for prescribing exercise. Med Sci Sports Exerc 2011;43:1334–59. [DOI] [PubMed] [Google Scholar]
- 18. Cohen JC, Noakes TD, Benade AJ.. Postprandial lipemia and chylomicron clearance in athletes and in sedentary men. Am J Clin Nutr 1989;49:443–7. [DOI] [PubMed] [Google Scholar]
- 19. Jeppesen J, Chen YD, Zhou MY, Wang T, Reaven GM.. Effect of variations in oral fat and carbohydrate load on postprandial lipemia. Am J Clin Nutr 1995;62:1201–5. [DOI] [PubMed] [Google Scholar]
- 20. WHO. Physical status: the use of and interpretation of anthropometry. Report of a WHO Expert Committee; Geneva (Switzerland): WHO; 1995. [PubMed] [Google Scholar]
- 21. O'Keefe JH, Bell DS.. Postprandial hyperglycemia/hyperlipidemia (postprandial dysmetabolism) is a cardiovascular risk factor. Am J Cardiol 2007;100:899–904. [DOI] [PubMed] [Google Scholar]
- 22. Gaziano JM, Hennekens CH, O'Donnell CJ, Breslow JL, Buring JE.. Fasting triglycerides, high-density lipoprotein, and risk of myocardial infarction. Circulation 1997;96:2520–5. [DOI] [PubMed] [Google Scholar]
- 23. Pfeiffer M, Ludwig T, Wenk C, Colombani PC.. The influence of walking performed immediately before meals with moderate fat content on postprandial lipemia. Lipids Health Dis 2005;4:24. [DOI] [PMC free article] [PubMed] [Google Scholar]
- 24. Zhang JQ, Thomas TR, Ball SD.. Effect of exercise timing on postprandial lipemia and HDL cholesterol subfractions. J Appl Physiol (1985);1998;85:1516–22. [DOI] [PubMed] [Google Scholar]
- 25. Shoelson SE, Lee J, Goldfine AB.. Inflammation and insulin resistance. J Clin Invest 2006;116:1793–801. [DOI] [PMC free article] [PubMed] [Google Scholar]
- 26. Gower RM, Wu H, Foster GA, Devaraj S, Jialal I, Ballantyne CM, Knowlton AA, Simon SI.. CD11c/CD18 expression is upregulated on blood monocytes during hypertriglyceridemia and enhances adhesion to vascular cell adhesion molecule-1. Arterioscler Thromb Vasc Biol 2011;31:160–6. [DOI] [PMC free article] [PubMed] [Google Scholar]
- 27. Herieka M, Erridge C.. High‐fat meal induced postprandial inflammation. Mol Nutr Food Res 2014;58:136–46. [DOI] [PubMed] [Google Scholar]
- 28. Emerson SR, Kurti SP, Harms CA, Haub MD, Melgarejo T, Logan C, Rosenkranz SK.. Magnitude and timing of the postprandial inflammatory response to a high-fat meal in healthy adults: a systematic review. Adv Nutr 2017;8:213–25. [DOI] [PMC free article] [PubMed] [Google Scholar]