Abstract
Many organizations are interested in biodiesel as a renewable, domestic energy source for use in transportation and heavy-duty equipment. Although numerous biodiesel emission studies exist, biodiesel exposure studies are nearly absent from the literature. This study compared the impact of petroleum diesel fuel and a B20 blend (20% soy-based biodiesel/80% petroleum diesel) on occupational and environmental exposures at a rural municipal facility in Keene, NH. For each fuel type, we measured concentrations of fine particulate matter (PM2.5), elemental carbon (EC), and organic carbon (OC) at multiple locations (in-cabin, work area, and near-field) at a materials recovery facility utilizing non-road equipment. B20 fuel use resulted in significant reductions in PM2.5 mass (56–76%), reductions in EC (5–29%), and increases in OC (294–467%). Concentrations of PM2.5 measured during petroleum diesel use were up to four times higher than PM2.5 concentrations during B20 use. Further analysis of the EC and OC fractions of total carbon also indicated substantial differences between fuels. Our results demonstrate that biodiesel blends significantly reduced PM2.5 exposure compared to petroleum diesel fuel in a workplace utilizing non-road construction-type equipment. While this suggests that biodiesel may reduce health risks associated with exposure to fine particulate matter mass, more exposure research is needed to better understand biodiesel-related changes in particulate matter composition and other exposure metrics.
Keywords: Biodiesel, Diesel, Occupational exposure, Environmental exposure, Particulate matter (PM), Elemental carbon, Organic carbon
Introduction
Substantial scientific evidence exists on the negative health effects of exposure to both whole diesel exhaust and individual components of diesel exhaust such as diesel particulate matter (Mauderly 2000; HEI Diesel Epidemiology Working Group 2002; U.S. EPA 2002a). Combustion of diesel fuel releases fine (≤2.5 μm) and ultrafine (≤0.1 μm) particles into the air, which can penetrate deep into the lung. Exposure to fine particulate air pollution is associated with a wide array of acute and chronic cardiopulmonary health endpoints including increased emergency room visits, reduced lung function, exacerbation of asthma, and increased mortality rates (Pope 2000; Lippmann et al. 2003; U.S. EPA 2004). A comprehensive review of epidemiological, in vivo, and in vitro research suggests that exposure to vehicular emissions may be a major environmental factor in cardiopulmonary mortality and morbidity in the USA (Grahame and Schlesinger 2010). Maynard et al. (2007) estimated that an interquartile range increase in the previous day’s predicted black carbon (BC) level (using BC as a surrogate for traffic-related particles) was associated with a 2.3% increase in all-cause mortality risk in the Boston metropolitan area.
Diesel engines are the source of more than 20% of directly emitted fine particles (≤2.5 μm) in New England, excluding fugitive dust from agriculture (U.S. EPA 2009). Diesel particles efficiently adsorb semi-volatile organic compounds, polycyclic aromatic hydrocarbons, and nitro-polycyclic aromatic hydrocarbons (HEI Diesel Epidemiology Working Group 2002), many of which are carcinogenic. US regulatory agencies have determined that petroleum diesel exhaust is a “potential occupational carcinogen” (NIOSH 1988) and “likely to be carcinogenic to humans by inhalation” (U.S. EPA 2002a). Exposure to diesel exhaust is also associated with a number of acute and chronic non-cancer health effects, ranging from nose and eye irritation, decreased lung function and increased cough to symptoms of bronchitis, chronic inflammation of lung tissue, and reduced resistance to infection (SCAQMD 2000; U.S. EPA 2002a).
While environmental policymakers have highlighted the association between diesel and lung disease risk at the lower exposure levels typically experienced by the public, occupational exposure to diesel exhaust may present an even greater risk. A detailed review of workplace exposure assessment data for various jobs such as mine workers, truck drivers, and forklift operators determined that occupational exposures to diesel particulate matter (DPM) are orders of magnitude higher than ambient exposures (Cantrell and Watts 1997), and a cohort study of railroad workers with occupational exposure to diesel exhaust indicated elevated lung cancer mortality (Garshick et al. 2004). A recent survey of particulate exposures in the US trucking industry found significant differences in exposure intensity of particulate matter≤2.5 μm (PM2.5), elemental carbon (EC), and organic carbon (OC) for work locations and jobs relative to background concentrations at trucking terminals (Smith et al. 2006).
A number of potential technological risk interventions—such as the use of diesel particle filters, improved engine technology, and ultra-low sulfur (ULSD) fuels—have been suggested to reduce the impact of diesel exhaust on human health. Post-2007 on-road diesel engines are engineered to yield cleaner emissions, and non-road engine technology improvements will be phased in by 2014 for new models (U.S. EPA 2004). However, with heavy-duty diesel (HDD) engine life expectancy commonly approaching 15–20 years, older diesel engine models will still be in use for many years. Sulfur content in ULSD used by on-road engines has been reduced to <15 ppmw. Diesel fuel used by non-road engines may contain up to 500 ppmw sulfur content, although ULSD fuel compliance is expected in 2010.
Another intervention that could address the risk posed by older HDD models is the substitution of biodiesel fuel for diesel in both on-road and non-road vehicles. Biodiesel consists of methyl esters of fatty acids, and B20 blends (20% biodiesel/80% petroleum diesel) can be used in most diesel engines without engine modifications. Biodiesel blends can be immediately substituted for petroleum diesel and carry a number of additional benefits. Produced domestically from waste grease or agricultural feedstocks, biodiesel is biodegradable, considerably less toxic to aquatic organisms in the event of spills than petroleum diesel (Khan et al. 2007), and is considered sustainable because it is generated from renewable resources. The Environmental Protection Agency’s (EPA) comprehensive greenhouse gas (GHG) life cycle analysis also determined that biodiesel made from soy or waste grease reduced GHG emissions by at least 50% compared to the 2005 baseline emissions from petroleum diesel (U.S. EPA 2010).
Numerous studies have shown that burning biodiesel reduces PM, carbon monoxide, and total hydrocarbons in tailpipe exhaust when compared to petroleum diesel (Bagley et al. 1998; Graboski and McCormick 1998; Durbin et al. 2000; McCormick et al. 2001; Chen and Wu 2002; U.S. EPA 2002b; McCormick et al. 2006; Lapuerta et al. 2007; Robbins et al. 2009; Yanowitz and McCormick 2009). Biodiesel is the only alternative fuel that has completed the EPA Clean Air Act Tier I and II testing requirements for health effects. In the Tier II animal study, rats were exposed to 100% soy-based biodiesel (B100) exhaust at three levels represented by exhaust concentrations diluted to 5, 25, or 50 ppm nitrogen oxides (NOx). After 90 days, Finch et al. (2002) documented only modest adverse effects at the highest exposure level. Inhalation exposures for the rats resulted in a dose-related increase in particle-containing alveolar macrophages; however, this observation was comparable to findings from similar rat exposure studies utilizing petroleum diesel exhaust (Finch et al. 2002).
Although biodiesel blends consistently reduce total PM emissions as compared to petroleum diesel, the soluble organic fraction (SOF) of biodiesel PM is typically higher than the SOF of diesel PM (Graboski and McCormick 1998; Durbin et al. 2000; Graboski et al. 2003; Knothe et al. 2006). The impact of the increased SOF remains unclear, but some researchers have reported that biodiesel PM SOF may be a more potent inflammatory stimulant to human airway epithelial cells than diesel PM SOF (Swanson et al. 2009).
The U.S. EPA (2002b) has identified a number of biodiesel research needs, including more data from non-road engines and newer heavy-duty engine models. Yanowitz and McCormick (2009) report that the biodiesel emissions database may not be representative of the current North American fleet; since more than 50% of tested engines date from model year 1995 or earlier, inclusion of newer engine model emission profiles is needed. Research examining the relationship between actual heavy-duty driving cycles and biodiesel emissions is also recommended (Yanowitz and McCormick 2009). Mobile laboratory studies of on-road emissions from diesel engines have demonstrated high variability in EC/OC and EC/PM ratios, depending on engine operating mode (Shah et al. 2004). Thus, real-world operation may result in far different biodiesel emissions profiles than standardized engine dynamometer tests, especially important when considering biodiesel’s potential contributions to airshed pollutant inventories and human exposures.
Although numerous biodiesel emission studies exist, biodiesel exposure studies are nearly absent from the literature. More specifically, it is unclear whether the tailpipe emission reductions observed in engine dynamometer and on-road studies utilizing biodiesel blends will translate into similar exposure reductions in the workplace and near-field. Many scientists have called for improved human exposure assessment for key air pollutants across a broader range of exposure scenarios to better understand the relationship between pollution and health (Brook et al. 2009). At the time of this writing, the authors could locate only internal Mine Safety and Health Administration reports on biodiesel exposures, which indicated that biodiesel use reduced work area concentrations of PM and EC while increasing the OC fraction (Gerbec and Fields 2003; Schultz and Atchinson 2003; Schultz et al. 2009). Characterizing additional real-world exposure scenarios to biodiesel exhaust is thus a critical research need (Swanson et al. 2007).
The objective of this study was to evaluate the impact of petroleum diesel and a soy-based 20% biodiesel/80% petroleum diesel blend (B20) on occupational and environmental PM2.5 and EC/OC exposures at a municipal materials recovery facility utilizing HDD non-road equipment.
Materials and methods
Site description
Air monitoring was conducted during the summer of 2006 at the Keene Recycling Center (KRC), a municipal materials recovery facility in Keene, NH. At this location, waste collection trucks from Keene and surrounding towns in southwestern New Hampshire drop off recyclable and non-recyclable materials for processing. Because of its relative isolation from other roads, on-site diesel and gasoline vehicles are the only emission sources at this facility in the summer months. The KRC was selected as a research site because of its remote location, the lack of interfering combustion sources, the consistency of its operations on a week-to-week basis, and its use of well-maintained non-road diesel equipment.
Four primary pieces of common non-road equipment were in use at the KRC at the time of this study: a large front end loader (2001 John Deere model 624H-160 HP), a small front end loader (1994 JCB model 409-67 HP), a skid steer (2001 New Holland LS190-33 HP), and a TCM propane-powered forklift. These older models lacked emissions control technology, but the equipment did undergo regularly scheduled maintenance as part of a documented, comprehensive preventative maintenance program. Equipment activity typically cycled between idling, “stop and go,” and lifting modes.
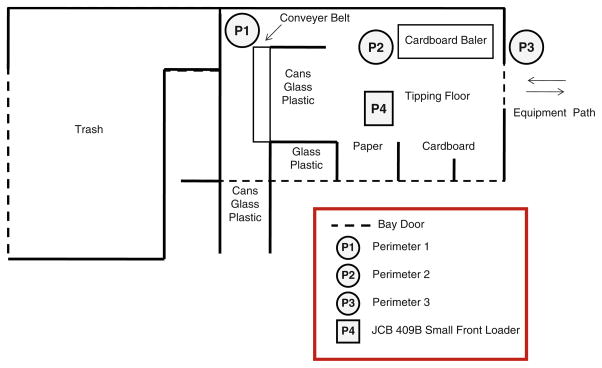
The KRC experiences a mixed traffic pattern of KRC vehicles, private diesel-powered hauling vehicles, and private gas- or diesel-fueled cars and trucks. The KRC building (Fig. 1) has no mechanical ventilation, so air flow occurs by natural ventilation only; manually operated bay doors are kept in similar positions each day (two thirds open), and air consistently flows across the main floor area from the large bay door at P3 to the smaller side doors opposite P2.
Fig. 1.
Study site layout. Keene Recycling Center (KRC), Keene, New Hampshire
Study design
Sampling was conducted over a 10-week period from June to August 2006; specific fuel blends and sampling dates are outlined in Table 1. We regarded each piece of KRC heavy equipment as a pollutant source, with in-cabin measurements assumed to represent “worst-case” employee exposures. The entire KRC site is a smoke-free area, and all monitored employees were non-smokers in consideration of the potential confounding effects of cigarette smoking found by other researchers (Zaebst et al. 1991). For both petroleum diesel and biodiesel sampling days, researchers performed equipment calibrations before and after sampling activities and regularly performed operational checks on the equipment while in use. Field days were cancelled in the event of rain because precipitation can remove particles from the air.
Table 1.
Sampling dates by fuel type
| P100 (diesel days) | B0–B10 (transition days) | B20 (biodiesel days) |
|---|---|---|
| 6/27/06 | 7/24/06 | 8/7/06 |
| 7/10/06 | 7/25/06 | 8/8/06 |
| 7/11/06 | 7/26/06 | 8/9/06 |
| 7/12/06 | 7/27/06 | 8/10/06 |
| 7/13/06 | 8/14/06 | |
| 7/14/06 | 8/15/06 | |
| 8/16/06 | ||
| 8/17/06 |
Boldface denotes high activity days
Air monitoring instrumentation was placed in the same locations each day for each fuel type, and the same KRC employees operated the same pieces of equipment during both diesel and biodiesel sampling days. Figure 1 provides a floor plan of the facility and the four primary sampling locations, identified as perimeters 1 through 4. Perimeter 1 (P1) was located inside the facility, approximately 50 ft from the tipping floor and adjacent to a conveyor belt used to separate plastic, glass, and metal recyclables into segregated piles for transfer to the appropriate processing facility. The majority of KRC employees worked here throughout the day, sorting recyclable materials by hand. Perimeter 2 (P2) was centrally located in the main tipping floor area, on a stairwell approximately 8 ft aboveground. Perimeter 3 (P3) was located directly outside the main tipping entrance, within approximately 25 ft of the tipping floor. Perimeter 4 (P4) was located inside the cab of the JCB small front loader. P1 and P2 were considered “work area” sampling locations and P3 the “near-field” or “environmental” sampling location. P4 was considered an approximation of “personal” sampling as the equipment was placed in-cabin near the employee’s breathing zone. P1, P2, and P4 were thus representative of occupational exposure, and P3 represented environmental exposure. PM2.5 and EC/OC were measured at all four perimeters.
As outlined in Table 1, sampling first occurred during 10 days (hereafter, “diesel days”) when equipment operated on commercially purchased, on-road grade diesel fuel (500 ppmw maximum allowable sulfur content in 2006). The facility’s main fuel tank was then filled with a soy-based B20 blend [with the balance 80% low sulfur petroleum fuel (500-ppmw maximum allowable sulfur content)]. The biodiesel used in the B20 blend met the ASTM D6751 quality standard. Approximately 240 gallons of P100 (100% petroleum) diesel remained in the tank when the first B20 delivery was made, so for the next four sampling days (hereafter referred to as “transition days”), fuel burned at the site was approximately B10 (10% biodiesel/90% petroleum diesel). Finally, we sampled 8 days when the KRC equipment had fully transitioned to B20 (hereafter, “biodiesel days”). While detailed on-site fuel analysis was not performed, sulfur content in the delivered fuel was checked via the fuel distributor’s records and found to be 305 ppmw for the first P100 shipment and 230 ppmw for the diesel fractions in the subsequent two B20 shipments. Since biodiesel does not contain sulfur, the sulfur content in the B10 to B20 blends used during this study was proportionally <230 ppmw.
Sampling and analytical methods
PM2.5 was collected at all four perimeters via Sioutas cascade impactors and SKC Leland Legacy pumps, calibrated to a flow rate of 9 L/min with a Bios DryCal primary calibrator. The Sioutas impactors use 25-mm (0.5-μm pore size) polytetrafluoroethylene (PTFE) filters to collect PM at various size cuts: Stage A collects particles with diameters>2.5 μm; stage B, 2.5–1.0 μm; stage C, 1.0–0.5 μm; stage D, 0.5–0.25 μm; and <0.25 μm is collected on a 37-mm PTFE (2.0-μm pore size) afterfilter.
Filters were equilibrated at a constant temperature and humidity for 24 h and pre-weighed in a temperature- and humidity-controlled environment before being loaded into the impactors for sampling. At the end of each work shift sampling period, the impactors were disassembled in a temperature- and humidity-controlled environment and filters were placed in an archival storage system (SKC Filter Keeper). The filters were again equilibrated at constant temperature and humidity for 24 h before being reweighed. Gravimetric analysis was performed by a single analyst. Total PM2.5 mass was calculated as the sum of the masses from stage B through the afterfilter. Filters with no accumulated mass were excluded from data analysis.
EC/OC samples were collected with preassembled SKC DPM quartz filter cassettes (no. 225–317) and SKC PCXR8 pumps, calibrated to a flow rate of 2 L/min using a Bios DryCal primary calibrator. The DPM cassettes used in this study were designed to exclude respirable dust particles>1.0 μm in diameter. At the end of each sampling day, DPM cassettes were sealed and catalogued for shipment to an external laboratory (Clayton Laboratories, MI) for thermo-optical analysis per NIOSH 5040. EC and OC values reported by the laboratory as less than the method’s limit of detection (2 μg/m3) were excluded from data analysis.
Student researchers recorded on-site weather data (wind speed, wind direction, temperature, and relative humidity) daily. They also tallied work shift counts of outside (non-KRC) gas and diesel vehicles at each perimeter. KRC non-road equipment activity patterns were observed and documented every 20 min at P2 and P3 using standardized criteria. Sampling days were categorized by activity level based on both the quantity and intensity of observed equipment activity patterns. For example, if the large front loader was observed moving with a load during a sampling interval, this observation would be recorded as a single (1) count of a high activity task. If the equipment was not moving or idling, it was recorded as “no” (0) count. Days with higher counts of observed high activity tasks were then grouped together as high-activity days. Six diesel days (including transition days) and four B20 days were categorized as “high-activity days.” These high-activity dates are in bold in Table 1. Concentration results for high-activity days were compared by fuel type to evaluate whether exposures varied based on activity patterns.
Statistical analysis
Data were mainly normally and log-normally distributed, but datasets for several perimeters had relatively small sample sizes. We therefore used non-parametric tests to determine whether there was a statistical difference (α= 0.05) in concentrations of PM2.5 and EC/OC between diesel and biodiesel fuels at each perimeter location (Mann–Whitney test) and between perimeter locations for the same fuel type (Kruskal–Wallis test; SPSS version 16.0).
Both the geometric mean (GM) and arithmetic mean (AM) values are presented, GM in tables and boxplots and AM in bar charts. Note that SPSS does not include outliers in the calculation and presentation of the median in the boxplots; however, outliers are included in the calculations for the geometric means listed in the tables.
The “total” mean (AM and GM) comprised pooled data from all four perimeters and reflected a conceptualization of the entire KRC facility operation as a stable and long-term source of ambient air pollution due to consistent utilization of non-road equipment.
Results
Fine particulate matter
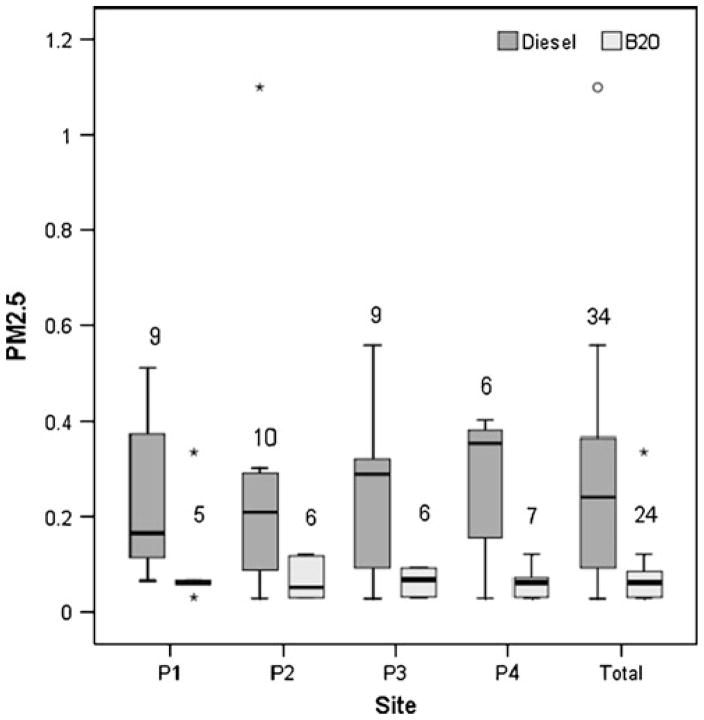
B20 use resulted in consistent and in some locations significant reductions in PM2.5 throughout the KRC (Figs. 2 and 3 and Table 2). Concentrations ranged from a high of 1.09 mg/m3 at P2 (diesel) to a low of 0.03 mg/m3 at P3 (transition day).
Fig. 2.
Comparison of diesel and B20 fine particulate matter (PM2.5) concentrations (measured in milligrams per cubic meter) at each location and summarized for the total site. The number above each boxplot denotes the number of work shift sampling periods (n). The line in the center of each box represents the median value. Hollow circles denote “outliers,” defined as values that are between 1.5 and 3 times the interquartile range. Asterisks denote “extreme values,” defined as values that are more than 3 times the interquartile range. Transition days (B0–B10) were included as diesel days in this comparison
Fig. 3.
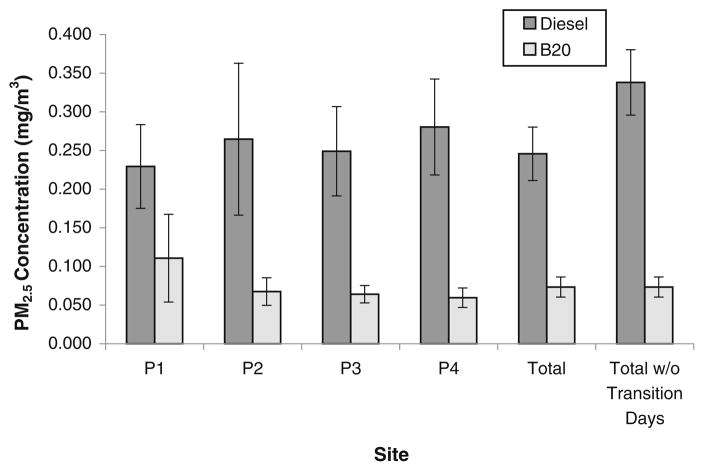
Fine particulate matter (PM2.5) concentrations (arithmetic mean±SE) at each location and the total site, reported in milligrams per cubic meter
Table 2.
Summary of fine particulate matter (PM2.5) concentrations at each location and for the total site (reported in mg/m3)
| PM2.5 | n | AM | SE | GM | GSD | Percent reduction |
|---|---|---|---|---|---|---|
| Diesel P1 | 9 | 0.23 | 0.05 | 0.18 | 2.1 | 56* |
| Biodiesel P1 | 5 | 0.11 | 0.06 | 0.08 | 2.4 | |
| Diesel P2 | 10 | 0.27 | 0.10 | 0.16 | 3.0 | 63 |
| Biodiesel P2 | 6 | 0.07 | 0.02 | 0.06 | 2.0 | |
| Diesel P3 | 9 | 0.25 | 0.06 | 0.17 | 3.0 | 65 |
| Biodiesel P3 | 6 | 0.06 | 0.01 | 0.06 | 1.6 | |
| Diesel P4 | 6 | 0.28 | 0.06 | 0.21 | 2.8 | 76* |
| Biodiesel P4 | 7 | 0.06 | 0.01 | 0.05 | 1.7 | |
| Total site diesel | 34 | 0.25 | 0.04 | 0.17 | 2.7 | 65** |
| Total site biodiesel | 24 | 0.07 | 0.01 | 0.06 | 1.9 |
Transition days (B0–B10) were included as diesel days in this comparison
AM simple arithmetic mean, SE standard error, GM geometric mean, GSD geometric standard deviation
p<0.05 (statistically significant difference);
p<0.01 (highly statistically significant difference)
PM2.5 was reduced by 56% at P1, 63% at P2, and 65% at P3 when KRC equipment switched to B20. In-cabin (P4) PM2.5 concentrations were reduced by 76% when the small front loader burned B20. B20 fuel use resulted in a 65% reduction in total site PM2.5 exposure. There were statistically significant differences in PM2.5 concentrations between fuels at P1 (p=0.028), P4 (p=0.046), and for the total site (p<0.0001). Although in-cabin (P4) exposures were expected to be higher than exposures at other perimeter locations, there was no significant difference in measured PM2.5 concentrations between perimeter locations per fuel type.
An unexpected result of this study was the immediate impact of even small percentages of biodiesel on PM2.5 concentrations. The fuel tank at the KRC was not drained of all petroleum diesel before the first B20 fuel delivery, so we considered the first 2 weeks after B20 delivery a fuel transition time. Removing these “transition days” from the pooled dataset resulted in a total site diesel (P100) PM2.5 concentration (GM) of 0.29 mg/m3 (GSD = 1.7). The corresponding B20 total site PM2.5 concentration (GM) was 0.06 mg/m3 (GSD = 1.9), representing a highly significant 79% reduction in PM2.5 exposure (p<0.0001). Figure 3 presents the corresponding total site AM concentrations with the transition days removed, highlighting the decrease in PM2.5 with an approximately B10 blend. Comparing PM2.5 concentrations from P100 diesel days to PM2.5 concentrations observed only on transition days resulted in a KRC total site PM2.5 concentration (GM) of 0.06 mg/m3 (GSD=2.2) for transition days compared to 0.29 mg/m3 (GSD = 1.7) for 100% petroleum days. This difference is highly statistically significant (p<0.0001).
PM2.5 data for high-activity days were analyzed separately. The KRC total site diesel PM2.5 GM for high-activity days (including transition days) was 0.19 mg/m3 (GSD = 2.7) compared to a total site GM of 0.06 mg/m3 (GSD=1.7) for B20 high-activity days, representing a 68% decrease in PM2.5 after the fuel switch. This difference is also statistically significant (p=0.011).
Elemental carbon
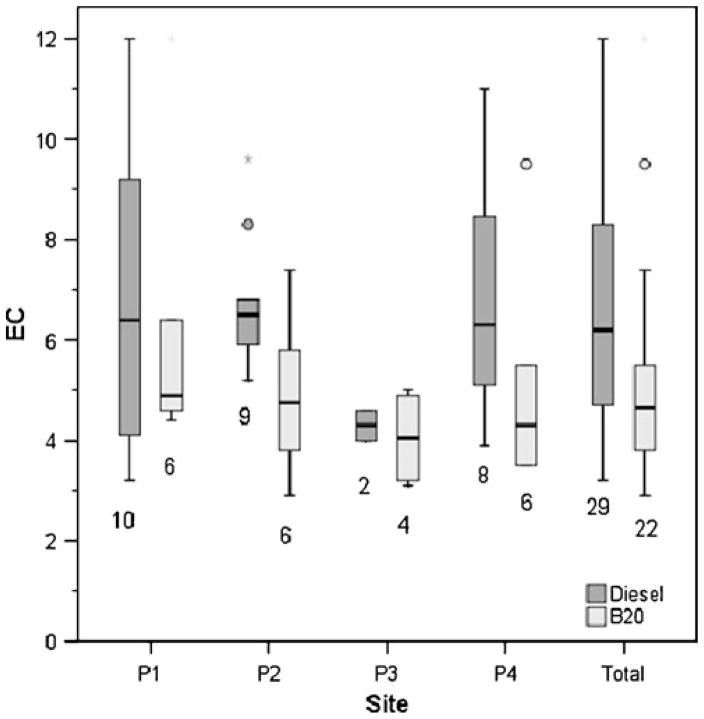
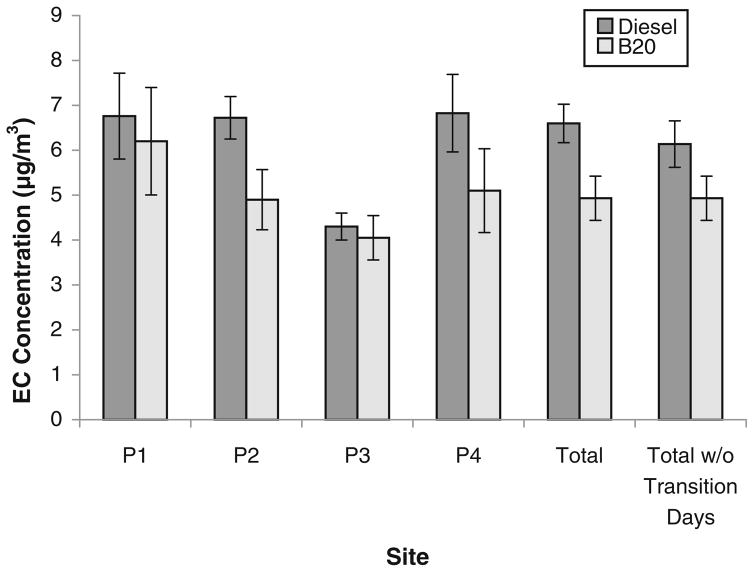
EC concentrations were consistently lower at all four perimeters during B20 use (Fig. 4 and 5 and Table 3). Concentrations ranged from a high of 12.0 μg/m3 at P1 (100% diesel and B20, on two different days) to a low of 2.9 μg/m3 at P2 (B20).
Fig. 4.
Comparison of diesel and B20 elemental carbon (EC) concentrations (measured in micrograms per cubic meter) at each location and summarized for the total site. The number below each boxplot denotes the number of sampling periods. The line in the center of each box represents the median value. Hollow circles denote “outliers,” defined as values that are between 1.5 and 3 times the interquartile range. Asterisks denote “extreme values,” defined as values that are more than 3 times the interquartile range. Transition days (B0–B10) were included as diesel days in this comparison
Fig. 5.
Elemental carbon (EC) concentrations (arithmetic mean±SE) at each location and the total site, reported in micrograms per cubic meter
Table 3.
Summary of EC concentrations at each location and for the total site (reported in μg/m3)
| Elemental carbon | n | AM | SE | GM | GSD | Percent reduction |
|---|---|---|---|---|---|---|
| Diesel P1 | 10 | 6.8 | 1.0 | 6.1 | 1.6 | 5 |
| Biodiesel P1 | 6 | 6.2 | 1.2 | 5.8 | 1.5 | |
| Diesel P2 | 9 | 6.7 | 0.5 | 6.6 | 1.2 | 29 |
| Biodiesel P2 | 6 | 4.9 | 0.7 | 4.7 | 1.4 | |
| Diesel P3 | 2 | 4.3 | 0.3 | 4.3 | 1.1 | 7 |
| Biodiesel P3 | 4 | 4.1 | 0.5 | 4.0 | 1.3 | |
| Diesel P4 | 8 | 6.8 | 0.9 | 6.5 | 1.4 | 26 |
| Biodiesel P4 | 6 | 5.1 | 0.9 | 4.8 | 1.5 | |
| Total site diesel | 29 | 6.6 | 0.4 | 6.2 | 1.4 | 23* |
| Total site biodiesel | 22 | 4.9 | 0.5 | 4.8 | 1.4 |
Transition days (B0–B10) were included as diesel days in this comparison
AM simple arithmetic mean, SE standard error, GM geometric mean, GSD geometric standard deviation
p<0.05 (statistically significant difference)
EC was reduced by 5% at P1, 29% at P2, and 7% at P3 when KRC equipment switched to B20. In-cabin (P4) EC concentrations were reduced by 26% when the small front loader burned B20. Between-fuel differences in EC at each perimeter were not statistically significant. However, B20 fuel use resulted in a 23% reduction in total site levels of EC at the KRC, a statistically significant difference (p= 0.011). Although in-cabin (P4) exposures were expected to be higher than other perimeter locations, there was no significant difference in measured EC concentrations between perimeter locations per fuel type. Removing the transition days from the dataset did not result in a significant reduction in EC between fuel types; however, during days of high equipment activity, the total site diesel EC GM value was 7.3 μg/m3 (GSD=1.3) compared to the total site B20 EC GM of 5.5 μg/m3 (GSD=1.5). This difference was statistically significant (p=0.030).
Organic carbon
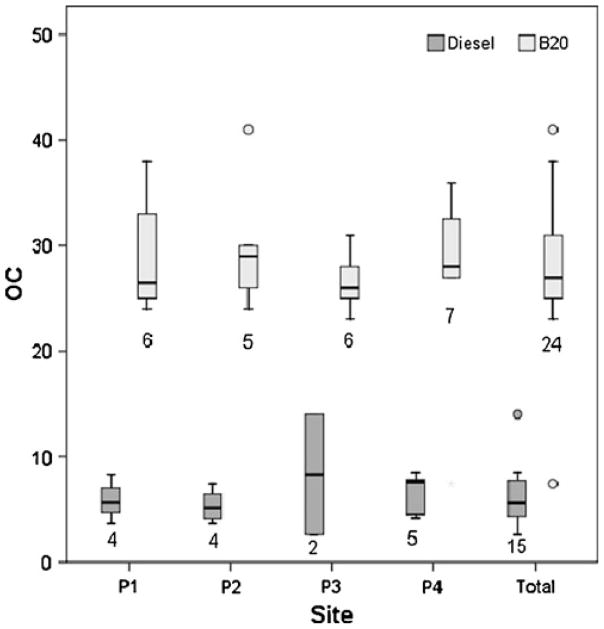
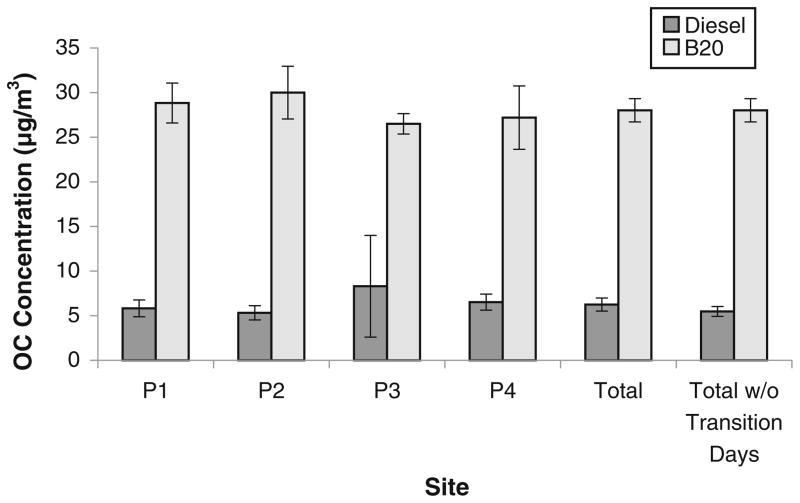
OC concentrations were consistently and significantly higher during B20 sampling days than during diesel days (Figs. 6 and 7 and Table 4). Concentrations ranged from a high of 41.0 μg/m3 at P2 (B20) to a low of 2.6 μg/m3 at P3 (100% diesel).
Fig. 6.
Comparison of diesel and B20 organic carbon (OC) concentrations (measured in micrograms per cubic meter) at each location and summarized for the total site. The number below each boxplot denotes the number of sampling periods. The line in the center of each box represents the median value. Hollow circles denote “outliers,” defined as values that are between 1.5 and 3 times the interquartile range. Asterisks denote “extreme values,” defined as values that are more than 3 times the interquartile range. Transition days (B0–B10) were included as diesel days in this comparison
Fig. 7.
Organic carbon (OC) concentrations (arithmetic mean ±SE at each location and the total site, reported in micrograms per cubic meter
Table 4.
OC concentrations at each location and for the total site (reported in μg/m3)
| Organic carbon | n | AM | SE | GM | GSD | Percent increase |
|---|---|---|---|---|---|---|
| Diesel P1 | 4 | 5.8 | 0.9 | 5.6 | 1.40 | 407* |
| Biodiesel P1 | 6 | 28.8 | 2.2 | 28.4 | 1.20 | |
| Diesel P2 | 4 | 5.3 | 0.8 | 5.2 | 1.34 | 467* |
| Biodiesel P2 | 5 | 30.0 | 2.9 | 29.5 | 1.22 | |
| Diesel P3 | 2 | 8.3 | 5.7 | 6.0 | 3.29 | 340* |
| Biodiesel P3 | 6 | 26.5 | 1.1 | 26.4 | 1.1 | |
| Diesel P4 | 5 | 6.5 | 0.9 | 6.3 | 1.4 | 294* |
| Biodiesel P4 | 7 | 27.2 | 3.6 | 24.8 | 1.7 | |
| Total site diesel | 15 | 6.3 | 0.7 | 5.7 | 2.4 | 374** |
| Total site biodiesel | 24 | 28.0 | 1.3 | 27.0 | 2.1 |
Transition days (B0–B10) were included as diesel days in this comparison
AM simple arithmetic mean, SE standard error, GM geometric mean, GSD geometric standard deviation
p<0.05 (statistically significant difference);
p<0.01 (highly statistically significant difference)
OC concentrations increased 407% at P1, 467% at P2, and 340% at P3 when KRC equipment switched to B20. In-cabin (P4) OC concentrations increased by 294% when the small front loader burned B20. B20 fuel use resulted in a 374% increase in mean total site OC. The differences at perimeters P1, P2, P3, and P4 were significant (p<0.05) and the difference in total site OC was highly significant (p<0.0001). Although in-cabin (P4) exposures were expected to be higher than other perimeter locations, there was no significant difference in measured OC concentrations between perimeter locations per fuel type. However, during days of high equipment activity, the total site B20 OC GM was 26.2 μg/m3 (GSD=1.5) compared to the total site diesel OC mean of 5.9 μg/m3 (GSD=1.6). This difference was highly statistically significant (p<0.0001).
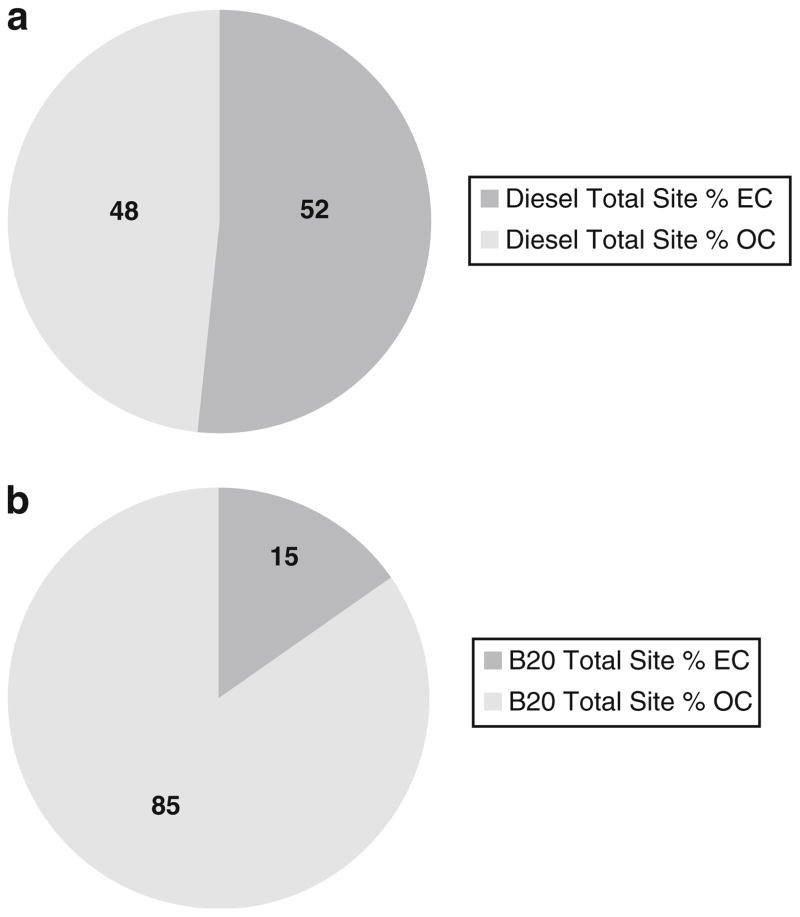
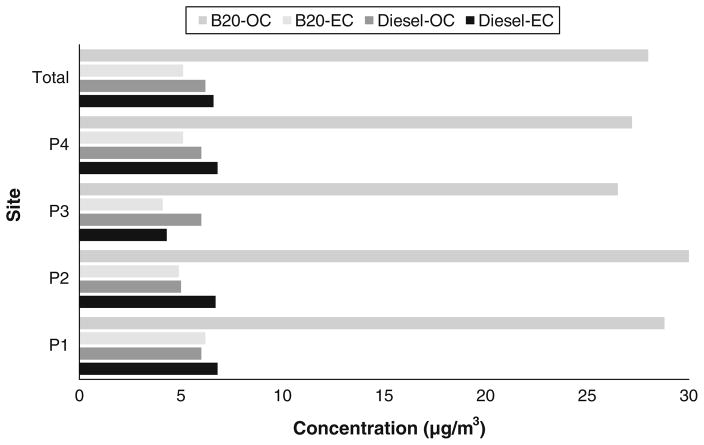
Further review of the EC/OC data reveals that PM composition varied dramatically with fuel type (Figs. 8 and 9). The mean percentage EC fraction of total carbon (where total carbon, TC=EC+OC) during diesel fuel use ranged from 42% to 57% at the four individual perimeters; the mean total site diesel EC fraction was 52%. In contrast, the average EC fraction during B20 fuel use ranged from 13% to 18% of total carbon, and the mean total site B20 EC fraction was 15%, indicating that B20-generated PM was primarily composed of OC. The average EC/OC ratio across all sampling locations during petroleum diesel use was 1.29 and the average EC/OC ratio during B20 use was 0.21. This difference was highly significant (p<0.001).
Fig. 8.
a Elemental carbon/organic carbon (EC/OC) composition during diesel fuel use days. b Elemental carbon/organic carbon (EC/OC) composition during B20 fuel use days
Fig. 9.
Comparison of elemental and organic carbon (EC/OC) levels by fuel and location, reported in micrograms per cubic meter
Site parameters (weather, vehicle counts)
Weather conditions at the KRC were consistent throughout the sampling season. The average temperature (±SE) for diesel sampling days (including fuel transition days) was 78±1.5°F compared to an average temperature of 74±1.3°F for B20 sampling days. While this difference was statistically significant (p=0.050), it is unlikely that a 4° difference resulted in increased pollution due to secondary formation processes. Average relative humidity was not significantly different between diesel and B20 use: 67±6% on diesel and transition days compared to 64±6% on B20 days. Average wind speed at the site was also consistent throughout sampling: 3.0 mph during diesel and transition days compared to 2.9 mph during B20 days.
There were no significant differences in outside vehicle traffic between diesel and B20 sampling days. The average number of gasoline-powered cars during diesel and transition days was 80±11 cars versus 68±11 cars on B20 days. The average number of outside diesel-powered vehicles was 9±4 vehicles on diesel and transition sampling days compared to 8±2 on B20 days.
Comparison to environmental and occupational health standards
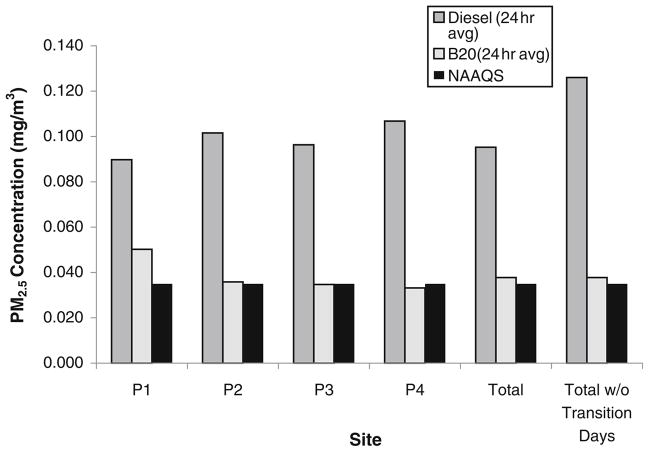
It is important to consider these findings within the context of established regulatory limits for the Occupational Safety and Health Administration (8-h respirable fraction of 5 mg/m3 or 5,000 μg/m3 for PM with an aerodynamic diameter of d50 ≤ 4.0 μm) and the EPA [24-h National Ambient Air Quality Standard (NAAQS) of 0.035 mg/m3 or 35 μg/m3 for fine particulate matter, aerodynamic diameter d50 ≤ 2.5 μm]. The Mine Safety and Health Administration has implemented a DPM limit (measured as total carbon) of 160 μg/m3. PM2.5 levels at the KRC during diesel use ranged from a minimum of 0.03 mg/m3 to a maximum of 1.09 mg/m3, with a median value of 0.25 mg/m3. Due to size cut and timescale differences between environmental and occupational exposure limits, most of the KRC 8-h time-weighted averages were far above safe environmental exposure levels (35 μg/m3), but still well below acceptable occupational exposure levels (5000 μg/m3). However, KRC workers potentially experienced 24-h average PM2.5 exposures during diesel fuel use ranging from 0.09 to 0.12 mg/m3. This range was conservatively calculated using the average PM2.5 work shift concentration (8-h exposure) and an ambient background exposure level of 0.016 mg/m3 (based on historical data) for the remaining 16 h in the day (Fig. 10). During diesel operations, workers at the KRC may have experienced integrated 24-h PM2.5 exposures almost three times higher than EPA’s NAAQS of 35 μg/m3 (Fig. 10).
Fig. 10.
Comparison of mean fine particulate matter (PM2.5) concentrations at the KRC to the National Ambient Air Quality Standard (NAAQS), reported in milligrams per cubic meter
Discussion
Diesel engine emissions are an important source of PM in ambient air and many occupational settings. New diesel engines have been engineered to yield cleaner emissions. However, with HDD engine life expectancy at approximately 10–20 years, older models will still be in use for many years. Biodiesel is a renewable fuel that can be blended into existing diesel fuel supplies and substituted immediately in most diesel engines. The dramatic reduction in PM2.5 observed after the fuel switch to B20 in this study was robust, occurring across all locations and days and during all levels of activity. These results suggest that using B20 in non-road equipment can lead to immediate reductions of workplace and near-field levels of PM2.5.
EC levels were also consistently reduced during B20 use at the KRC. Because of the relatively high EC content in diesel PM compared to PM from other sources, EC is considered by many researchers to be the best signature for diesel exhaust emissions or exposures (HEI Diesel Epidemiology Working Group 2002; Ramachandran et al. 2005). However, EC/OC ratios vary based on mode of vehicle operation and engine type, with higher EC/OC ratios noted during transient engine operation (Shah et al. 2004).
Further analysis of the EC/OC results indicated substantial differences between fuels. The EC fraction of total carbon during petroleum diesel use ranged from 42% to 57%, consistent with EC fractions of 30–70% in tailpipe emissions and work area samples reported by other researchers (Shi et al. 2000; Zielinska et al. 2002, 2008; Shah et al. 2004). However, the EC fraction during B20 use was much lower, ranging from only 13% to 18%.
The average EC/OC ratio during petroleum diesel use in this study was 1.29 compared to 0.21 during B20 use. In on-road studies of HDD engines fueled by ULSD, higher EC/OC ratios (>1) are associated with cruise and transient engine operations, while lower ratios (<1) are associated with cold start or idle conditions (Cocker et al. 2004; Shah et al. 2004). There is far less literature regarding biodiesel’s impact on EC and OC emissions and exposures, but Bugarski et al. (2010) recently examined the use of biodiesel/ULSD blends in a 56-hp non-road engine operating under different conditions in a simulated underground environment. For pure ULSD, EC/OC ratios ranged from 1.56 (lower load) to 10.5 (higher load), corresponding to EC fractions of 61% and 91%, respectively. Switching to a B50/ULSD blend resulted in EC/OC ratios of 0.69 (lower load) and 8.1 (higher load), corresponding to EC fractions of 41% and 89%, respectively. The authors note that increasing blend percentage from B50 to B100 further increased the OC fraction and suggest that this may be due to an increase in particle-bound volatile organic fraction of the PM (Bugarski et al. 2010).
While we evaluated exposures associated with different equipment types and fuel blends, OC fractions in this study were consistently and significantly higher during B20 fuel combustion. The increased OC may be related to increased SOF. Knothe et al. (2006) evaluated PM from a heavy-duty diesel engine and found that SOF was significantly higher with a soy-based biodiesel (B100) than with petroleum diesel. Strzelec et al. (2010) evaluated ULSD/biodiesel blend emissions from a four-cylinder engine and found that methyl esters in the SOF increased as the percentage of biodiesel increased. Biodiesel is less volatile than petroleum diesel, which may contribute to increased SOF. However, in our study, the increased OC may also have been influenced by variability in operating modes of the different sources.
Depending on the chemical species present in the organic fraction of biodiesel PM, increased OC may or may not have implications for human health. The health impacts of elevated SOF in biodiesel particles are of concern, however, as SOF extracts may increase inflammatory protein expression in human lung epithelial cells (Swanson et al. 2009). Lower EC content associated with B20 use could also pose a challenge for differentiating biodiesel-related PM from other sources of PM if biodiesel use in diesel engines increases in the future.
Numerous studies have reported that burning biodiesel blends in HDD engines reduces PM (U.S. EPA 2002b; McCormick et al. 2006; Lapuerta et al. 2007; Frey et al. 2008; Yanowitz and McCormick 2009). While a reduction in PM2.5 mass was thus expected, the magnitude of the results were unanticipated, especially since the literature indicates that B20 use results in an average 10–24% reduction in PM emissions (U.S. EPA 2002b; McCormick et al. 2006; Robbins et al. 2009). Possible explanations for the degree of difference between the results we observed and those reported by other studies follow. First, engine dynamometer studies typically measure tailpipe emissions from on-road heavy-duty engines operated under controlled engine and environmental conditions such as those indicated in the federal testing procedure (40 CFR 86). In contrast, real-world driving and operating conditions are highly variable. Our study measured exposures from non-road engines operating in a real-world setting, typically performing stop-and-go, heavy lifting activities resulting in combustion of more fuel-rich mixtures. These types of heavy load activity patterns typically lead to increased generation of PM, yielding higher emissions. Frey et al. (2008) used a portable emissions measurement system to evaluate exhaust from motor graders fueled with B20 and petroleum diesel during various on-road repair activities such as resurfacing and shouldering. They too found that PM emission factors varied between vehicles and duty cycles, but were consistently reduced (from 8% to 48%) with B20 use.
Exposure assessment as a research approach uses different methods and strategies than emissions testing, so direct study-to-study comparisons must be done with caution. Exposure assessment measures concentrations in workers’ breathing zones and other near-field or community locations that are representative of actual human exposure to air pollutants. Units of exposure are reported as concentration per unit time (e.g., micrograms per cubic meter or milligrams per cubic meter per work shift). Since exposures occur during real-world scenarios, subject to varying weather and operating conditions, exposure profiles are highly variable. Engine dynamometer studies experience much less environmental variability and measure diluted pollutants at the tailpipe; emission units are reported as mass of pollutant emitted per unit power, time, or mass of fuel consumed. Tailpipe data provide important information regarding sources and composition of diesel emissions and aggregate mobile source contributions to airshed pollution inventories, especially for PM and NOx. Exposure—defined in this instance as human contact with tailpipe emissions—is a key link in the chain between emissions and human health effects. Ultimately, both emission and exposure studies are necessary for developing a fuller understanding of the potential impact of biodiesel on air pollution and human health.
While it is difficult to compare PM2.5 mass concentration to EC+OC due to the different measurement techniques, different size cuts (d50 of 2.5 versus 1.0 μm), and the high variability of exposures in the workplace microenvironment, we observed a significant difference between PM2.5 mass and EC+OC concentrations for both fuels. Differences in sulfur content within and between fuels may be a key explanatory factor. The petroleum fuel used in this study predated the 2007 ULSD mandate and also had a higher sulfur content (305 ppmw) than the sulfur content of the petroleum diesel fraction (230 ppmw) in the B20 blend. Due to dilution by the biodiesel as well as the initial lower sulfur content in the diesel fraction, the B20 blend contained approximately 40% less sulfur than the petroleum diesel fuel. As sulfur content in diesel fuel decreases, so do total PM mass emissions. Saiyasitpanich et al. (2005) found that decreasing sulfur content from 3,700 to 500 ppm resulted in a corresponding 51% decrease in diesel PM concentration in a 75-kW generator at full load. Zhang et al. (2009) determined that the PM10 emission rates from a four-cylinder diesel engine decreased up to 56.6% after switching from a 500- to a 30-ppm low-sulfur fuel. In a study measuring diesel exhaust exposures in an underground mine and characterizing source emissions from non-road mining equipment, Zielinska et al. (2002) determined that the impact of sulfur on total PM mass was significant, with sulfate ranging from 1% to 24% of total PM mass from source emissions. The dramatic decrease in PM documented during B20 use in this study may therefore be partly due to the lower sulfur content of the B20 fuel.
Important, fundamental differences in the fuel chemistry between biodiesel and petroleum diesel may also partially explain our findings. Pure biodiesel does not contain aromatic hydrocarbons or sulfur, but consists of methyl esters, which contain oxygen embedded within the hydrocarbon chain. This increased oxygen content enhances combustion, thereby reducing soot formation, which, when combined with a lack of sulfur and aromatics, results in lower overall PM mass (Lapuerta et al. 2007). Other researchers have concluded that the higher oxygen content available in oxygenates such as biodiesel may lead to decreased smoke and PM emissions during non-road engine, heavy load operations (Di et al. 2009). The oxygen within the biodiesel itself may be more available as fuel is burned in the diffusion mode typically occurring during heavy load conditions. Mueller et al. (2003) determined that selection of an appropriate oxygenate (with an optimal molecular structure for reducing soot precursors) can be especially effective at reducing in-cylinder soot formation. Therefore, the increased oxygen content in biodiesel may have effectively increased air/fuel ratios in the fuel rich zones during heavy engine load, stop-and-go conditions such as those seen during this exposure study and previous work (Traviss et al. 2010), leading to reduced PM exposures.
Comparison of results to environmental health standards
This study and others (Cantrell and Watts 1997; Groves and Cain 2000; Garshick et al. 2002; Wheatley and Sahdra 2004) have shown that workers typically experience diesel exposures orders of magnitude higher than those experienced by the general public, including populations in polluted urban areas. The diesel exposures (PM2.5, EC/OC) at the KRC were similar to levels reported for different occupations, such as short-distance truckers and dockworkers (Garshick et al. 2002), though greater than exposures measured at US trucking terminals (Smith et al. 2006). KRC exposures (EC/OC) were up to three times lower than exposures measured at distribution depots in the UK utilizing diesel-powered forklifts (Wheatley and Sahdra 2004).
B20 use reduced 24-h average PM2.5 exposures at the KRC to levels near or below the NAAQS (Fig. 10), suggesting that B20 can help workplaces and communities meet local air quality standards for PM2.5. B20 may offer particular promise for workplace risk reduction to the hazards associated with diesel-generated PM exposure, especially for workplaces that utilize non-road construction-type equipment. For state regulators in non-attainment areas for PM2.5, B20 blends could be a useful compliance tool.
It is more difficult to compare this study’s EC/OC levels to the EPA reference concentration (RfC) of 5 μg/m3 for whole diesel exhaust. The RfC is calculated as a 24-h average and is considered a daily inhalation exposure without appreciable risk of deleterious effects over the course of a lifetime, even to sensitive subgroups. Since ambient background levels of EC and OC were not available for this study, it is not possible to determine whether the RfC was exceeded. Nevertheless, the consistent reduction in EC by a B20 blend is noteworthy and suggests that B20 blends hold promise for reducing the health risks associated with EC exposure.
It is also important to note that OC levels increased significantly during B20 use. The implications of this increase are unclear. Nonetheless, even the highly significant B20 OC levels observed in our study were comparable to or lower than the OC levels associated with petroleum diesel exposures in the workplace, as determined by other researchers (Zaebst et al. 1991; Whittaker et al. 1999; Garshick et al. 2002; Wheatley and Sadhra 2004). When viewed in the context of the diesel exposure assessment literature, B20-related OC levels may not be more damaging than diesel-associated OC levels in the work-place. Further chemical characterization is needed to determine if there are more potent species within the B20 OC fraction.
Conclusion
Our results demonstrate that biodiesel blends can significantly reduce PM2.5 exposure compared to petroleum diesel fuel in a workplace utilizing non-road construction-type equipment. Use of this type of construction equipment is relatively common, with over 320,000 listings in the diesel tractor/loader/backhoe category in the non-road engine inventory (EPA 2005). Additional exposure research is recommended in this setting as well as in other exposure scenarios to determine whether this trend holds over time and in different applications. Although both total PM2.5 mass and EC decreased during B20 use, OC significantly increased, indicating a difference in PM composition between fuels. It is possible that the increased OC is related to the higher SOF in PM associated with biodiesel fuel combustion (Knothe et al. 2006). Further research is recommended to fully characterize the higher OC fraction in biodiesel blends as well as to better understand the biological impact of increased OC.
Fuel sulfur content was an important factor influencing PM2.5 mass. Additional research is recommended to evaluate PM2.5, EC, and OC exposures from combustion of ULSD and biodiesel blends. Health risks associated with exposure to PM2.5 have been well established (Pope 2000). However, there is no consensus regarding the best exposure metric for diesel particulate matter: particle size, mass, or surface area (Ramachandran et al. 2005). Thus, while our results suggest that B20 may reduce health risks associated with exposure to PM2.5 mass, more exposure research is needed to better understand biodiesel-related changes in PM composition and other exposure metrics.
Acknowledgments
The authors would like to thank Steve Russell, Duncan Watson, the City of Keene, New Hampshire, the staff of the Keene Recycling Center, and the Keene State College Safety Studies students and staff who directly supported this work. We especially thank the following undergraduate researchers at Keene State College for their assistance with this study: Conor Hobbs, Nikki Landry, Mike LeSage, Brendan McDuffee, and Kelly McGovern. This work was supported through funding provided by the National Institute of Health’s (NIH) Centers of Biomedical Research Excellence (COBRE) grant no. 1P20RR018787, and the United States Environmental Protection Agency’s (EPA) Science To Achieve Results (STAR) Fellowship grant no. FP916576. The content is solely the responsibility of the authors and does not necessarily represent the official views of the National Center for Research Resources, the National Institute of Health, or the Environmental Protection Agency.
References
- Bagley ST, Gratz LD, Johnson JH, McDonald J. Effects of oxidation catalytic converter and a biodiesel fuel on the chemical, mutagenic, and particle size characteristics of emissions from a diesel engine. Environ Sci Technol. 1998;32(9):1183–1191. [Google Scholar]
- Brook JR, Demerjian KL, Hidy J, Molina LT, Pennell WT, Scheffe R. New directions: results-oriented multi-pollutant air quality management. Atmos Environ. 2009;43:2091–2093. [Google Scholar]
- Bugarski AD, Cauda EG, Janisko SJ, Hummer JA, Patts LD. Aerosols emitted in underground mine air by diesel engine fueled with biodiesel. J Air Waste Manag Assoc. 2010;60:237–244. doi: 10.3155/1047-3289.60.2.237. [DOI] [PubMed] [Google Scholar]
- Cantrell BK, Watts WFJ. Diesel exhaust aerosol: review of occupational exposure. Appl Occup Environ Hyg. 1997;12(12):1019–1027. [Google Scholar]
- Chen YC, Wu CH. Emissions of submicron particles from a direct injection diesel engine by using biodiesel. J Environ Sci Health. 2002;37(5):829–43. doi: 10.1081/ese-120003591. [DOI] [PubMed] [Google Scholar]
- Cocker DR, III, Shah SD, Johnson KC, Zhu X, Miller JW, Norbeck JM. Development and application of a mobile laboratory for measuring emissions from diesel engines. 2. Sampling for toxics and particulate matter. Environ Sci Technol. 2004;38:6809–6816. doi: 10.1021/es049784x. [DOI] [PubMed] [Google Scholar]
- Di Y, Cheung CS, Huang Z. Comparison of the effect of biodiesel–diesel and ethanol–diesel on the particulate emissions of a direct injection diesel engine. Aerosol Sci Technol. 2009;43:455–465. [Google Scholar]
- Durbin TD, Collins JR, Norbeck JM, Smith MR. Effects of biodiesel, biodiesel blends, and a synthetic diesel on emissions from light heavy-duty diesel vehicles. Environ Sci Technol. 2000;34(3):349–355. doi: 10.1021/es011231o. [DOI] [PubMed] [Google Scholar]
- Finch GL, Hobbs CH, Blair LF, Barr EB, Hahn FF, Jaramillo RJ, et al. Effects of subchronic inhalation exposure of rats to emissions from a diesel engine burning soybean oil-derived biodiesel fuel. Inhal Toxicol. 2002;14:1017–1048. doi: 10.1080/08958370290084764. [DOI] [PubMed] [Google Scholar]
- Frey HC, Kim K, Pang S, Rasdorf WJ, Lewis P. Characterization of real-world activity, fuel use, and emissions for selected motor graders fueled with petroleum diesel and B20 biodiesel. J Air Waste Manag Assoc. 2008;58:1274–1287. [PubMed] [Google Scholar]
- Garshick E, Smith TJ, Laden F. Research directions to improve estimates of human exposure and risk from diesel exhaust. Health Effects Institute Diesel Epidemiology Working Group; Boston, MA: 2002. Quantitative assessment of lung cancer risk from diesel exhaust exposure in the US trucking industry: a feasibility study; pp. 115–149. [Google Scholar]
- Garshick E, Laden F, Hart JE, Rosner B, Smith TJ, Dockery DW, Speizer FE. Lung cancer in railroad workers exposed to diesel exhaust. Environ Health Perspect. 2004;112(15):1539–1543. doi: 10.1289/ehp.7195. [DOI] [PMC free article] [PubMed] [Google Scholar]
- Gerbec EJ, Fields K. Environmental diesel particulate matter investigation, PS&HTC-DD-03-316. Mine Safety & Health Administration; Pittsburgh, PA: 2003. [Google Scholar]
- Graboski MS, McCormick RL. Combustion of fat and vegetable oil derived fuels in diesel engines. Prog Energy Combust Sci. 1998;24:125–164. [Google Scholar]
- Graboski MS, McCormick RL, Alleman TL, Herring AM. The effect of biodiesel composition on engine emissions from a DDC Series 60 diesel engine, NREL/SR-510-31461. National Renewable Energy Laboratory; Golden, CO: 2003. [Google Scholar]
- Grahame TJ, Schlesinger RB. Cardiovascular health and particulate vehicular emissions: a critical evaluation of the evidence. Air Qual Atmos Health. 2010;3(1):3–27. doi: 10.1007/s11869-009-0047-x. [DOI] [PMC free article] [PubMed] [Google Scholar]
- Groves J, Cain JR. A survey of exposure to diesel engine exhaust emissions in the workplace. Ann Occup Hyg. 2000;44(6):435–477. [PubMed] [Google Scholar]
- HEI Diesel Epidemiology Working Group. Research directions to improve estimates of human exposure and risk from diesel exhaust. Health Effects Institute; Boston, MA: 2002. [Google Scholar]
- Khan N, Warith MA, Luk G. A comparison of acute toxicity of biodiesel, biodiesel blends, and diesel on aquatic organisms. J Air Waste Manag Assoc. 2007;57(3):286–296. doi: 10.1080/10473289.2007.10465333. [DOI] [PubMed] [Google Scholar]
- Knothe G, Sharp C, Ryan TW. Exhaust emissions of biodiesel, petrodiesel, neat methyl esters, and alkanes in a new technology engine. Energy Fuels. 2006;20:403–408. [Google Scholar]
- Lapuerta M, Armas O, Rodriguez-Fernandez J. Effect of biodiesel fuels on diesel engine emissions. Progress Energy Combust Sci. 2007;34(2):198–223. [Google Scholar]
- Lippmann M, Frampton R, Schwartz J, et al. The U.S. Environmental Protection Agency Particulate Matter Health Effects Research Centers Program: a midcourse report of status, progress, and plans. Environ Health Perspect. 2003;111(8):1074–1092. doi: 10.1289/ehp.5750. [DOI] [PMC free article] [PubMed] [Google Scholar]
- Mauderly JL. Diesel exhaust. In: Lippmann M, editor. Environmental toxicants: human exposures and their health effects. Wiley; New York: 2000. pp. 193–242. [Google Scholar]
- Maynard D, Coull BA, Gryparis A, Schwartz J. Mortality risk associated with short-term exposure to traffic particles and sulfates. Environ Health Perspect. 2007;115(5):751–755. doi: 10.1289/ehp.9537. [DOI] [PMC free article] [PubMed] [Google Scholar]
- McCormick RL, Graboski MS, Alleman TL, Herring AM, Tyson KS. Impact of biodiesel source material and chemical structure on emissions of criteria pollutants from a heavy-duty engine. Environ Sci Technol. 2001;35(9):1742–1747. doi: 10.1021/es001636t. [DOI] [PubMed] [Google Scholar]
- McCormick RL, Williams A, Ireland J, Brimhall M, Hayes RR. Effects of biodiesel blends on vehicle emissions, NREL/MP-540-40554. National Renewable Energy Laboratory; Golden, CO: 2006. [Google Scholar]
- Mueller CJ, Pitz WJ, Pickett LM, Martin GC, Siebers DL, Westbrook CK. Effects of oxygenates on soot processes in DI diesel engines: experiments and numerical simulations. SAE Paper 2003-01-1791 2003 [Google Scholar]
- NIOSH (National Institute of Occupational Safety and Health) [Accessed 1 June 2010];Carcinogenic effects of exposure to diesel exhaust. 1988 Publication No. 88–116. http://www.cdc.gov/niosh/88116_50.html.
- Pope CA. Epidemiology of fine particulate air pollution and human health: biologic mechanisms and who’s at risk? Environ Health Perspect. 2000;108:713–723. doi: 10.1289/ehp.108-1637679. [DOI] [PMC free article] [PubMed] [Google Scholar]
- Ramachandran G, Paulsen D, Watts W, Kittleson D. Mass, surface area and number metrics in diesel occupational exposure assessment. J Environ Monit. 2005;7:728–735. doi: 10.1039/b503854e. [DOI] [PubMed] [Google Scholar]
- Robbins C, Hoekman SK, Gertier A, Broch A. Biodistillate transportation fuels 2—emissions impacts. SAE paper 2009-01-2724 2009 [Google Scholar]
- Saiyasitpanich P, Lu M, Keener T, Liang F, Khang SJ. The effect of diesel fuel sulfur content on particulate matter emissions for a nonroad diesel generator. J Air Waste Manag Assoc. 2005;55:993–998. doi: 10.1080/10473289.2005.10464685. [DOI] [PubMed] [Google Scholar]
- Schultz MJ, Atchinson DJ. Environmental diesel particulate matter investigation, PS&HTC-DD-03-808. Mine Safety & Health Administration; Pittsburgh, PA: 2003. [Google Scholar]
- Schultz MJ, Fields KG, Atchison DJ, Gerbec EJ, Haney RA, Tomko DM, Love G, Kuhnhein G. Using biodiesel fuels to reduce DPM concentrations: DPM results using various blends of biodiesel fuel mixtures in a stone mine. Mine Safety & Health Administration; Pittsburgh, PA: 2009. [Google Scholar]
- Shah SD, Cocker DR, III, Miller JW, Norbeck JM. Emission rates of particulate matter and elemental and organic carbon from in-use diesel engines. Environ Sci Technol. 2004;38:2544–2550. doi: 10.1021/es0350583. [DOI] [PubMed] [Google Scholar]
- Shi JP, Mark D, Harrison RM. Characterization of particles from a current technology heavy-duty diesel engine. Environ Sci Technol. 2000;34:748–755. [Google Scholar]
- Smith TJ, Davis ME, Reaser P, Natkin J, Hart JE, Laden F, Heff A, Garshick E. Overview of particulate exposures in the US trucking industry. J Environ Monit. 2006;8(7):711–720. doi: 10.1039/b601809b. [DOI] [PMC free article] [PubMed] [Google Scholar]
- SCAQMD (South Coast Air Quality Management District) [Accessed 20 December 2007];Multiple air toxics exposure study (Mates II) 2000 http://www.aqmd.gov/matesiidf/es.pdf.
- Strzelec A, Storey JME, Lewis SA, Daw CS, Foster DE, Rutland CJ. Effect of biodiesel blending on the speciation of soluble organic fraction from a light duty diesel engine. SAE Paper 2010-01-1273 2010 [Google Scholar]
- Swanson KJ, Madden MC, Ghio AJ. Biodiesel exhaust: the need for health effects research. Environ Health Perspect. 2007;115(4):496–499. doi: 10.1289/ehp.9631. [DOI] [PMC free article] [PubMed] [Google Scholar]
- Swanson KJ, Kado NY, Funk WE, Pleil JD, Madden MC, Ghio AJ. Release of the pro-inflammatory markers by BEAS-2B cells following in vitro exposure to biodiesel extracts. Open Toxicol J. 2009;3:8–15. [Google Scholar]
- Traviss N, Thelen BA, Ingalls JK, Treadwell MD. Biodiesel versus diesel: a pilot study comparing exhaust exposures for employees at a rural municipal facility. J Air Waste Manag Assoc. 2010;60:1026–1033. doi: 10.3155/1047-3289.60.9.1026. [DOI] [PMC free article] [PubMed] [Google Scholar]
- U.S. EPA (United States Environmental Protection Agency) [Accessed 5 May 2006];Health assessment document for diesel engine exhaust, EPA/600/8-90/057F. 2002a http://cfpub.epa.gov/ncea/CFM/recordisplay.cfm?deid=29060.
- U.S. EPA. [Accessed 1 June 2010];A comprehensive analysis of biodiesel impacts on exhaust emissions. 2002b EPA420-P-02-001. http://www.biodiesel.org/resources/reportsdatabase/reports/gen/20021001_gen-323.pdf.
- U.S. EPA. Clean air nonroad diesel rule, EPA420-F-04-032. 2004. [Google Scholar]
- U.S. EPA. Nonroad engine population estimates, EPA420-R-05-022. 2005. [Google Scholar]
- U.S. EPA. [Accessed 14 June 2010];Diesel exhaust in New England. 2009 http://www.epa.gov/ne/eco/diesel/health_effects.html.
- U.S. EPA. [Accessed 2 January 2011];Regulation of fuels and fuel additives: changes to renewable fuel standard program, 75FR14670-14904. 2010 http://www.federalregister.gov/articles/2010/03/26/2010-3851/regulation-of-fuels-and-fuel-additives-changes-to-renewable-fuel-standard-program.
- Wheatley AD, Sadhra S. Occupational exposure to diesel exhaust fumes. Ann Occup Hyg. 2004;48(4):369–376. doi: 10.1093/annhyg/meh018. [DOI] [PubMed] [Google Scholar]
- Whittaker LS, MacIntosh DL, Williams PL. Employee exposure to diesel exhaust in the electric utility industry. J Am Industr Hyg Assoc. 1999;60:635–640. doi: 10.1080/00028899908984484. [DOI] [PubMed] [Google Scholar]
- Yanowitz J, McCormick R. Effect of biodiesel blends on North American heavy-duty diesel engine emissions. Eur J Lipid Sci Technol. 2009;111(7):763–772. [Google Scholar]
- Zaebst DD, Clapp DE, Blade LM, Marlow DA, Steenland K, Hornung RW, et al. Quantitative determination of trucking industry workers’ exposure to diesel exhaust particles. J Am Industr Hyg Assoc. 1991;52(12):529–541. doi: 10.1080/15298669191365162. [DOI] [PubMed] [Google Scholar]
- Zhang J, He K, Ge Y, Shi X. Influence of fuel sulfur on the characterization of PM10 from a diesel engine. Fuel. 2009;88:504–510. [Google Scholar]
- Zielinska B, Sagebiel JC, McDonald J, Rogers CF, Fujita E, Mousset-Jones P, Woodrow JE. Research directions to improve estimates of human exposure and risk from diesel exhaust. Health Effects Institute Diesel Epidemiology Working Group; Boston, MA: 2002. Measuring diesel emissions exposure in underground mines: a feasibility study; pp. 181–232. [Google Scholar]
- Zielinska B, Campbell D, Lawson DR, Ireson RG, Weaver CS, Hesterberg TW, Larson T, Davey M, Liu LJS. Detailed characterization and profiles of crankcase and diesel particulate matter exhaust emissions using speciated organics. Environ Sci Technol. 2008;42(15):5661–5666. doi: 10.1021/es703065h. [DOI] [PMC free article] [PubMed] [Google Scholar]


