Abstract
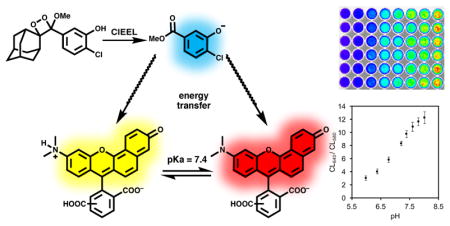
Chemiluminescence imaging offers a low background and high sensitivty approach to imaging analytes in living cells and animals. Intensity-based measurements have been developed, but require careful consideration of kinetics, probe localization, and fluctuations in quantum yield, all of which complicate quantification. Here, we report a ratiometric strategy for quantitative chemiluminescence imaging of pH. The strategy relies on an energy transfer cascade of chemiluminescence emission from a spiroadamantane 1,2-dioxetane to a ratiometric pH indicator via fluorescent dyes in Enhancer solutions. Monitoring the pH-dependent changes in chemiluminescence emission at multiple wavelengths enables ratiometric imaging and quantification of pH independent from variations due to kinetics and probe concentration.
Graphical Abstract
Introduction
Chemiluminescence light emission results from the relaxation of excited states formed in the course of a chemical reaction.1 Amongst myriad natural and synthetic chemiluminescent systems that have been investigated,2–8 triggered chemiluminescence emission from spiroadamantane 1,2-dioxetanes has emerged as particularly versatile.9–11 A wide variety of derivatives has been synthesized and applied for in vitro measurements,12–14 cellular experiments,15–18 and whole animal imaging.19–23 Despite exciting progress, most of these systems depend on a turn-on triggered response, which is vulnerable to false negatives and positives from variable intensities due to reaction kinetics and probe localization. These issues are also endemic to intensity-based fluorescence techniques, but ratiometric imaging methods that display a wavelength-dependent change in signal form an effective strategy to address these problems. Measuring the ratio of intensities at two different wavelengths in such a system provides an internal control that is less sensitive to experimental variables like probe concentration, and can enable more precise quantification of analytes. Ratiometric fluorescence imaging probes are available for quantitative imaging of a range of cations like Ca2+, Zn2+, and Mg2+.24–27 Fluorescence imaging of pH has been achieved with the ratiometric SNARF dyes and other pH sensitive indicators.28–33 Ratiometric imaging of reactive analytes is also common, but effective quantification requires the development of fast and reversible reactions.34,35 By contrast, ratiometric chemiluminescent systems are rarer despite the significant improvements in signal-to-noise and reduced autofluorescence that chemiluminescence imaging offers. Bioluminescent measurement of pH is possible by taking advantage of the pH-dependent emission of luciferin.36 While useful, this technique depends on using genetically modified organisms and the enzyme-catalyzed oxidation of luciferin depends on ATP and O2.
In order to capitalize on key advantages of chemiluminescence imaging including low background, reduced autofluorescence, and higher sensitivity,37,38 we report a ratiometric chemiluminescent strategy for quantitative imaging of pH. Chemiluminescence energy transfer has been previously used to red-shift emission wavelengths.39,40 Our approach uses an energy transfer cascade of the chemiluminescence emission from the phenolate derived from 1 to a dye in Sapphire II Enhancer or Emerald II Enhancer solutions and ending with the excitation of carboxy-SNARF-128 (Scheme 1), which has peak emissions at two wavelengths, 650 nm and 585 nm. The relative intensity at these two wavelengths is determined by the pH-dependent ratio of the protonated and deprotonated dye.
Scheme 1.
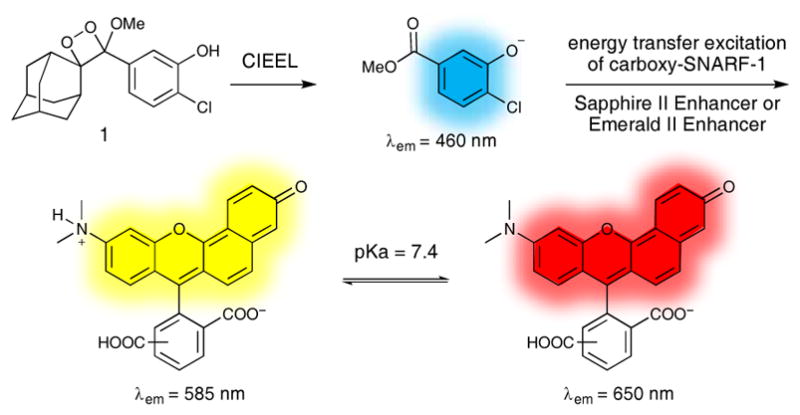
Energy transfer chemiluminescence for ratiometric pH imaging.
Results and Discussion
In order to maximize chemiluminescence emission from a spiroadamantane 1,2-dioxetane, we devised a procedure to synthesize and isolate the free phenol 1 (Scheme 2). Phenol 1 will equilibrate with the phenolate form, which spontaneously decomposes in a chemically initiated electron exchange lumninscence (CIEEL) mechanism to access the excited state and emit light. We hypothesized that protecting the phenol with a methoxymethyl ether (MOM) protecting group would enable acid-mediated deprotection after the [2+2] cycloaddition, thereby avoiding exposure of the phenol to basic conditions that are known to decompose this class of 1,2-dioxetanes. Starting from the known enol ether 2,20 treatment with MOMCl provided the protected enol ether 3, which was then treated with singlet oxygen generated using Rose bengal to mediate the conversion of triplet oxygen to singlet oxygen and yield 4. The MOM-protected dioxetane was then deprotected with para-toluenesulphonic acid (p-TSA) in methanol to provide the free phenol 1, which was purified by silica column chromatography. Carboxy-SNARF-1 was prepared by adapting a literature procedure.41
Scheme 2.
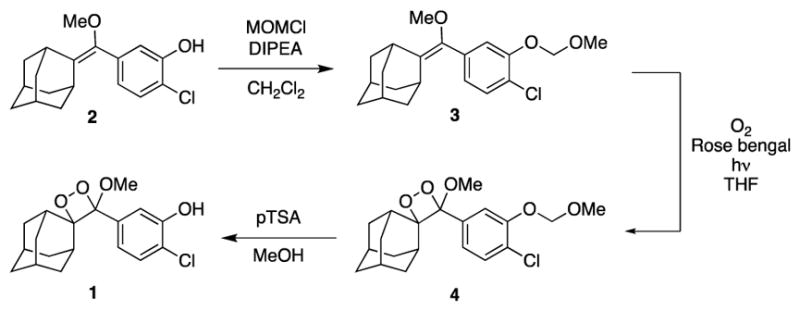
Synthesis and isolation of phenol 1.
With 1 and carboxy-SNARF-1 in hand, we proceeded to characterize the chemiluminescence emission of this combined system with an aim to determining the possibility of energy transfer to the ratiometric carboxy-SNARF-1. We prepared aqueous solutions of 1 and carboxy-SNARF-1 buffered to pH values between 6 and 10. In order to increase the magnitude of chemiluminescence emission, we added either Emerald II Enhancer or Sapphire II Enhancer. These proprietary solutions consist of a tetra-alkyl ammonium polymer that co-encapsulates the dioxetane and a fluorescent dye to enhance chemiluminescence emission and red-shift the emission wavelength via energy transfer. Measurements with a pH meter confirmed that there was no significant change in the pH in buffered solutions containing 6% Enhancer by volume. Solutions of 1, carboxy-SNARF-1, and Sapphire II Enhancer displayed two peaks in the chemiluminescence emission spectra at 467 nm and 650 nm (Figure 1A), which can be assigned to the phenolate derived from chemiluminescent decomposition of 1 (slightly red-shifted in the Sapphire II Enhancer solution) and carboxy-SNARF-1, respectively. As the pH of the solution increases, the intensity of each peak increases due to a larger equilibrium concentration of the phenolate. This is in contradistinction to fluorescence imaging using carboxy-SNARF-1, which is characterized by an isoemissive point.42 Careful inspection of Figure 1A, however, reveals that the carboxy-SNARF-1 peak increases more rapidly with increasing pH due to increased concentration of the deprotonated form, providing the wavelength-dependent emission that is needed for ratiometric measurement. Indeed, by plotting the ratio of the chemiluminescence emission intensities of the protonated and deprotonated forms of carboxy-SNARF-1 (585 nm and 650 nm, respectively), a ratiometric pH-dependent plot can be constructed (Figure 1B). This ratiometric response shows a 5.6-fold increase from pH 5.99 to pH 10.02. A similar experiment was performed using Emerald II Enhancer that displayed three peaks in the chemiluminescence emission spectra at 460 nm, 535 nm, and 650 nm (Figure 1C), which can be assigned to the phenolate derived from chemiluminescent decomposition of 1, Emerald II Enhancer, and carboxy-SNARF-1, respectively. Plotting the ratio of chemiluminscence emission at 650 nm and 585 nm shows a 5.7-fold increase from pH 5.99 to pH 10.02 (Figure 1D).
Fig. 1.

The pH dependent (A) emission spectrum and (B) ratio of the chemiluminescence emission intensities at 650 nm and 585 nm of 60 μM 1 and 80 μM carboxy-SNARF-1 in aqueous buffer (pH 5.99–10) containing 6% Sapphire II Enhancer. The pH dependent (C) emission spectrum and (D) ratio of the chemiluminescence emission intensities at 650 nm and 585 nm of 60 μM 1 and 80 μM carboxy-SNARF-1 in aqueous buffer (pH 5.99–10) containing 6% Emerald II Enhancer.
We next confirmed the consistency of the ratiometric signal upon changing other variables. In previous work, we have observed a kinetic decay of the chemiluminescent signal in vivo,21 a factor that complicates precise quantification. In this current system for chemiluminescent pH measurement, a decay of the chemiluminescence emission intensity over time is also observed in vitro using solutions of 1 and carboxy-SNARF-1 in aqueous solutions buffered to pH 7.42 containing 6% Sapphire II Enhancer (Figure 2A). While the overall intensity decreases, analysis of the ratio of chemiluminescence emission at 650 nm and 585 nm reveals a steady signal over 30 minutes at pH 5.99, 7.42, and 8.01 (Figure 2B). Similar results are observed in analogous experiments using Emerald II Enhancer (Figure 2C,D). We also evaluated the consistency of the ratiometric signal with respect to variable probe concentrations. It is often difficult to independently determine probe localization in imaging experiments and increased localization will lead to increased signal, potentially giving false positive results. We evaluated this in vitro by increasing the concentration of 1 when mixed with solutions of carboxy-SNARF-1 and Sapphire II Enhancer (Figure 3A). Increased chemiluminescence emission intensity is observed with increased concentration of the dioxetane 1. The intensity of each peak, however, is increased proportionally such that if the ratio of chemiluminescence emission at 650 nm and 585 nm is plotted versus the concentration of 1, a consistent signal is observed between 20 μM and 100 μM, with a slight upward trend at 200 μM (Figure 3B). Similar results are observed when using the Emerald II Enhancer (Figure 3C,D), but with less noise due to increased chemiluminescence emission at 585 nm.
Fig. 2.
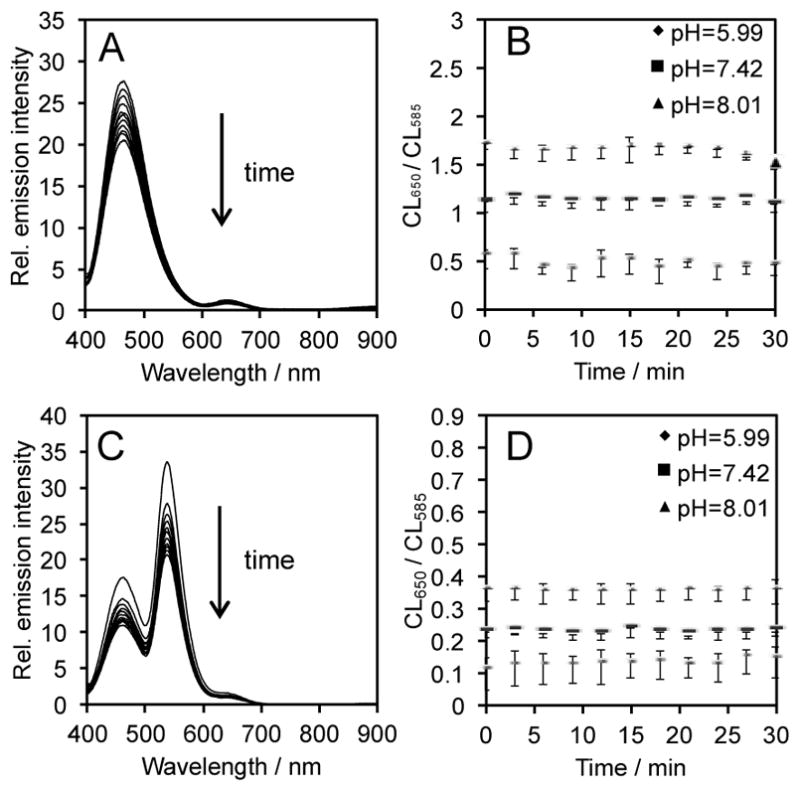
Time dependent (A) emission spectrum at pH 7.42 and (B) ratio of the chemiluminescence emission intensities at 650 nm and 585 nm of 60 μM 1 and 80 μM carboxy-SNARF-1 in aqueous buffers (pH 5.99, 7.42, and 8.01) containing 6% Sapphire II Enhancer. Time dependent (C) emission spectra at pH 7.42 and (D) ratio of the chemiluminescence emission intensities at 650 nm and 585 nm and 60 μM 1 and 80 μM carboxy-SNARF-1 in aqueous buffers (pH 5.99, 7.42, and 8.01) containing 6% Emerald II Enhancer.
Fig. 3.
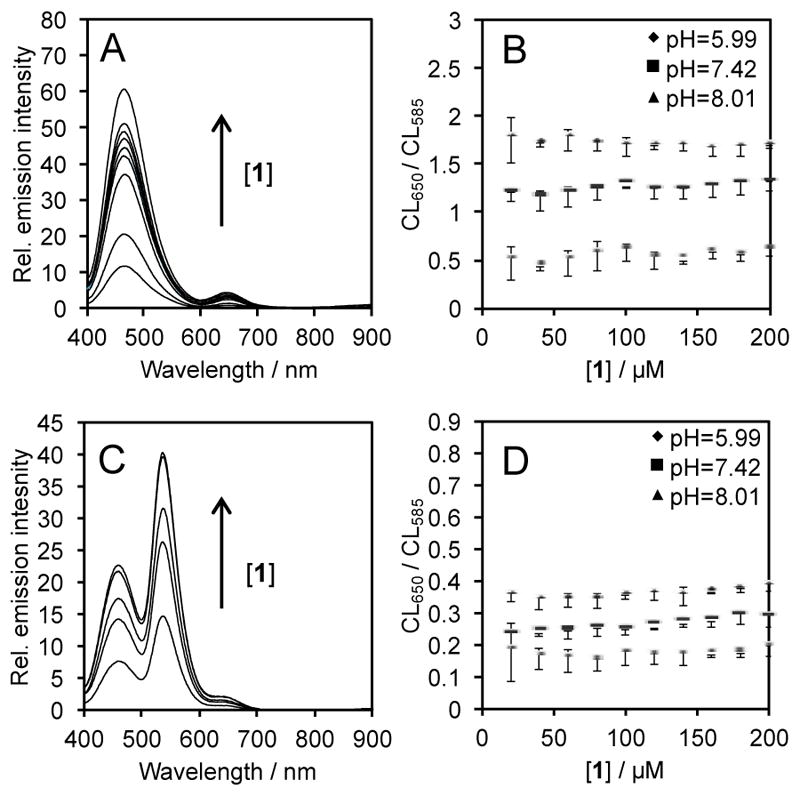
The dependence of chemiluminescence emission on the concentration of 1. (A) Emission spectra at pH 7.42 and (B) ratio of the chemiluminescence emission intensity at 650 nm and 585 nm of 20–200 μM 1 and 80 μM carboxy-SNARF-1 in aqueous buffers (pH 5.99, 7.42, and 8.01) containing 6% Sapphire II Enhancer. (C) Emission spectra at pH 7.42 and (D) ratio of the chemiluminescence emission intensities at 650 nm and 585 nm of 20–200 μM 1 and 80 μM carboxy-SNARF-1 in aqueous buffers (pH 5.99, 7.42, and 8.01) containing 6% Emerald II Enhancer.
Next, the consistency of this ratiometric pH measurement in different environmental conditions, including complicated biological media was interrogated by comparing the ratio of chemiluminescence emission at 650 nm and 585 nm with different volumes of the Enhancer solutions and in the presence and absence of fetal bovine serum (Figure 4). The ratio of the chemiluminescence emission at 650 nm and 585 nm (CL650/CL585) of solutions of 60 μM 1, 80 μM carboxy-SNARF-1, and 6–14% Sapphire II Enhancer (Figure 4A) or Emerald II Enhancer (Figure 4B) was measured. A slight reduction can be seen when increasing the concentration of the Emerald II Enhancer solution (Figure 4B). This decrease in the ratiometric chemiluminescent signal is smaller when using the Sapphire II Enhancer solution (Figure 4A). The attenuation of the ratiometric signal (CL650/CL585) is due to an increase in the emission at 585 nm from the shoulder of the Enhancer solution emissions. This shoulder is more significant for the Emerald II Enhancer solution because the Emerald II Enhancer has a peak emission at 535 nm, which is closer to monitored 585 nm wavelength. The ratio of chemiluminescence emission at 650 nm and 585 nm (CL650/CL585) was also measured in the presence of 10% fetal bovine serum (Figure 4C). No significant change was observed, demonstrating selective chemiluminescent measurement of pH in complex biological fluids.
Fig. 4.
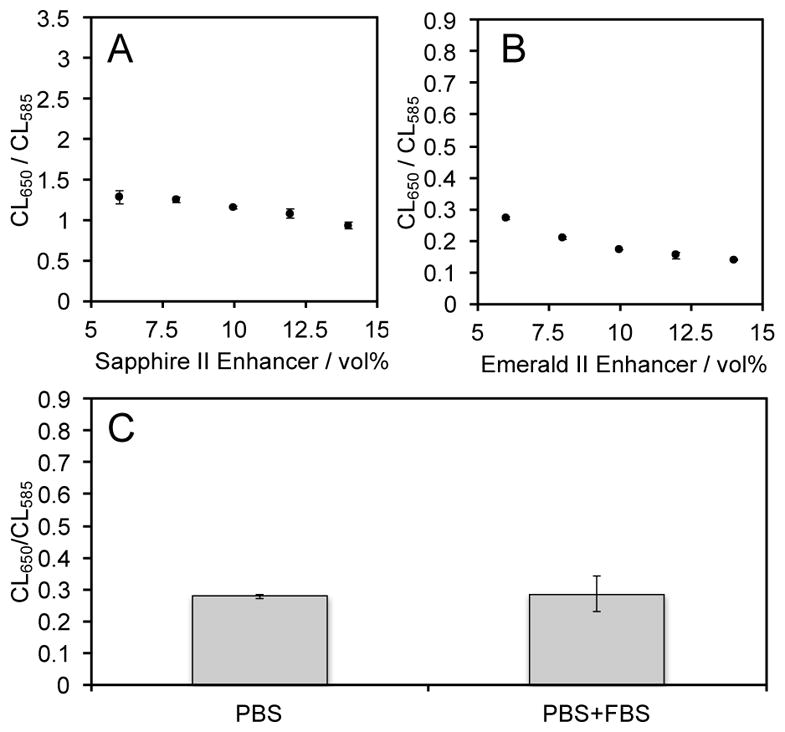
Ratiometric pH measurement in different environments. (A) Ratio of the chemiluminescence emission intensities at 650 nm and 585 nm of 60 μM 1 and 80 μM carboxy-SNARF-1 in pH 7.42 buffers containing 6%–14% Sapphire II Enhancer. (B) Ratio of the chemiluminescence emission intensities at 650 nm and 585 nm of 60 μM 1 and 80 μM carboxy-SNARF-1 in pH 7.42 buffers containing 6%–14% Emerald II Enhancer. (C) Ratio of the chemiluminescence emission intensity at 650 nm and 585 nm of 60 μM 1 and 80 μM carboxy-SNARF-1 in 20 mM PBS buffered to pH 7.4 containing 6% Emerald II Enhancer in the absence and presence of 10% fetal bovine serum (FBS).
Finally, we established the suitability of this system for ratiometric chemiluminescence imaging of pH using an IVIS Spectrum. Images were rapidly acquired using either a 580 nm filter or a 640 nm filter. Carboxy-SNARF-1, 1, and either Sapphire II Enhancer (Figure 5) or Emerald II Enhancer (Figure 6) in aqueous solutions buffered at pH 6, 6.4, 6.8, 7.2, 7.4, 7.6, 7.8, or 8.0. Six replicates of each pH were imaged in a single plate. Short acquisition times of 2 seconds were used to minimize the time between image capture. Generally, light emission increases with increasing pH when using both the 580 nm filter (Figures 5A, 6A) and the 640 nm filter (Figures 5B, 6B). Plotting the ratio of intensities of the two images for a given well results in a pH-dependent curve that shows an increase in the ratiometric signal (CL640/CL580) from 3 to 12 when using the Sapphire II Enhancer (Figure 7A) and from 0.7 to 2.1 when using the Emerald II Enhancer (Figure 7B). These data demonstrate that the pH can be quantified at defined spatial locations using this chemiluminescent system and the described ratiometric imaging protocol.
Fig. 5.
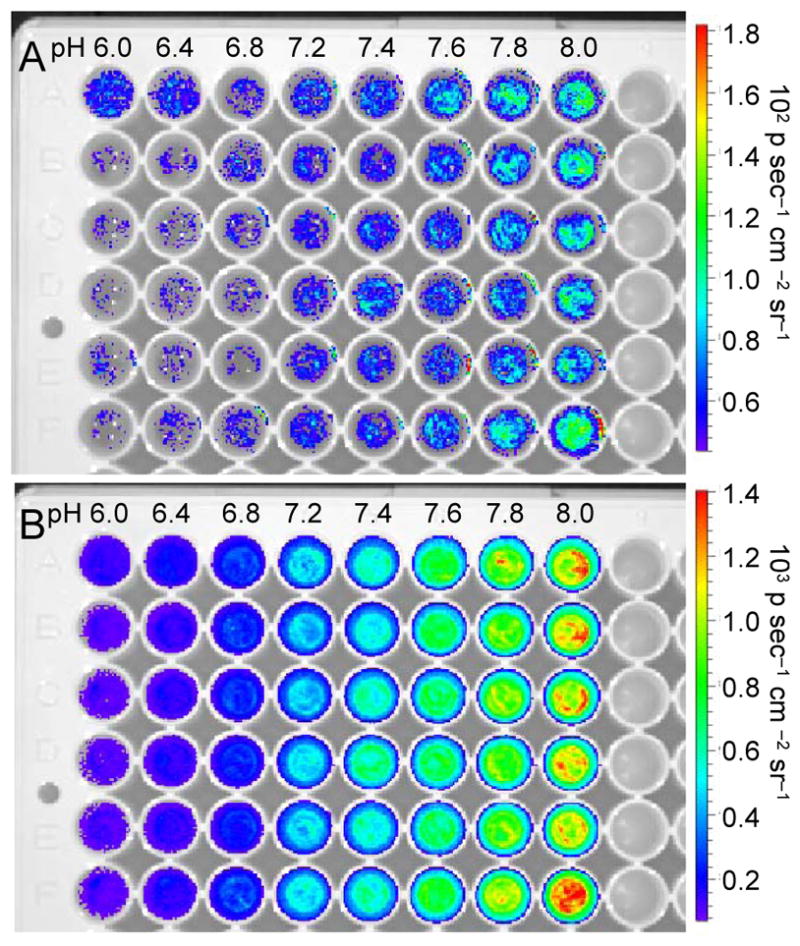
Chemiluminescence images of the pH dependent emission of 30 μM 1 and 40 μM carboxy-SNARF-1 in aqueous buffers (pH 5.99–8.01) containing 6% Sapphire II Enhancer using a (A) 580 nm filter or (B) 640 nm filter in an IVIS Spectrum.
Fig. 6.
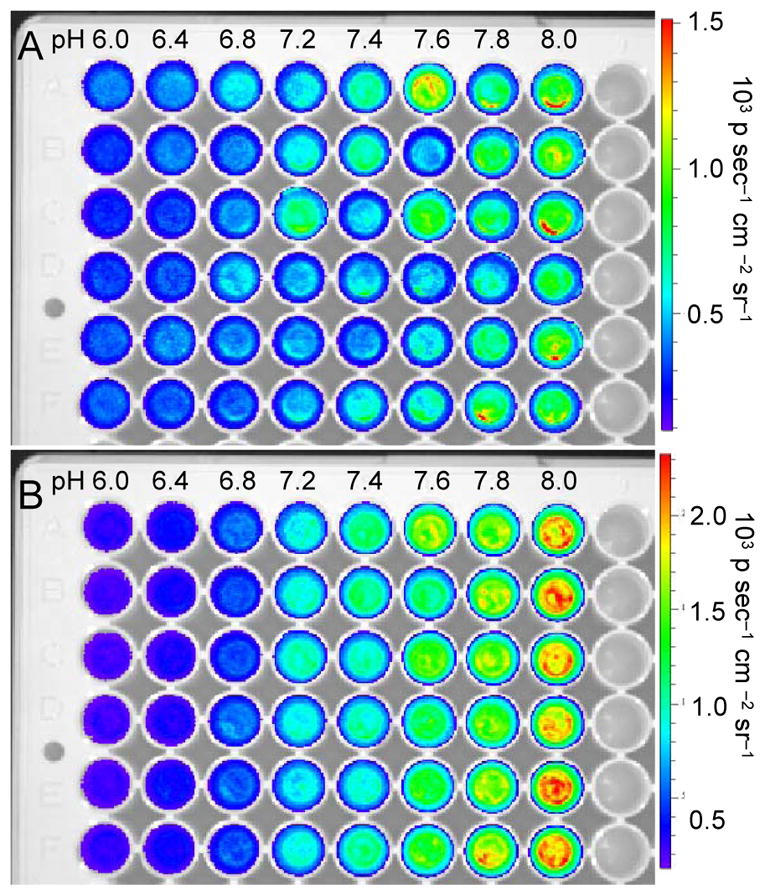
Chemiluminescence images of the pH dependent emission of 30 μM 1 and 40 μM carboxy-SNARF-1 in aqueous buffers (pH 5.99–8.01) containing 6% Emerald II Enhancer using a (A) 580 nm filter or (B) 640 nm filter in an IVIS Spectrum.
Fig. 7.
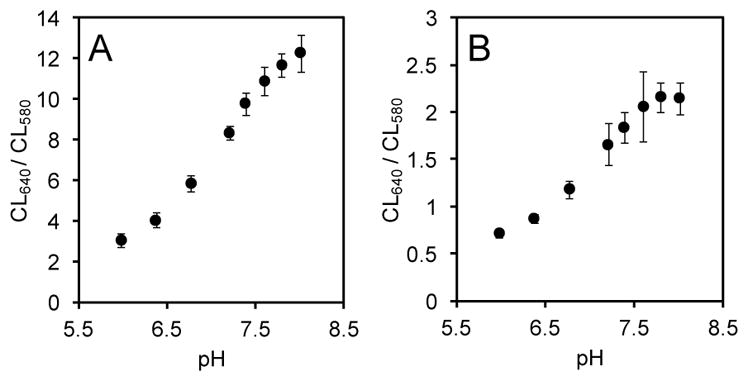
The pH dependent chemiluminescence emission ratio of the emission at 640 nm to 580 nm of 30 μM 1 and 40 μM carboxy-SNARF-1 in aqueous buffers (pH 5.99–8.01) containing (A) 6% Sapphire II Enhancer or (B) 6% Emerald II Enhancer in an IVIS Spectrum.
Conclusions
Herein, we have realized quantitative ratiometric chemiluminescence imaging of pH via the transfer of energy from a chemiluminescent excited state of a phenolate derived from the decomposition of 1 to the ratiometric pH sensitive dye carboxy-SNARF-1. The synthesis and isolation of 1 was of key importance in providing a bright chemiluminescent system to ensure excitation of carboxy-SNARF-1. The system provides a reliable ratiometric response to variable pH and is independent of confounding variables such as time and the concentration of the dioxetane. The system also provides an accurate measurement of pH in the presence of fetal bovine serum, demonstrating operational compatibility with complex biological fluids. Protocols have been established for the quantification of pH using chemiluminescence imaging on an IVIS Spectrum. Due to increased luminescence emission in the range between 585 nm and 650 nm, the system containing the Emerald II Enhancer provides greater signal-to-noise for pH measurement. On the other hand, the system containing the Sapphire II Enhancer provides a higher magnitude change in the ratiometric signal. Some fluctuations are seen when the volumes of the Enhancer solutions are altered, a problem that is more severe in the case of the Emerald II Enhancer. The formulation of systems with stable polymeric encapsulation or covalent linkage of components to ensure consistent stoichiometry could provide solutions to this issue. Nevertheless, quantitative imaging of pH using this ratiometric chemiluminescent system has been achieved. We ultimately anticipate that similar strategies will be compatible with the current library of known ratiometric fluorescent probes to provide a powerful new toolkit for ratiometric chemiluminescence imaging.
Experimental section
General materials and methods
All reactions were performed in dried glassware under an atmosphere of dry N2. Silica gel P60 (SiliCycle) was used for column chromatography and Analytical Chromatography TLC Silica gel 60 F254 (Merck Millipore, Darmstadt, Germany) was used for analytical thin layer chromatography. Plates were visualized by fluorescence quenching under UV light or by staining with iodine. Other reagents were purchased from Sigma-Aldrich (St. Louis, MO), Alfa Aesar (Ward Hill, MA), EMD Millipore (Billerica, MA), and Oakwood Chemical (West Columbia, SC) and used without further purification. Carboxy-SNARF-1 was synthesized according to a literature procedure as a mixture isomers.41 1H NMR and 13C NMR spectra for characterization of new compounds and monitoring reactions were collected in CDCl3 (Cambridge Isotope Laboratories, Cambridge, MA) on a JEOL 500 MHz spectrometer or a Bruker 400 MHz spectrometer in the Department of Chemistry at Southern Methodist University. All chemical shifts are reported in the standard notation of parts per million using the peak of residual proton signals of the deuterated solvent as an internal reference. Coupling constant units are in Hertz (Hz) Splitting patterns are indicated as follows: br, broad; s, singlet; d, doublet; t, triplet; q, quartet; m, multiplet; dd, doublet of doublets; dt, doublet of triplets. High resolution mass spectroscopy was performed on a Shimadzu IT-TOF (ESI source) and low resolution mass spectroscopy was performed on a Shimadzu LCMS-8050 Triple Quadrupole LCMS (ESI source) or a Shimadzu Matrix Assisted Laser Desorption/Ionization MS (MALDI) at the Shimadzu Center for Advanced Analytical Chemistry at the University of Texas, Arlington.
(1r,3r,5R,7S)-2-((4-chloro-3-methoxymethylphenyl) (methoxy)methylene)adamantine (3)
DIPEA (1.00 mL, 5.7 mmol, 1.8 equiv) was added to a solution of compound 2 (954 mg, 3.1 mmol, 1.0 equiv) in 10 mL DCM at room temperature under N2. Then, chloromethoxymethane (0.47 mL, 6.2 mmol, 2.0 equiv) was added dropwise to the solution at 0 °C. After the addition of chloromethoxymethane, the reaction was raised to room temperature and stirred for 2.5 hours. Then, the reaction was quenched with 30 mL saturated aq NH4Cl, extracted with 3 × 30 mL DCM, and concentrated under reduced pressure. Purification by silica column chromatography (1:12 EtOAc/Hexane) yielded compound 3 as a colorless oil (662 mg, 61%). 1H NMR (500 MHz, CDCl3) δ 7.32 (d, 1H, J = 10 Hz), 7.16 (s, 1H), 6.91 (d, 1H, J = 10 Hz), 5.25 (s, 2H), 3.53 (s, 3H), 3.31 (s, 3H), 3.24 (s, 1H), 2.66 (s, 1H), 1.69–1.95 (m, 12H); 13C NMR (125 MHz, CDCl3) δ 152.47, 142.52, 135.29, 132.53, 129.63, 123.69, 122.53, 117.55, 95.35, 57.82, 56.34, 39.07, 38.96, 37.10, 32.29, 31.04, 28.20; HRMS calcd for C20H25ClO3 (M+H+) 349.1565, found 349.1567.
(1r,3r,5r,7r)-4′-(4-chloro-3-(methoxymethoxy)phenyl)-4′-methoxyspiro [adamantane-2,3′-[1,2]dioxetane] (4)
Compound 3 (207.6 mg, 0.6 mmol, 1.0 equiv) and Rose bengal (21.2 mg, 0.02 mmol, 0.03 equiv) were added into a dry two-neck flask and dissolved in 5 mL THF. O2 was bubbled through the solvent while illuminated with a 120W light bulb (Home Depot, Dallas, TX) at 0–5 °C. The reaction was monitored by TLC, and after 4 hours, the mixture was concentrated at 0 °C. Purification by silica column chromatography (1:15 EtOAc/Hexane) delivered compound 4 as a yellow oil (205.6 mg, 91%). 1H NMR (500 MHz, CDCl3), δ 7.01–7.64 (m, 3H, br), 5.28 (m, 2H), 3.49 (s, 3H), 3.20 (s, 3H), 3.01 (s, 1H), 2.12 (s, 1H), 1.45–1.90 (m, 12H); 13C NMR (125 MHz, CDCl3) δ 152.46, 134.64, 129.98, 129.86, 124.87, 122.21, 115.66, 111.45, 95.18, 56.25, 49.82, 38.66, 36.27, 35.43, 33.08, 32.96, 31.71, 31.55, 30.30, 26.08, 25.84. HRMS calcd for C20H25ClO5 (M+H+) 381.1463, found 381.1463.
2-chloro-5-((1r,3r,5r,7r)-4′-methoxyspiro[adamantane-2,3′-[1,2]dioxetan]-4′-yl)phenol (1)
The dioxetane 4 (651.3 mg, 1.7 mmol, 1.0 equiv) was dissolved in 10 mL MeOH at room temperature. para-Toluenesulphonic acid (37.3 mg, 0.2 mmol, 0.1 equiv) was dissolved in 10 mL MeOH at room temperature. Then, the para-toluenesulphonic acid solution was added to the solution of 4 drop by drop. After addition of para-toluenesulphonic acid, the mixture was raised to 65 °C and stirred for 6.5 hours. Then, the mixture was quenched with 50 mL brine and extracted with 3 × 50 mL EtOAc and evaporated under reduced pressure. Purification by silica column chromatography (1:20 EtOAc/Hexane) yielded 1 as a white solid (303 mg, 53%). 1H NMR (500 MHz, CDCl3) δ 7.02–7.53 (m, 3H, br), 5.80 (s, 1H), 3.24 (s, 3H), 3.04 (s, 1H), 2.18 (s, 1H), 1.43–1.83 (m, 12H); 13C NMR (125 MHz, CDCl3) δ 151.30, 135.58, 128.85, 121.20, 111.40, 95.41, 49.92, 47.05, 39.20, 36.32, 34.70, 33.21, 33.09, 32.24, 31.64, 31.49, 25.96, 25.83.
Chemiluminescent measurement of pH
Chemiluminescent responses were acquired with a Hitachi F-7000 Fluorescence Spectrophotometer (Hitachi, Tokyo, Japan) using the luminescence detection mode. The spectrophotometer scan mode was set as wavelength scan with the range of emission wavelength from 400 nm to 900 nm and scan speed was set to 1200 nm/min. Response time was set to 2.0 s. Solutions were prepared using 463 μL of buffers (pH 6–10), 30 μL of Emerald II Enhancer or Sapphire II Enhancer, 4 μL of a 10 mM stock solution of carboxy-SNARF-1 in DMSO (80 μM final concentration) and 3 μL of a 10 mM stock solution of 1 in DMSO (60 μM final concentration) in a quartz cuvette (Starna, Atascadero, CA). The cuvette was shaken gently to assure mixing. Then the cuvette was placed in the spectrophotometer and a wavelength scan was acquired. The procedure was repeated at different time points, concentrations of the dioxetane 1, volumes of the Enhancer solutions, and in the presence of 10% fetal bovine serum as indicated in figure captions.
Ratiometric imaging
Chemiluminescent responses were acquired with an IVIS Spectrum (Caliper, Waltham, MA) using the “Luminescent” and “Photograph” mode. The exposure time was set as 2 seconds, and the binning was set to small. The F/stop was set to 4, and the FOV was set to C, which means the field of view was set to 13 cm. With these settings, images could be acquired with 267 μM spatial resolution. The height of each photograph was 1.5 cm. The excitation was blocked and a sequence was set for the emission mode. The sequence was set as 580 nm, 640 nm, 580 nm, 640 nm, 580 nm and 640 nm. 231.5 μL aliquots of PBS buffers with pH from 5.99–8.01 were added to the wells on the 96-well plate from A1 to A8. Then 2 μL of a 5 mM stock solution of carboxy-SNARF-1 (80 μM final concentration) in DMSO was added to each well followed by the addition of 15 μL Emerald II Enhancer or Sapphire II Enhancer. Then, 1.5 μL of a 5 mM stock solution of 1 in DMSO was added to each well after the adding of the buffer, enhancer and carboxy-SNARF-1. This was repeated in groups A1 to A8 for 6 times on each plate. The sequence described above was then acquired and the images were analyzed using the Living Image software.
Supplementary Material
Acknowledgments
This work was supported by the National Science Foundation CHE 1653474. Imaging was facilitated by the SW-SAIR, a Resource of the Simmons Cancer Center supported in part by NIH P30 1CA142543 and used an IVIS Spectrum, which was purchased under NIH 1S10RR024757. Maciej Kukula (UT Arlington) and Alex Winters (UT Southwestern) are gratefully acknowledged for technical assistance.
Footnotes
Electronic Supplementary Information (ESI) available: Experimental procedures and spectral data. See DOI:10.1039/x0xx00000x
Conflicts of interest
A.R.L discloses a financial stake in Biolum Sciences, LLC.
Notes and references
- 1.Vacher M, Galván IF, Ding BW, Schramm S, Berraud-Pache R, Naumov P, Ferré N, Liu YJ, Navizet I, Roca-Sanjuán D, Baader WJ, Lindh R. Chem Rev. 2018 doi: 10.1021/acs.chemrev.7b00649. [DOI] [PubMed] [Google Scholar]
- 2.Paley MA, Prescher JA. MedChemMed. 2014;5:255. doi: 10.1039/C3MD00288H. [DOI] [PMC free article] [PubMed] [Google Scholar]
- 3.Robards K, Worsfold PJ. Anal Chim Acta. 1992;266:147. [Google Scholar]
- 4.Yeh HW, Karmach O, Ji A, Carter D, Martins-Green MM, Ai HW. Nat Methods. 2017;14:971. doi: 10.1038/nmeth.4400. [DOI] [PMC free article] [PubMed] [Google Scholar]
- 5.Gross S, Gammon ST, Moss BL, Rauch D, Harding J, Heinecke JW, Ratner L, Piwnica-Words D. Nat Med. 2009;15:455. doi: 10.1038/nm.1886. [DOI] [PMC free article] [PubMed] [Google Scholar]
- 6.Quimbar ME, Krenek KM, Lippert AR. Methods. 2016;109:123. doi: 10.1016/j.ymeth.2016.05.017. [DOI] [PMC free article] [PubMed] [Google Scholar]
- 7.Tsunoda M, Imai K. Anal Chim Acta. 2005;541:13. [Google Scholar]
- 8.Goiffron RJ, Martinez SC, Piwnica-Worms D. Nat Commun. 2015:6271. doi: 10.1038/ncomms7271. [DOI] [PMC free article] [PubMed] [Google Scholar]
- 9.Schaap AP, Gagnon SD. J Am Chem Soc. 1982;104:3504. [Google Scholar]
- 10.Matsumoto M, Watanabe N. Bull Chem Soc Jpn. 2005;78:1899. [Google Scholar]
- 11.Ciscato LF, Augusto FA, Weiss D, Bartoloni FH, Bastos EL, Albrecht S, Brandl H, Zimmermann T, Baader WJ. ARKIVOC. 2012;3:391. [Google Scholar]
- 12.Schaap AP, Chen TS, Handley RS, DeSilva R, Giri BP. Tetrahedron Lett. 1987;28:1155. [Google Scholar]
- 13.Koci J, Grandclaude V, Massonneau M, Richard JA, Romieu A, Renard PY. Chem Commun. 2011;47:6713. doi: 10.1039/c1cc11919b. [DOI] [PubMed] [Google Scholar]
- 14.Turan IS, Sozmen F. Sens Actuator B-Chem. 2014;201:13. [Google Scholar]
- 15.Green O, Eilon T, Hananya N, Gutkin S, Bauer CR, Shabat D. ACS Cent Sci. 2017;3:349. doi: 10.1021/acscentsci.7b00058. [DOI] [PMC free article] [PubMed] [Google Scholar]
- 16.Hananya N, Green O, Blau R, Satchi-Fainaro R, Shabat D. Angew Chem Int Edit. 2017;56:11793. doi: 10.1002/anie.201705803. [DOI] [PubMed] [Google Scholar]
- 17.Roth-Konforti M, Bauer C, Shabat D. Angew Chem Int Edit. 2017;129:15839. doi: 10.1002/anie.201709347. [DOI] [PubMed] [Google Scholar]
- 18.Cao J, An W, Reeves AG, Lippert AR. Chem Sci. 2018;9:2552. doi: 10.1039/c7sc05087a. [DOI] [PMC free article] [PubMed] [Google Scholar]
- 19.Liu L, Mason RP. PLoS One. 2010;5:e12024. doi: 10.1371/journal.pone.0012024. [DOI] [PMC free article] [PubMed] [Google Scholar]
- 20.Cao J, Lopez R, Thacker JM, Moon JY, Jiang C, Morris SNS, Bauer JH, Tao P, Mason RP, Lippert AR. Chem Sci. 2015;6:1979. doi: 10.1039/c4sc03516j. [DOI] [PMC free article] [PubMed] [Google Scholar]
- 21.Cao J, Campbell J, Liu L, Mason RP, Lippert AR. Anal Chem. 2016;88:4995. doi: 10.1021/acs.analchem.6b01096. [DOI] [PMC free article] [PubMed] [Google Scholar]
- 22.Hananya N, Boock AE, Bauer CR, Satchi-Fainaro R, Shabat D. J Am Chem Soc. 2016;138:13438. doi: 10.1021/jacs.6b09173. [DOI] [PubMed] [Google Scholar]
- 23.Green O, Gnaim S, Blau R, Eldar-Boock A, Satchi-Fainaro R, Shabat D. J Am Chem Soc. 2017;139:13243. doi: 10.1021/jacs.7b08446. [DOI] [PubMed] [Google Scholar]
- 24.Egawa T, Hanaoka K, Koide Y, Ujita S, Takahashi N, Ikegaya Y, Matsuki N, Terai T, Ueno T, Komatsu T, Nagano T. J Am Chem Soc. 2011;133:14157. doi: 10.1021/ja205809h. [DOI] [PubMed] [Google Scholar]
- 25.Taki M, Wolford JL, O’Halloran TV. J Am Chem Soc. 2004;126:712. doi: 10.1021/ja039073j. [DOI] [PubMed] [Google Scholar]
- 26.Zhang G, Gruskos JJ, Afzal MS, Buccella D. Chem Sci. 2015;6:6841. doi: 10.1039/c5sc02442k. [DOI] [PMC free article] [PubMed] [Google Scholar]
- 27.Zhang G, Jacquemin D, Buccella D. J Phys Chem B. 2017;121:696. doi: 10.1021/acs.jpcb.6b11045. [DOI] [PubMed] [Google Scholar]
- 28.Whitaker JE, Haughland RP, Prendergast FG. Anal Biochem. 1991;194:330. doi: 10.1016/0003-2697(91)90237-n. [DOI] [PubMed] [Google Scholar]
- 29.Doan H, Castillo M, Bejjani M, Nurekeyev Z, Dzyuba SV, Gryczynski I, Raut S. Phys Chem Chem Phys. 2017;9:29934. doi: 10.1039/c7cp05874h. [DOI] [PMC free article] [PubMed] [Google Scholar]
- 30.Hilderbrand SA, Kelly KA, Niedre M, Weissleder R. Bioconjugate Chem. 2008;19:1635. doi: 10.1021/bc800188p. [DOI] [PMC free article] [PubMed] [Google Scholar]
- 31.Han J, Loudet A, Burghardt RC, Burgess K. J Am Chem Soc. 2009;131:1642. doi: 10.1021/ja8073374. [DOI] [PMC free article] [PubMed] [Google Scholar]
- 32.Chen J, Jiang X, Zhang C, MacKenzie KR, Stossi F, Palzkill T, Wang MC, Wang J. ACS Sens. 2017;2:1257. doi: 10.1021/acssensors.7b00425. [DOI] [PMC free article] [PubMed] [Google Scholar]
- 33.Mycohin T, Kiyose K, Hanaoka K, Kojima H, Terai T, Nagano T. J Am Chem Soc. 2011;133:3401. doi: 10.1021/ja1063058. [DOI] [PubMed] [Google Scholar]
- 34.Jiang X, Yu Y, Chen J, Zhao M, Chen H, Song X, Matzuk AJ, Caroll SL, Tan X, Sizovs A, Cheng N, Wang MC, Wang J. ACS Chem Biol. 2015;10:864. doi: 10.1021/cb500986w. [DOI] [PMC free article] [PubMed] [Google Scholar]
- 35.Shi W, Li X, Ma H. Angew Chem Int Edit. 2012;51:6432. doi: 10.1002/anie.201202533. [DOI] [PubMed] [Google Scholar]
- 36.Ando Y, Niwa K, Yamada N, Enomoto T, Irie T, Kubota H, Ohmiya Y, Akiyama H. Nat Photonics. 2008;2:44. [Google Scholar]
- 37.Lippert AR. ACS Cent Sci. 2017;3:269. doi: 10.1021/acscentsci.7b00107. [DOI] [PMC free article] [PubMed] [Google Scholar]
- 38.Ryan LS, Lippert AR. Angew Chem Int Ed. 2018;57:622. doi: 10.1002/anie.201711228. [DOI] [PubMed] [Google Scholar]
- 39.Park JY, Gunpat J, Liu L, Edwards B, Christie A, Xie XJ, Kricka LJ, Mason RP. Luminescence. 2014;29:553. doi: 10.1002/bio.2666. [DOI] [PubMed] [Google Scholar]
- 40.Mason EA, Lopez R, Mason RP. Opt Mater Express. 2016;6:1384. [Google Scholar]
- 41.Srikun D, Albers AE, Chang CJ. Chem Sci. 2011;2:1156–1165. [Google Scholar]
- 42.Haugland RP. Handbook of Fluorescent Probes and Research products. 9. Molecular Probes; Eugene, OR: 2002. pp. 833–834. [Google Scholar]
Associated Data
This section collects any data citations, data availability statements, or supplementary materials included in this article.


