

Abstract
The dehumanization of Black Americans is an ongoing societal problem. Reducing configural face processing, a well-studied aspect of typical face encoding, decreases the activation of human-related concepts to White faces, suggesting that the extent that faces are configurally processed contributes to dehumanization. Because Black individuals are more dehumanized relative to White individuals, the current work examined how configural processing might contribute to their greater dehumanization. Study 1 showed that inverting faces (which reduces configural processing) reduced the activation of human-related concepts toward Black more than White faces. Studies 2a and 2b showed that reducing configural processing affects dehumanization by decreasing trust and increasing homogeneity among Black versus White faces. Studies 3a–d showed that configural processing effects emerge in racial outgroups for whom untrustworthiness may be a more salient group stereotype (i.e., Black, but not Asian, faces). Study 4 provided evidence that these effects are specific to reduced configural processing versus more general perceptual disfluency. Reduced configural processing may thus contribute to the greater dehumanization of Black relative to White individuals.
Keywords: Race, Configural processing, Dehumanization, Trust
1. Introduction
Black Americans have been dehumanized for centuries relative to White Americans (e.g., Cuddy, Rock, & Norton, 2007; Goff, Eberhardt, Williams, & Jackson, 2008; Goff, Jackson, Di Leone, Culotta, & DiTomasso, 2014), and subjected to treatment denying their full personhood (for a review, see Haslam & Loughnan, 2014). Such dehumanization has serious consequences for intergroup interactions. Non-Black Americans reliably report Blacks as “less evolved” than other racial groups (Kteily, Bruneau, Waytz, & Cotterill, 2015). White Americans associate Blacks with apes (Goff et al., 2008) and see Blacks as lacking trustworthiness (Stephan et al., 2002), a trait uniquely associated with humans (Wilson, Young, Rule, & Hugenberg, 2017). Dehumanizing Black individuals influences social behaviors and judgments. For example, dehumanizing beliefs about Blacks predicts increased condoning of police violence directed at Black suspects (Goff et al., 2008) even when a suspect is a child (Goff et al., 2014). Understanding the mechanisms by which Black individuals are dehumanized is therefore an important issue.
The present work focuses on how face processing may contribute to the dehumanization of Black individuals. How faces are processed may play an important role in activating basic concepts related to humanness, and in judging if faces have humanlike faculties (Deska, Almaraz, & Hugenberg, 2016; Fincher & Tetlock, 2016; Hugenberg et al., 2016). Further, people attend to and encode the features of ingroup and outgroup faces differently, with these differences corresponding to race-biased behaviors. For instance, differences in how White perceivers scan Black versus White faces predict biases characteristic of dehumanization, such as less willingness to interact with Black individuals (Kawakami et al., 2014). The current work tested the hypothesis that how faces are encoded may affect the extent to which Black versus White individuals are dehumanized. We begin by discussing how reducing configural face processing, which is a type of face specific encoding, may trigger dehumanization. We then discuss how the dehumanizing effects of reduced configural processing may vary by target race.
2. Configural face processing triggers humanness
Most stimuli are processed via a piecemeal integration of their features. By contrast, people often process the faces of ingroup members as an integrated Gestalt (Farah, Wilson, Drain, & Tanaka, 1998) referred to as configural processing (see Maurer, Le Grand, & Mondloch, 2002 for a review). A widely-used manipulation of configural processing is face inversion (Yin, 1969).1 Disrupting the configural processing of faces (i.e., the regular eyes-over-nose-over-mouth configuration) is associated with more dehumanization of inverted versus upright faces. For example, Hugenberg et al. (2016) found that inverting a human face disrupted the tendency for faces to activate human-related concepts, disrupted the categorization of the face as human, and reduced ascriptions of human-related traits. Exemplifying the effects of such “perceptual dehumanization,” faces that are not afforded configural processing become easier to treat in less humane ways (Fincher & Tetlock, 2016).
Past perceptual dehumanization work has focused exclusively on perceivers viewing White faces. Although holding race constant has been important to link configural processing with humanness, it remains unknown if disrupting configural processing differentially affects the dehumanization of racial outgroup faces. The present work addressed this question by testing how target race impacts the association between configural face processing and dehumanization.
3. Configural processing and target race
How and why might race affect the interface between configural face processing and dehumanization? Two hypotheses are plausible based on extant work. First, although Black faces would be expected to be broadly dehumanized by White perceivers (e.g., Goff et al., 2008), disrupting configural processing could trigger dehumanization more strongly for White versus Black faces. This hypothesis stems from findings suggesting that configural face processing may occur more strongly for ingroup versus outgroup member faces (Hugenberg & Corneille, 2009; Michel, Corneille, & Rossion, 2007; Michel, Rossion, Han, Chung, & Caldara, 2006). If White perceivers configurally process White faces more strongly than Black faces, then reducing configural processing may affect the dehumanization of White more than Black faces.
Second, disrupting configural processing may intensify the dehumanization of outgroup Black versus White faces. This hypothesis stems from work showing that outgroup faces may be processed configurally, but that the integration of facial features occurs less efficiently relative to ingroup faces (Wiese, Stahl, & Schweinberger, 2009). If true, ingroup and outgroup face processing may differ in a more quantitative versus qualitative way. Configurally processing upright faces should signal humanness for both White and outgroup Black faces. The signal of humanness stemming from configural processing may, however, be important to forestall the broader dehumanization of Blacks.
If configural processing signals humanity, reducing it may allow salient and pre-existing dehumanizing associations with Black faces (e.g., that they are less human and lack humanity-defining traits like trustworthiness) to intensify their dehumanization relative to White faces. Indeed, regardless of prejudice level, people are equally knowledgeable of cultural stereotypes and automatically activate stereotypes in the presence of group members (Devine, 1989). Removing the humanness signal afforded by configural processing should affect White faces less, as they are not subject to such dehumanizing stereotypes. Without this signal, perhaps the most pernicious dehumanizing treatment of Blacks will emerge.
4. The current work
By examining how target race affects the interface between configural processing and dehumanization, the present work fills a gap in literature useful in understanding the pervasive dehumanization of American Blacks. This work also clarifies the extent to which disrupting configural processing plays a role in triggering dehumanization across racial lines, another important lacuna in the literature. The present work examined dehumanization defined by the activation of human-related concepts (as tested in past work using White faces; Hugenberg et al., 2016) and by analyses of the trustworthiness ascribed to faces.
Assessing trustworthiness ascriptions is important because decreased trust characterizes impressions of dehumanized outgroup members (Vezzali, Capozza, Stathi, & Giovannini, 2012). Trustworthiness is a core dimension of face evaluation (Oosterhof & Todorov, 2008) underlying the motives driving if and how people interact with others (Slepian, Young, & Harmon-Jones, 2017; Todorov, 2008). Trustworthiness impressions are made without intention (Rule, Krendl, Ivcevic, & Ambady, 2013) and are negatively affected if a face is Black versus White (Cassidy & Krendl, 2016; Kubota, Li, Bar-David, Banaji, & Phelps, 2013). Unlike other aspects of face evaluation (e.g., dominance), trustworthiness is uniquely associated with humanness (Wilson et al., 2017). Because people spontaneously evaluate the trustworthiness of faces, less trustworthiness being ascribed to Black faces may arise, in part, due to reduced configural face processing.
The current work investigated if and how disrupting configural processing impacts the dehumanization of Black and White faces. Study 1 tested if face inversion elicits differential activation of human-related concepts for Black and White faces. Studies 2–4 tested if race effects were paralleled in other correlates of dehumanization. Studies 2a and 2b tested how configural processing affected perceived trustworthiness in Black and White faces, and also how homogeneously these faces were perceived (as homogeneity is characteristic of dehumanization; see Kteily et al., 2015). Studies 3a–d assessed if the trustworthiness effects observed in Studies 2a and 2b were unique to Black faces, or generalized to Asian faces. Study 4 examined configural face processing as a mechanism underlying race disparity in perceived trustworthiness. All measures, manipulations, and exclusions are reported.
5. Study 1
Reducing the configural processing of White faces slows the activation of human-related concepts (Hugenberg et al., 2016). Using face inversion, Study 1 extended this work by establishing if configural processing contributes differentially to the dehumanization of Black versus White targets.
One hypothesis, drawing from the idea that configural processing may be reserved for ingroup faces (e.g., Michel et al., 2006), was that reducing configural processing would only disrupt a signal of humanness for White faces. If Black faces are not configurally processed, then reducing configural processing should not affect how they activate human-related concepts. A competing hypothesis drew from work suggesting that racial outgroups do receive configural processing (Wiese et al., 2009), and that this signal of humanness may buffer more pernicious effects of dehumanizing stereotypes. If true, inverted versus upright Black faces should slow the activation of human-related concepts more than inverted versus upright White faces.
We adapted the procedure of Hugenberg et al.’ (2016) Study 1 (see also Deska et al., 2016) to test these hypotheses. Participants completed a lexical decision task (LDT) measuring the activation of human-related concepts. Each trial was preceded by a prime: an upright or an inverted White or Black face. Inverting White faces slows the activation of human-related concepts. Of interest was if stronger or weaker effects emerged for Black faces.
5.1. Method
5.1.1. Participants
Power analyses (PANGEA; for details see www.jakewestfall.org/pangea/) using r = 0.15 (d = 0.30; a modest effect was expected based on past LDTs; Hugenberg et al., 2016) and alpha = 0.05 targeted 86 participants for 80% power to detect a Word Type × Face Orientation × Target Race interaction. 102 Indiana University undergraduates participated for course credit to ensure a sufficient sample size when taking exclusion criteria into account (i.e., low accuracy and identifying as Black). Data from six Black participants, one participant who was talking on a cell phone, and five participants who had accuracy below 75% were excluded. Because the task was simple and yielded high accuracy (see below), below 75% accuracy is very poor performance. Low performing participants were excluded because their accuracy suggests that they may not have attended to the task. These exclusions yielded an analyzed sample of 90 participants, which yielded 81.90% power to detect a Word Type × Face Orientation × Target Race interaction. Eighty of the 90 participants identified as White (although all were non-Black). All results were unchanged when restricted to the White participants. Likewise, all results were unchanged when including non-Black participants regardless of LDT accuracy.
5.1.2. Stimuli and procedure
Ten color images of young adult, neutrally expressive male faces (five Black and five White available via Direct RT software) were presented either upright or inverted as primes. Twelve words (six human-related: human, person, individual, soul,2 personality, people; six machine-related: machine, computer, robot, device, engine, locomotive) pretested by Hugenberg et al. (2016) as highly human- and machine-related, respectively, served as stimuli. Pre-testing (for details, see Hugenberg et al., 2016) indicated that human-related words were more human-related than machine-related words. Twelve pronounceable non-words were also used (afes, bemeraastanem, esorme, frar, gregen, herigis, prisruos, rediop, sedesan, somcosspa, splarsul, tementre). An ANOVA yielded no differences in the length of human-related words (M = 7.00, SD = 2.83), machine-related words (M = 7.00, SD = 1.79), and non-words (M = 7.25, SD = 2.45), F(2, 21) = 0.03, p = 0.97, ηp2 < 0.01.
Adapted from past work (see Hugenberg et al., 2016), participants completed a 192-trial LDT in which a sequential priming task was embedded. Because this study replicated past work, it serves as validation for this paradigm. Trials consisted of fixation (1000 ms) followed by a face prime (100 ms), and then a letter string until participants responded. Participants indicated whether letter strings were words or non-words as quickly and accurately as possible via keystroke. There were 96 word and 96 non-word trials. For word trials, half were human-related and half machine-related. Upright and inverted Black and White face primes were equally distributed within the word and non-word trials, totaling 192 trials in the LDT.
5.2. Results
Participants had high accuracy (M = 94.70%, SD = 13.01%). As is typical in LDT analyses, reaction times (RTs) for incorrect trials or RTs that were faster than 300 ms or slower than 2000 ms were excluded, removing 4.01% of trials. RTs below 300 ms do not reflect responses to target stimuli (Fazio, Sanbonmatsu, Powell, & Kardes, 1986). Trials with RTs slower than 2000 ms were eliminated because these responses were not considered spontaneous. To assess normality, 192 RTs reflecting the average RT for each trial across participants were analyzed. The Kolmogorov-Smirnov test revealed this data to be normally distributed, D = 0.056, p = 0.20. The RTs (ms) were then averaged into means at each of the levels of the Word Type × Face Orientation × Target Race design.
These means were entered into a 3 (Word Type: human, machine, non-word) × 2 (Face Orientation: upright, inverted) × 2 (Target Race: Black, White) repeated-measures ANOVA. The ANOVA yielded a main effect of Word Type, F(2, 178) = 64.69, p < 0.001, ηp2 = 0.42, a main effect of Face Orientation, F(1, 89) = 17.82, p < 0.001, ηp2 = 0.17, a main effect of Target Race, F(1, 89) = 6.88, p = 0.01, ηp2 = 0.07, and a Word Type × Face Orientation interaction, F(2, 178) = 3.84, p = 0.02, ηp2 = 0.04. Qualifying these effects was the predicted three-way interaction of Word Type, Face Orientation, and Target Race, F(2, 178) = 3.62, p = 0.03, ηp2 = 0.04 (Fig. 1; see Table 1 for descriptive statistics).
Fig. 1.
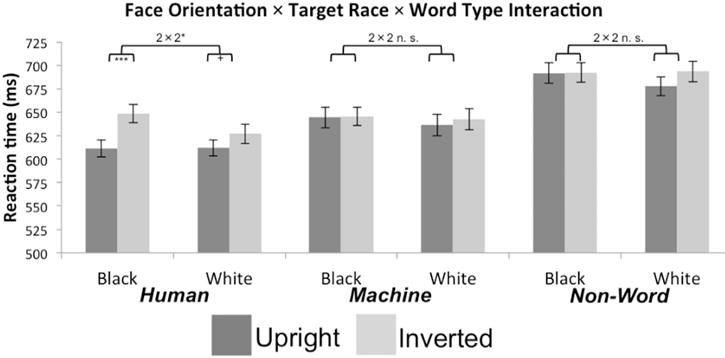
A Face Orientation × Target Race × Word Type interaction emerged in Study 1. Reducing configural processing slowed responding to human-related concepts more for Black versus White faces. This pattern did not emerge for machine-related words or non-words. + = p = 0.06, * = p < 0.05, *** = p < 0.001; error bars represent SEM.
Table 1.
Mean (standard deviation) response times (ms) for Study 1.
| Word type | Black
|
White
|
||
|---|---|---|---|---|
| Upright | Inverted | Upright | Inverted | |
| Human | 611.55 (87.65) |
648.67 (94.27) |
611.95 (81.62) |
626.95 (98.70) |
| Machine | 644.35 (106.18) |
645.61 (92.78) |
636.36 (108.71) |
642.33 (104.76) |
| Non-word | 691.57 (104.40) |
692.52 (100.07) |
677.58 (94.87) |
693.49 (105.62) |
Decomposing this interaction by Word Type revealed a Face Orientation × Target Race interaction for human-related words, F(1, 89) = 4.10, p = 0.046, ηp2 = 0.044. Like past work (Hugenberg et al., 2016), inverted versus upright White faces marginally inhibited responses to human-related words, F(1, 89) = 3.53, p = 0.06, ηp2 = 0.04. A stronger pattern was observed for Black faces, F(1, 89) = 15.52, p < 0.001, ηp2 = 0.15. Put another way, whereas upright Black and White faces similarly facilitated responses to human-related words, F(1, 89) = 0.005, p = 0.95, ηp2 < 0.01, inverted Black versus White faces slowed responding to human-related words, F(1, 89) = 5.96, p = 0.02, ηp2 = 0.06.
Interactions of Face Orientation and Word Type did not emerge for machine-related words, F(1, 89) = 0.61, p = 0.44, ηp2 = 0.01, or non-words, F(1, 89) = 3.23, p = 0.08, ηp2 = 0.04. There was no Target Race × Word Type interaction, F(2, 178) = 0.23, p = 0.79, ηp2 < 0.01, and no Face Orientation × Target Race interaction, F(1, 89) = 0.02, p = 0.90, ηp2 < 0.01.
5.3. Discussion
Study 1 tested for two potential effects of face inversion on the activation of human-related concepts primed by outgroup Black faces. The second hypothesized effect – that reducing configural processing for Black faces would especially slow the activation of human-related concepts – was supported. The data replicated work showing that configural processing triggers human-related concepts (Deska et al., 2016; Hugenberg et al., 2016). Extending this work, the extent of this effect depended on the race of the prime. Inverted versus upright Black relative to White primes showed less response facilitation for human-related words. This pattern was specific to human-related words. Inverted or Black primes were not merely more distracting than upright or White primes, which would have elicited a main effect of Face Orientation.
The LDT used here is different from oft-used tasks in dehumanization work. Instead of measuring social inferences or intentions, Study 1 used an up-stream measure of concept activation. Here, upright Black and White faces similarly facilitated responding for human-related words. This pattern diverges from work suggesting that outgroup members are broadly dehumanized (Boccato, Capozza, Ralvo, & Durante, 2008). Faces with humanlike configurations may broadly activate social cognition early in the processing stream (Wheatley et al., 2011), which may account for the lack of differential dehumanization for the upright Black and White faces given the speeded nature of the task.
Studies 2a and 2b measured dehumanization via down-stream judgments more typical of the dehumanization literature. Specifically, Studies 2a and 2b tested how manipulating configural processing affected the ascription of a trait associated with humanness (i.e., trustworthiness) and the perceived homogeneity of faces by target race.
6. Study 2a
Study 2a had two goals. First, Study 2a sought to conceptually replicate the finding in Study 1 that disrupting configural processing increases dehumanization more for Black versus White faces. Second, it tested for this pattern in judgments about the faces themselves. Study 2a tested if disrupting the configural processing of White and Black faces affected ascriptions of trustworthiness and also perceived homogeneity, two characteristics of dehumanization (Bastian, Laham, Wilson, Haslam, & Koval, 2011; Kteily et al., 2015; Vezzali et al., 2012).
Dehumanized group members are often characterized as untrustworthy (Vezzali et al., 2012), a trait shown to be associated with humanity (Wilson et al., 2017). Dehumanized group members are also perceived to be homogeneous with regard to different traits. Indeed, from Nussbaum’s (1999) ‘fungibility’ to Haslam’s (2006) ‘human uniqueness,’ group members who are dehumanized are seen as interchangeable. Study 1 showed that reduced configural processing slows the activation of human-related concepts for Black more than White faces. If this effect extends to dehumanizing judgments, inversion should reduce the trustworthiness and increase the homogeneity of Black faces more than of White faces.
6.1. Method
6.1.1. Participants
Power analyses using r = 0.33 (d = 0.70; a strong effect was expected on the basis of related work on face typical processing and dehumanization; Fincher & Tetlock, 2016) and alpha = 0.05 targeted 31 participants for 80% power to detect a Face Orientation × Target Race interaction on trustworthiness ratings. Fifty-one Indiana University undergraduates participated for course credit to ensure a sufficient sample size when taking exclusion criteria into account (i.e., identifying as Black, indicating that task instructions had not been followed, and making the same response to most or all faces). Data from two participants who verbally suggested that they had not followed task instructions and from four Black participants were excluded, yielding an analyzed sample of 45 participants that reflected 92.80% power to detect a Face Orientation × Target Race interaction. Thirty-eight of 45 participants identified as White. All results were unchanged when restricted to the White participants. Further, all results were unchanged when including the two participants who suggested that they had not followed task instructions.
6.1.2. Stimuli and procedure
120 grayscale images of neutrally expressive adult male faces (60 Black; 60 White) were drawn from the Eberhardt Lab Face Database (http://web.stanford.edu/group/mcslab/cgi-bin/wordpress/). Half of the Black and White faces were presented upright, and half inverted.3 The faces viewed as upright or inverted were counterbalanced. Upright and inverted faces of each race were presented in a randomized order in a within-subjects design. Participants were instructed to use gut impressions to rate trustworthiness on a 7-point scale (1 = not at all trustworthy to 7 = very trustworthy). Trials consisted of 1000 ms face presentations followed by self-paced ratings, with 500 ms intervals between trials. After the task, participants completed several questionnaires included on an exploratory basis (for details and exploratory analyses, see Supplemental materials). One participant’s questionnaire data were not collected.
6.2. Results
6.2.1. Trustworthiness
The ratings for the faces were averaged and were entered into a 2 (Face Orientation: upright, inverted) × 2 (Target Race: Black, White) repeated-measures ANOVA. In addition to a main effect of Face Orientation, F(1, 44) = 6.28, p = 0.02, ηp2 = 0.13, and a main effect of Target Race, F(1, 44) = 21.08, p < 0.001, ηp2 = 0.32, the predicted Face Orientation × Target Race interaction emerged, F(1, 44) = 9.67, p = 0.003, ηp2 = 0.18 (Fig. 2a). Upright White (M = 3.93, SD = 0.68) and inverted White (M = 3.92, SD = 0.74) faces were perceived as similarly trustworthy, F(1, 44) = 0.01, p = 0.94, ηp2 < 0.01. Inverted Black faces (M = 3.31, SD = 0.92) were perceived as less trustworthy than upright Black faces (M = 3.58, SD = 0.87), F(1, 44) = 16.40, p < 0.001, ηp2 = 0.27.
Fig. 2.
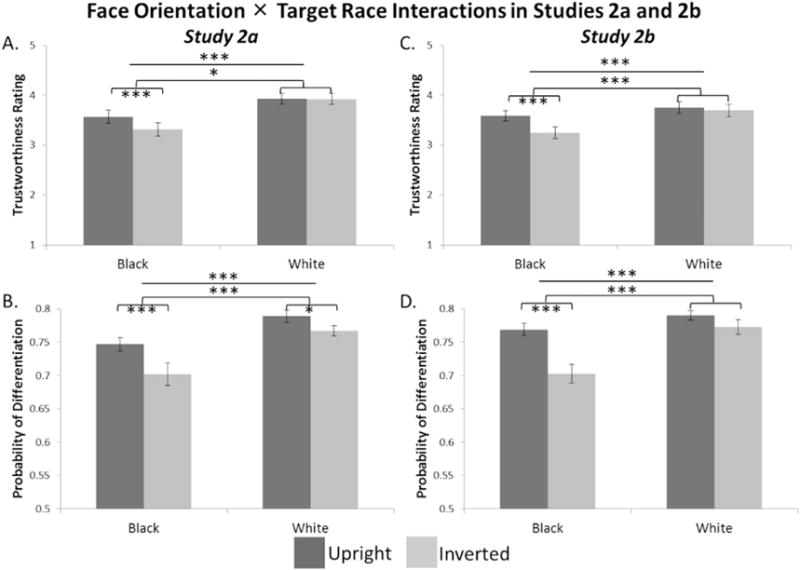
In Study 2a, disrupting configural processing reduced the trust perceived in Black faces, but not White faces (A), and reduced the probability of distinguishing between Black more than White faces in how trustworthy they were perceived to be, reflecting greater homogeneity (B). Study 2b replicated these interactions in perceived trustworthiness (C) and in homogeneity (D). * = p < 0.05, *** = p < 0.001; error bars represent SEM. Note that given the within-subjects design, error bars represent variability in ratings and PD across participants.
6.2.2. Homogeneity
People have perceived distributions of traits within different groups (Kahneman & Miller, 1986). The variability of this trait distribution is smaller for outgroup members (Jones, Wood, & Quattrone, 1981), reflecting more homogeneity. Because homogeneity suggests that group members are not perceived as distinct (Park & Rothbart, 1982), the extent to which trait evaluations vary among group members provides a metric on which to assess homogeneity. If perceivers have less differentiation in their trustworthiness ratings of Black (versus White) individuals, it would suggest that they view these Black faces to be more homogeneous. We examined trustworthiness homogeneity to test if manipulating configural processing affected perceived homogeneity differently based on target race.
The distribution of trustworthiness ratings on the 7-point scale was used to calculate trustworthiness homogeneity separately for Black and White faces. Specifically, the probability of differentiation (PD) was calculated for Black and White faces, where, i is the rating on the scale and P is the proportion of ratings at the nth rating (Linville, Fischer, & Salovey, 1989):
Here, PD reflects the probability of distinguishing between two category members on trustworthiness (i.e., that two randomly chosen group members will be perceived to be different with regard to trustworthiness). Illustrating this concept, when asked to distribute 100 older or 100 younger targets over seven levels of an attribute (e.g., friendly), younger adults show more homogeneity (i.e., lower PD values) in their assignment of outgroup older versus ingroup younger targets across these seven levels (Linville et al., 1989). Here, PD will be largest when each trustworthiness rating is equally likely to be selected by a perceiver. Lower PD values suggest more homogeneity with regard to trustworthiness, with a PD of 0 occurring with a 0% chance that a perceiver will distinguish between two group members on trustworthiness ratings. Each participant had four PD values across Black and White upright and inverted faces. The four PD values for each participant were entered into a 2 (Face Orientation: upright, inverted) × 2 (Target Race: Black, White) repeated-measures ANOVA.
In addition to a main effect of Face Orientation, F(1, 44) = 21.52, p < 0.001, ηp2 = 0.33, and a main effect of Target Race, F(1, 44) = 18.03, p < 0.001, ηp2 = 0.29, the Face Orientation × Target Race interaction was marginally significant, F(1, 44) = 3.49, p = 0.07, ηp2 = 0.07 (Fig. 2b). Upright White faces (M = 0.79, SD = 0.06) were differentiated more than were inverted White faces (M = 0.77, SD = 0.05), F(1, 44) = 9.25, p = 0.004, ηp2 = 0.17. This pattern was exacerbated for upright (M = 0.75, SD = 0.06) versus inverted (M = 0.70, SD = 0.12) Black faces, F(1, 44) = 14.81, p < 0.001, ηp2 = 0.25.
6.3. Discussion
Study 1 showed that reduced configural face processing of Black versus White faces slowed the activation of human-related concepts. Study 2a conceptually replicated Study 1 by showing similar patterns in the trustworthiness and homogeneity of faces, two characteristics of dehumanization. Study 2a showed that disrupting configural processing by inverting Black faces reduced their perceived trustworthiness and increased their perceived homogeneity to a greater extent than White faces. Although not the intent of these studies, these findings suggest that, at least in the current procedure, non-Black participants configurally processed Black faces. Because disrupted configural processing affected Black over White faces, configural processing may potentially be a more potent signal of humanity for people more likely to be dehumanized.
That disrupting configural processing for Black versus White faces exacerbated their perceived untrustworthiness suggests that untrustworthiness is a more salient dehumanizing stereotype for Black than White targets. Supporting this idea, even upright Black versus White faces were perceived to be less trustworthy (F(1, 44) = 9.03, p = 0.004, ηp2 = 0.17). This effect differs from Study 1, where responses to human-related words were similar with Black and White upright face primes. These differences may stem from untrustworthiness being explicitly evaluated, as it is a dehumanizing stereotype of Black faces (Stephan et al., 2002).
Disrupting configural processing also led Black versus White faces to be perceived as more homogeneous. People perceive outgroups more homogeneously than ingroups (Linville et al., 1989), particularly with regard to trustworthiness (Cassidy & Krendl, 2016). Providing more support for the idea that configural processing may serve as a more potent signal of humanity for Black versus White faces, the most homogeneity emerged for inverted Black faces. The most dehumanized individuals may also be perceived as the most homogeneous (e.g., Kteily et al., 2015), as shown here. Reducing configural processing led both Black and White faces to be more homogeneously rated on trustworthiness, although this pattern was stronger for Black faces. That inversion led White faces to be homogeneously rated on trustworthiness is a critical point because it reflects dehumanization despite similar trustworthiness ratings of upright and inverted White faces. Speculatively, if untrustworthiness is a more salient dehumanizing stereotype for Black versus White faces, inversion may not lower ratings for White faces because the stereotype of untrustworthiness may be less likely to be applied, particularly given the nature of the ratings task. Rather, dehumanization may emerge in more subtle ways, such as the degree to which faces are perceived from one another with regard to trustworthiness as shown here.
Moreover, that the homogeneity of inverted Black faces was well above a floor effect (i.e., PD was well above 0) means that reducing configural processing did not render these faces being perceived as equivalent. Rather, it may simply lower the probability that Black faces will be perceived differently with regard to their trustworthiness. Speculatively, homogeneity may reinforce tendencies to rate a group in a stereotypic way. Study 2b replicated Study 2a to show that the observed effects, and particularly the marginal homogeneity interaction, were replicable.
7. Study 2b
7.1. Method
A limitation of Study 2a was the marginal Face Orientation × Target Race interaction on homogeneity. Study 2b replicated Study 2a to ensure the validity of this interaction. Because Study 2b was intended as a replication of Study 2a, power analyses were the same as in Study 2a. Thirty-eight Indiana University undergraduates participated to ensure the recruitment of a sufficient number of White participants when taking exclusion criteria (see Study 2a) into account. Data from two participants who verbally suggested they had not followed instructions and of four Black participants were excluded, yielding an analyzed sample of 32 participants, reflecting 81.60% power to detect a Face Orientation × Target Race interaction. Thirty-one participants identified as White, and all results were unchanged when restricted to these participants. Further, all results were unchanged when including the two participants who suggested that they had not followed task instructions.
Stimuli and procedure replicated Study 2a with one difference. Participants had three-second response windows for their trustworthiness ratings to elicit relatively spontaneous responses and ensure attention to the task.
7.2. Results
7.2.1. Trustworthiness
All Study 2a results were replicated in a 2 (Face Orientation: up right, inverted) × 2 (Target Race: Black, White) repeated-measures ANOVA on trustworthiness ratings. In addition to a main effect of Face Orientation, F(1, 31) = 5.91, p = 0.02, ηp2 = 0.16, and a main effect of Target Race, F(1, 31) = 5.02, p = 0.03, ηp2 = 0.14, a Face Orientation × Race interaction emerged, F(1, 31) = 10.45, p = 0.003, ηp2 = 0.25 (Fig. 2c). Upright (M = 3.76, SD = 0.67) and inverted (M = 3.70, SD = 0.70) White faces were perceived as similarly trustworthy, F(1, 31) = 0.29, p = 0.59, ηp2 = 0.01. Inverted (M = 3.25, SD = 0.65) versus upright (M = 3.59, SD = 0.59), Black faces were perceived as less trustworthy F(1, 31) = 17.12, p < 0.001, ηp2 = 0.36.
7.2.2. Homogeneity
All Study 2a effects replicated when entering PD values into a 2 (Face Orientation: upright, inverted) × 2 (Target Race: Black, White) repeated-measures ANOVA. Beyond main effects of Face Orientation, F(1, 31) = 26.94, p < 0.001, ηp2 = 0.47, and Target Race, F(1, 31) = 18.03, p < 0.001, ηp2 = 0.29, a Face Orientation × Race interaction emerged (Fig. 2d), F(1, 31) = 8.58, p = 0.01, ηp2 = 0.22. Upright (M = 0.79, SD = 0.04) and inverted (M = 0.77, SD = 0.06) White faces were similarly differentiated, F(1, 31) = 2.65, p = 0.11, ηp2 = 0.08. Upright (M = 0.77, SD = 0.05) versus inverted (M = 0.70, SD = 0.08) Black faces were more differentiated, F(1, 31) = 26.94, p < 0.001, ηp2 = 0.47.
7.3. Discussion
Study 2b replicated Study 2a. Disrupting configural processing elicited more homogeneity among Black versus White faces. Studies 2a and 2b were also consistent with Study 1. Disrupting configural processing triggered dehumanization (i.e., less perceived trustworthiness and more homogeneity) for Black more than for White faces. Inverting faces prohibits the extraction of individuated person information but not of category information (Cloutier & Macrae, 2007; Cloutier, Mason, & Macrae, 2005), which may contribute to dehumanization. Likewise, the ability to detect category features like race increases the accessibility of related knowledge structures (Mason, Cloutier, & Macrae, 2006).
A possible explanation for the effects shown in Studies 2a and 2b is that category stereotypes may have become more salient when configural processing was disrupted. That is, the category of Black and its associated stereotypes may have been more salient when faces were inverted versus upright. These stereotypes may also have been salient for upright faces, causing Black faces to be broadly perceived as less trustworthy and more homogeneous than White faces. Inversion may thus affect perceived trustworthiness more if untrustworthiness is a salient category stereotype for a particular racial outgroup. Inversion effects could also be characteristic of broadly negative evaluations of racial outgroup members. Studies 3a–d addressed this possibility by testing if untrustworthiness is a salient stereotype for Blacks, Asians, and Whites and by testing how inversion affected trustworthiness ascriptions toward (outgroup) Black, (outgroup) Asian, and (ingroup) White faces. Testing this effect on Asian faces is critical because Asian and Black individuals would both be outgroups to White perceivers, but be outgroups associated with different category stereotypes (Fiske, Cuddy, Glick, & Xu, 2002).
Although upright versus inverted White faces were more homogeneous in Study 2a, suggesting dehumanization, no difference emerged in Study 2b. Because PD values for upright and inverted White faces were similar across studies, a larger sample in Study 2a (45 participants) versus 2b (32 participants) could have driven this difference because it was better powered to detect this effect. Study 3b, with a larger sample (80 participants) than Studies 2a and 2b, was expected to replicate Study 2a.
8. Study 3a
Regardless of prejudice level, knowledge of category stereotypes is sufficient to automatically activate stereotypes (Devine, 1989). Although reducing configural processing compromises the extraction of individuated information from faces, it leaves category information (e.g., race) accessible (Cloutier & Macrae, 2007; Cloutier et al., 2005). Studies 2a and 2b showed that reducing configural processing for Black faces decreased their perceived trustworthiness, but increased homogeneity. Studies 3a–d examined whether these findings reflected a general outgroup effect, or were specific to Black faces, which would indicate the specific dehumanization of Blacks. To do this, the task described in Studies 2a and 2b was modified to include Asian faces. Asian faces were included because Asian individuals are stereotyped as a “model minority” (Lee, Wong, & Alvarez, 2009) and are associated with competence (Fiske et al., 2002; Lin, Kwan, Cheung, & Fiske, 2005). If disrupting configural processing reduces perceived trustworthiness for any outgroup face, then White perceivers should rate inverted Black and Asian faces as being less trustworthy than upright faces. If, however, inverted Black faces are perceived to be less trustworthy because they are associated with a negative stereotype of being less trustworthy, White perceivers should rate inverted Black, but not Asian, faces as being less trustworthy than upright faces (resulting in a Face Orientation × Target Race interaction). Study 3a verified that Black individuals are stereotyped as being untrustworthy (see Kubota et al., 2013; Stephan et al., 2002), versus Asian individuals. Studies 3b–d tested if the effects from Studies 2a and 2b generalize to Asian targets or are specific to Black targets.
8.1. Method
Because we expected participants to easily recognize race-related stereotypes (Devine, 1989), power analyses using r = 0.33 (d = 0.70; selected on the basis of expecting a robust effect; Devine, 1989) and alpha = 0.05 targeted 22 participants for 80% power to detect a Target Race effect on stereotype ratings of untrustworthiness. Twenty-two undergraduates participating for course credit indicated the extent to which American society generally stereotypes Black, Asian, and White individuals as being untrustworthy, threatening, poor, athletic, and smart using a 9-point scale (1 = not at all stereotyped to 9 = extremely stereotyped).
8.2. Results and discussion
Ratings were entered into a 3 (Target Race: Black, Asian, White) × 5 (Trait: untrustworthy, threatening, poor, athletic, smart) repeated-measures ANOVA. In addition to effects of Target Race, F(2, 42) = 73.38, p < 0.001, ηp2 = 0.77, and Trait, F(4, 84) = 9.50, p < 0.001, ηp2 = 0.31, a Target Race × Trait interaction emerged, F(8, 168) = 55.34, p < 0.001, ηp2 = 0.73. Untrustworthiness was a more salient category stereotype for Black versus Asian, F(1, 21) = 43.29, p < 0.001, ηp2 = 0.67, and White, F(1, 21) = 30.59, p < 0.001, ηp2 = 0.59, individuals. No difference between Asian and White individuals emerged, F(1, 21) = 3.25, p = 0.09, ηp2 = 0.13. See Table 2a for descriptive statistics for untrustworthiness and Supplemental materials for complete statistics on the other traits.
Table 2.
Descriptive statistics (mean (standard deviation)) for Studies 3a, 3b, 3c, and 3d.
| A. Stereotype ratings of trustworthinessa in Studies 3a, 3c, and 3d
| |||
|---|---|---|---|
| Study | Black | Asian | White |
| 3a | 6.91 (1.74) | 2.77 (2.07) | 4.00 (2.58) |
| 3c | 2.96 (2.01) | 5.42 (2.20) | 6.23 (2.31) |
| 3d | 2.75 (1.76) | 5.83 (2.13) | 6.40 (2.09) |
| B. Trustworthiness ratings in Studies 3b, 3c, and 3d
| |||||||||
|---|---|---|---|---|---|---|---|---|---|
| Study | Black
|
Asian
|
White
|
||||||
| Upright | Inverted | Total | Upright | Inverted | Total | Upright | Inverted | Total | |
| 3b | 3.92 (0.74) | 3.64 (0.75) | 3.78 (0.72) | 3.75 (0.80) | 3.75 (0.84) | 3.75 (0.79) | 4.11 (0.70) | 4.11 (0.70) | 4.11 (0.64) |
| 3c | 3.60 (0.74) | 3.40 (0.75) | 3.49 (0.94) | 3.85 (0.80) | 3.98 (0.84) | 3.92 (0.82) | 4.00 (0.70) | 4.06 (0.70) | 4.03 (0.71) |
| 3d | 3.50 (0.91) | 3.32 (0.97) | 3.41 (0.92) | 3.99 (0.84) | 3.97 (0.90) | 3.98 (0.82) | 4.01 (0.77) | 3.93 (0.77) | 3.97 (0.71) |
| C. Homogeneity values (PD) in Studies 3b, 3c, and 3d | |||||||||
|---|---|---|---|---|---|---|---|---|---|
| Study | Black | Asian | White | ||||||
| Upright | Inverted | Total | Upright | Inverted | Total | Upright | Inverted | Total | |
| 3b | 0.75 (0.07) | 0.71 (0.10) | 0.73 (0.08) | 0.75 (0.10) | 0.71 (0.11) | 0.72 (0.10) | 0.78 (0.06) | 0.76 (0.10) | 0.77 (0.05) |
| 3c | 0.68 (0.07) | 0.62 (0.10) | 0.65 (0.18) | 0.68 (0.10) | 0.63 (0.11) | 0.66 (0.15) | 0.72 (0.06) | 0.69 (0.10) | 0.70 (0.12) |
| 3d | 0.73 (0.12) | 0.67 (0.16) | 0.70 (0.14) | 0.73 (0.11) | 0.68 (0.13) | 0.71 (0.11) | 0.76 (0.08) | 0.73 (0.10) | 0.74 (0.09) |
In Study 3a, the stereotype of “untrustworthiness” was rated. In Studies 3c and 3d, the stereotype of “trustworthiness” was rated.
9. Study 3b
Study 3a showed that Black individuals are stereotyped as being more untrustworthy than Asian or White individuals. Study 3b examined whether disrupting configural processing reduces perceived trustworthiness for any outgroup face, or just for Black faces (because they are stereotyped as being untrustworthy). Based on Study 3a, one hypothesis was that White perceivers would rate inverted Black, but not Asian, faces as being less trustworthy than upright faces. A second hypothesis was that if configural processing reduces perceived trustworthiness for any outgroup face, then White perceivers should rate both inverted Black and Asian faces as being less trustworthy than upright faces.
9.1. Method
Power analyses using r = 0.24 (d = 0.50; selected on the basis of not having an a priori prediction of a modest or robust effect) and alpha = 0.05 targeted 57 participants for 80% power to detect a Face Orientation × Target Race interaction on trustworthiness ratings. We oversampled and recruited 94 Indiana University undergraduates who participated for course credit. We recruited a higher number of participants than suggested by the power analyses for two reasons. First, Study 2b had a smaller sample than Study 2a and did not find an inversion effect on the homogeneity of White faces. The larger sample size in Study 3b therefore allowed us to assess if the sample of Study 2b was underpowered to detect this difference in White faces. Second, we wanted to ensure a sufficient number of participants who would meet inclusion criteria (see Study 2a). Data from 14 participants were excluded (two for not identifying as White, seven for suggesting that they did not follow instructions, and one for only using two of the seven ratings on the scale). Because participants were instructed to avoid making the same response for a majority of faces, the other four were not analyzed because their ratings suggested inattention to these instructions (four had > 60% of responses on the first two ratings [M = 72.97%, SD = 9.76] and one had 62.20% of responses at the two scale endpoints. Because PD is calculated based on rating dispersion, excluding participants on the basis of this criterion is important because reliance on scale endpoints can result in erroneously small PD values. These exclusions yielded 80 participants that reflected 91.20% power to detect a Face Orientation × Target Race interaction on trustworthiness ratings. Results regarding trustworthiness ratings were unchanged when including these 14 participants. Including these participants in the homogeneity analyses yielded main effects of Face Orientation and Target Race, but not the interaction effect, illustrating PD sensitivity to drastic changes in scale use.
Stimuli and procedure replicated Study 2a with one difference. Sixty grayscale images of neutrally expressive adult male Asian faces from the CAS-PEAL Face Database (Gao et al., 2008) were included in the stimuli (half upright, and half inverted).4 Participants thus rated the trustworthiness of 60 White, 60 Black, and 60 Asian randomly presented faces.
9.2. Results
9.2.1. Trustworthiness
Ratings were entered into a 2 (Face Orientation: upright, inverted) × 3 (Target Race: Black, Asian, White) repeated-measures ANOVA (see Table 2b for relevant descriptive statistics). Consistent with our prediction, a Face Orientation × Target Race interaction emerged, F(2, 158) = 14.07, p < 0.001, ηp2 = 0.15 (Fig. 3a). Replicating Studies 2a and 2b, less trustworthiness was only perceived in inverted versus upright Black faces, F(1, 79) = 42.28, p < 0.001, ηp2 = 0.35. Upright and inverted White, F(1, 79) = 0.001, p = 0.98, ηp2 < 0.01, and Asian, F(1, 79) = 0.01, p = 0.94, ηp2 < 0.01, faces were perceived to be similarly trustworthy.
Fig. 3.
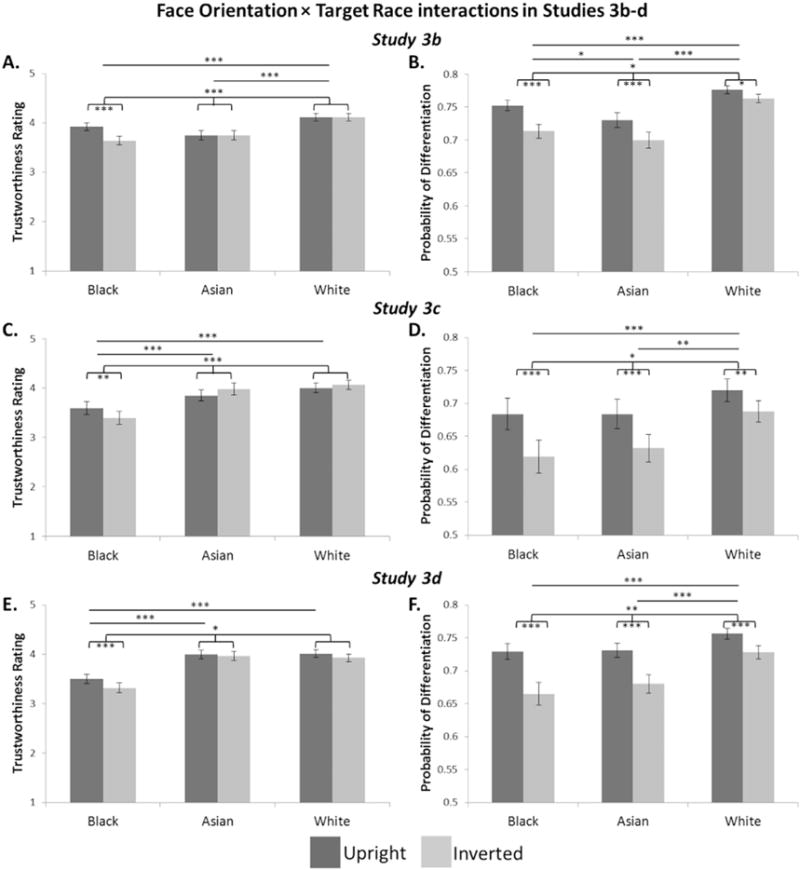
Disrupting configural processing reduced the trust perceived in Black, but not Asian or White faces in Studies 3b (A) 3c (C) and 3d (E). Disrupting configural processing also increased the homogeneity of Black and Asian faces to a greater extent than of White faces in Studies 3b (B), 3c (D) and 3d (E). * = p < 0.05, ** = p < 0.01, *** = p < 0.001; error bars represent SEM.
Also emergent were main effects of Face Orientation, F(1, 79) = 7.07, p = 0.01, ηp2 = 0.08, and Target Race, F(1, 158) = 11.16, p < 0.001, ηp2 = 0.12. White faces were perceived as more trustworthy than Black faces F(1, 79) = 14.90, p < 0.001, ηp2 = 0.16. Unexpectedly, White faces were also more trustworthy than Asian faces, F(1, 79) = 17.89, p < 0.001, ηp2 = 0.19, faces. Black and Asian faces were rated similarly, F(1, 79) = 0.17, p = 0.68, ηp2 < 0.01.
9.2.2. Homogeneity
PD values were entered into a 2 (Face Orientation: upright, inverted) × 3 (Target Race: Black, Asian, White) repeated-measures ANOVA (see Table 2c for relevant descriptive statistics). In addition to main effects of Face Orientation, F(1, 79) = 30.52, p < 0.001, ηp2 = 0.28, and Target Race, F(2, 158) = 26.53, p < 0.001, ηp2 = 0.25, a Face Orientation × Target Race interaction emerged, F(2, 158) = 3.33, p = 0.04, ηp2 = 0.04 (Fig. 3b). Like Studies 2a and 2b, upright versus inverted Black faces were more differentiated, F(1, 79) = 17.63, p < 0.001, ηp2 = 0.18. Interestingly, upright versus inverted Asian faces were also more differentiated, F(1, 79) = 13.97, p < 0.001, ηp2 = 0.15. This difference was smaller for upright versus inverted White faces, F(1, 79) = 7.09, p = 0.01, ηp2 = 0.08, replicating Study 2a.
9.3. Discussion
Inversion reduced trustworthiness for Black, but not Asian, faces. Because untrustworthiness was rated to be less stereotypic of Asian versus Black individuals in Study 3a, this finding suggests that disrupting configural processing is associated with more dehumanization of faces for which untrustworthiness is a salient stereotype. A caveat to this interpretation, however, is that Black and Asian upright faces were perceived as similarly trustworthy. This was unexpected because it is inconsistent with the results from Study 3a. Although both samples were drawn from similar participant pools, it is possible that the Study 3b sample did not endorse the same stereotypes about Asian and Black individuals that the Study 3a sample did. Given that this undergraduate sample was drawn from a university with a large and often negatively stereotyped international student population, it is also possible that Black and Asian faces were similarly rated due to ingroup favoritism (Hewstone, Rubin, & Wilis, 2002). Trustworthiness is, after all, a valence-laden trait (Oosterhof & Todorov, 2008). To address these possibilities, Study 3c drew from a different participant source, and replicated Studies 3a and 3b within the same participants.
In Study 2a, the interaction between Face Orientation and Race on homogeneity indicated that both inverted Black and White faces were perceived as more homogeneous than upright Black and White faces, but that this difference was larger for Black than for White faces. However, no difference emerged for White faces in Study 2b. One possibility for this discrepancy may have been the relatively smaller sample in Study 2b than 2a. Addressing this possibility, a larger sample recruited for Study 3b replicated the interaction observed in Study 2a. Thus, it may be that homogeneity effects are less robust for White than for Black faces. Indeed, the finding that both Black and Asian faces were perceived as more homogeneous versus White faces is consistent with work showing more homogeneity perceived in outgroup versus ingroup members (Linville et al., 1989). Reducing configural processing (which decreases individuation; Hugenberg, Young, Bernstein, & Sacco, 2010) may increase how homogeneously Black and Asian faces are perceived to be.
10. Study 3c
Study 3c replicated Studies 3a and 3b in the same sample of participants to resolve the discrepancy between Study 3a (where Black individuals were rated as being stereotypically more untrustworthy than White individuals) and Study 3b (where Black and Asian faces were rated as being similarly trustworthy overall). Study 3c was also conducted to replicate the critical Face Orientation × Target Race interaction observed in Study 3b (whereby disrupting configural processing reduced trustworthiness for Black, but not Asian or White, faces). If the salience of untrustworthiness as a category stereotype drives inversion effects on trustworthiness, Black faces should be the only faces affected by face inversion, and these faces should also be perceived as less trustworthy than White and Asian faces overall.
10.1. Method
Because Study 3c was intended to replicate Study 3b, power analyses were the same as in Study 3b. Eighty participants from Amazon Mechanical Turk completed the task to ensure the recruitment of a sufficient number of participants who followed task instructions and identified as White. The data of 19 participants who did not identify as White and of four participants who reported that they made responses at random were not analyzed, yielding a sample of 57 White participants that reflected 80% power to detect a Face Orientation × Target Race interaction on trustworthiness ratings. Stimuli and procedure replicated Studies 3a and 3b with one difference: the trait “trustworthy” was used in the stereotypes ratings task to be consistent with the ratings task. Results were unchanged when including the four participants who reported that they had made responses at random.
10.2. Results
10.2.1. Stereotype ratings
Analyses mirrored Study 3a. In addition to main effects of Target Race, F(2, 112) = 29.42, p < 0.001, ηp2 = 0.34, and Trait, F(4, 224) = 17.93, p < 0.001, ηp2 = 0.24, a Target Race × Trait interaction emerged, F(8, 448) = 96.21, p < 0.001, ηp2 = 0.63. Trustworthiness was a less salient stereotype for Black versus Asian, F(1, 56) = 39.94, p < 0.001, ηp2 = 0.42, and White, F(1, 56) = 59.11, p < 0.001, ηp2 = 0.51, individuals. Trustworthiness was a marginally less salient stereotype for Asian versus White individuals, F(1, 56) = 3.26, p = 0.07, ηp2 = 0.13. See Table 2a for descriptive statistics for untrustworthiness and Supplemental materials for complete statistics on the other traits.
10.2.2. Trustworthiness
Using the same design as Study 3b (See Table 2b for relevant descriptive statistics), the Face Orientation × Target Race interaction replicated Study 3b, F(2, 112) = 10.74, p < 0.001, ηp2 = 0.16 (Fig. 3c). Inverted versus upright Black faces were perceived as less trustworthy, F(1, 56) = 7.90, p = 0.007, ηp2 = 0.12. Upright and inverted White, F(1, 56) = 1.08, p = 0.30, ηp2 = 0.02, and Asian, F(1, 56) = 2.85, p = 0.10, ηp2 = 0.05, faces were perceived similarly.
A main effect of Target Race emerged, F(2, 112) = 12.03, p < 0.001, ηp2 = 0.18, because, as in Study 3b, Black faces were perceived as being less trustworthy than White faces, F(1, 56) = 16.32, p < 0.001, ηp2 = 0.23. Critically, Black faces were also perceived as being less trustworthy than Asian faces, F(1, 56) = 16.14, p < 0.001, ηp2 = 0.22. Asian and White faces did not differ, F(1, 56) = 1.25, p = 0.27, ηp2 = 0.02. Unlike Studies 2a–b, and 3b, there was not a main effect of Face Orientation, F(1, 56) = 0.001, p = 0.99, ηp2 < 0.01. This is due to higher, albeit to a non-significant degree, means for inverted versus upright Asian and White faces.
10.2.3. Homogeneity
Using the same design as Study 3b (see Table 2c for relevant descriptive statistics), the Face Orientation × Target Race interaction emerged, F(2, 112) = 3.06, p = 0.05, ηp2 = 0.05 (Fig. 3d) in addition to main effects of Face Orientation, F(1, 56) = 34.93, p < 0.001, ηp2 = 0.39, and Target Race, F(2, 56) = 6.53, p = 0.002, ηp2 = 0.10. Upright faces were more differentiated for Black, F(1, 56) = 26.17, p < 0.001, ηp2 = 0.32, and Asian, F(1, 56) = 20.17, p < 0.001, ηp2 = 0.27, faces. This difference was smaller for White faces, F(1, 56) = 10.96, p = 0.002, ηp2 = 0.16.
10.3. Discussion
Study 3c addressed the discrepant findings of Studies 3a and 3b by replicating Studies 3a and 3b on the same sample. Study 3c was consistent with Study 3a: Black individuals were stereotyped to be less trustworthy than Asian and White individuals. Critically, Black faces also were rated as less trustworthy than Asian or White faces. Study 3c also replicated that inversion reduced trustworthiness only for Black faces, and replicated the homogeneity effects from Study 3b. Study 3d was conducted as a pre-registered replication of Study 3c to verify these effects.
11. Study 3d
11.1. Method
Because Study 3c was intended to replicate Study 3b, power analyses were the same as in Study 3b with one exception: we now recruited a sufficient sample to obtain 95% power to detect a Face Orientation × Target Race interaction on trustworthiness ratings. Power analyses using r = 0.24 (d = 0.50) and alpha = 0.05 targeted 88 participants for 95% power to detect this interaction. One hundred participants from Prolific Academic completed the task to ensure a sufficient number of participants who followed task instructions and who identified as White. One participant who did not identify as White was excluded, yielding a sample of 99 White participants and providing 96.90% power to detect a Face Orientation × Target Race interaction on trustworthiness ratings. Study 3d was pre-registered on the Open Science Framework (https://osf.io/rxu3s/register/5771ca429ad5a1020de2872e) and replicated the design of Study 3c.
11.2. Results
11.2.1. Stereotype ratings
Analyses mirrored Study 3b. In addition to main effects of Target Race, F(2, 196) = 65.62, p < 0.001, ηp2 = 0.40, and Trait, F(4, 392) = 43.58, p < 0.001, ηp2 = 0.31, a Target Race × Trait interaction emerged, F(8, 784) = 271.12, p < 0.001, ηp2 = 0.74. Trustworthiness was a less salient stereotype for Black versus Asian, F(1, 98) = 140.51, p < 0.001, ηp2 = 0.59, and White, F(1, 98) = 222.00, p < 0.001, ηp2 = 0.69, individuals. Trustworthiness was also a less salient stereotype for Asian versus White individuals, F(1, 98) = 4.39, p = 0.04, ηp2 = 0.04. See Table 2a for descriptive statistics for untrustworthiness and Supplemental materials for complete statistics on the other traits.
11.2.2. Trustworthiness
Using the same design as Study 3b (see Table 2b for relevant descriptive statistics), the Face Orientation × Target Race interaction emerged, F(2, 196) = 3.30, p = 0.04, ηp2 = 0.03 (Fig. 3e). Black faces were perceived as being less trustworthy when they were inverted versus upright, F(1, 98) = 14.60, p < 0.001, ηp2 = 0.13. However, inversion did not affect ratings for White, F(1, 98) = 1.93, p = 0.17, ηp2 = 0.02, or Asian, F(1, 98) = 0.24, p = 0.63, ηp2 < 0.01, faces.
Main effects of Face Orientation, F(1, 98) = 5.09, p = 0.03, ηp2 = 0.05, and Target Race, F(2, 196) = 25.15, p < 0.001, ηp2 = 0.20, emerged. Like Study 3c, Black faces were perceived as less trustworthy than both White, F(1, 98) = 31.18, p < 0.001, ηp2 = 0.24, and Asian, F(1, 98) = 37.87, p < 0.001, ηp2 = 0.28, faces. Asian and White faces did not differ, F(1, 98) = 0.01, p = 0.94, ηp2 < 0.01.
11.2.3. Homogeneity
Using the same design as Study 3b (see Table 2c for relevant descriptive statistics), a Face Orientation × Target Race interaction emerged, F(2, 196) = 5.45, p = 0.005, ηp2 = 0.05, (Fig. 3f) in addition to main effects of Face Orientation, F(1, 98) = 71.88, p < 0.001, ηp2 = 0.42, and Target Race, F(2, 196) = 12.35, p < 0.001, ηp2 = 0.11. Upright versus inverted Black, F(1, 98) = 39.28, p < 0.001, ηp2 = 0.29, and Asian, F(1, 98) = 37.11, p < 0.001, ηp2 = 0.28, faces were more differentiated. This difference was smaller for White faces, F(1, 98) = 19.89, p < 0.001, ηp2 = 0.17.
11.3. Discussion
Study 3d replicated the key findings of Study 3c. Trustworthiness was less salient for Black versus Asian or White individuals. Black faces were also rated as less trustworthy than Asian or White faces. Following procedures for combining effect sizes in repeated-measures designs (Morris & DeShon, 2002), a meta-analysis assessing the extent to which all Black faces were rated as less trustworthy than all Asian faces across Studies 3b, 3c, and 3d yielded an effect size of r = 0.50 (95% CI = [0.37, 0.63], z = 7.57, p < 0.001). Although this meta-analysis supports the possibility that untrustworthiness is more salient for Black versus Asian or White faces, it is important to use caution when interpreting this finding given the discrepancy between Study 3b and Studies 3c–d. As different participant populations were tested in Studies 3b–d, this discrepancy may be due to subtleties in the populations tested. The critical finding across Studies 3b–d, however, was that face inversion consistently lowered the trustworthiness for Black, but not Asian or White, faces. These studies provide initial evidence that inversion reduces the trustworthiness perceived in faces for which being untrustworthy reflects a more salient category stereotype.
12. Study 4
Studies 2 and 3 showed that face inversion intensifies the dehumanization of Black versus White faces by lowering the trust perceived in them and increasing how homogeneously they are perceived. An open question is if these effects are unique to configural processing or if they arise based on generally impaired perceptual processing. Study 4 addressed this question by testing if disrupting configural processing versus more general perceptual disfluency lowers trustworthiness perceived in Black and White faces. In addition to manipulating face orientation, past work has manipulated the duration of face presentations to assess perceptual effects on person construal (Cloutier et al., 2005). In Study 4, trustworthiness ratings of inverted and upright Black and White faces were obtained after a visual pattern mask disrupted stimulus processing before (50 ms) or after (1000 ms) configural processing occurs.
Signals indicative of configural face processing are seen at approximately 170 ms post-stimulus onset (Maurer et al., 2002). Thus, presenting a pattern mask to cover stimuli before 170 ms (e.g., 50 ms post-stimulus onset) disrupts both configural processing (because configural processing will not have completed yet) and provides a general perceptual disfluency (Guest, Kent, & Adelman, 2010). Presenting a pattern mask after configural face processing is expected to occur (e.g., 1000 ms post-stimulus onset) would not disrupt configural processing, although it might create some disfluency immediately before ratings. Because trustworthiness is extracted from faces presented for 33 ms (Todorov, Pakrashi, & Oosterhof, 2009), 50 ms exposure should not undermine the ability to make trustworthiness evaluations.
Study 4 replicated Studies 2a and 2b with one exception: the manipulation of the time between face onset and a pattern mask covering the face (50 ms versus 1000 ms). If Studies 2a and 2b reflect general perceptual disfluency, the findings of Studies 2a and 2b should replicate in both the 50 ms and 1000 ms conditions. If specific to configural processing, the findings should replicate given 1000 ms face presentations (which would not disrupt configural processing), but not given 50 ms presentations (which undermines configural processing).
12.1. Method
Power analyses using r = 0.24 (d = 0.50; selected on the basis of not having an a priori prediction of a modest or robust effect) and alpha = 0.05 targeted 29 participants per Processing Time condition for 80% power to detect a Processing Time × Face Orientation × Target Race interaction on trustworthiness ratings. Sixty-three non-Black undergraduates from Indiana University participated to ensure the recruitment of a sufficient number of participants who met inclusion criteria. Data from two participants who suggested that they had not followed task instructions and from one participant who had completed a closely related study were excluded, yielding a sample of 60 participants Of these 60 participants, 30 had been assigned to the 50 ms condition and 30 to the 1000 ms condition, which yielded 83.90% power to detect a Processing Time × Face Orientation × Target Race interaction on trustworthiness ratings. Questionnaire data from one participant was not collected. Fifty-five of the 60 participants identified as White, and all results were unchanged when restricted to this sample. Including the excluded participants yielded equivalent results for trustworthiness ratings, but no homogeneity effects.
Study 2a was replicated with the following differences. Participants with 50 ms processing time saw faces for 50 ms followed by a noise mask for 150 ms before the scale. Participants with 1000 ms processing time saw faces for 1000 ms followed by the mask for 150 ms before the scale. 50 ms face presentations followed by a mask should broadly impoverish perceptual processing and undermine configural processing. 1000 ms presentations should allow for configural processing, but create processing disfluency before ratings. Presenting a mask immediately after a briefly presented target stimulus disrupts conscious perception of the target even though the target can still influence trustworthiness perception (e.g., Freeman, Stolier, Ingbretsen, & Hehman, 2014).
12.2. Results
12.2.1. Trustworthiness
Trustworthiness ratings were entered into a 2 (Processing Time: 50 ms, 1000 ms) × 2 (Face Orientation: upright, inverted) × 2 (Target Race: Black, White) mixed ANOVA. A main effect of Face Orientation, F(1, 58) = 18.88, p < 0.001, ηp2 = 0.25, a main effect of Target Race, F(1, 58) = 22.85, p < 0.001, ηp2 = 0.28, a Processing Time × Face Orientation interaction, F(1, 58) = 18.62, p < 0.001, ηp2 = 0.24, and a Face Orientation × Target Race interaction, F(1, 58) = 4.97, p = 0.03, ηp2 = 0.08, emerged. The expected three-way interaction between Processing Time, Face Orientation, and Target Race emerged, F(1, 58) = 29.07, p < 0.001, ηp2 = 0.33 (Fig. 4), and supported the prediction that face inversion would influence trustworthiness ascriptions by race differently for the 50 ms and 1000 ms conditions.
Fig. 4.

In Study 4, inversion effects were eliminated for Black faces and exacerbated among White faces when disrupting visual processing after 50 ms. After 1000 ms, the pattern in trustworthiness ratings was similar to the patterns shown in Studies 2a–b and 3b–d. + = p < 0.09, * = p < 0.05, *** = p < 0.001; error bars represent SEM.
With 1000 ms processing time, there was a Face Orientation × Target Race interaction that replicated Studies 2a and 2b, F(1, 29) = 5.65, p = 0.02, ηp2 = 0.16. Inverted Black faces (M = 3.84, SD = 0.84) were perceived as marginally less trustworthy than upright Black faces (M = 3.99, SD = 0.84), F(1, 29) = 3.23, p = 0.08, ηp2 = 0.10. Inverted White faces (M = 4.34, SD = 0.68) were perceived to be marginally more trustworthy than upright White faces (M = 4.20, SD = 0.74), F(1, 29) = 3.02, p = 0.09, ηp2 = 0.09.
The Face Orientation × Target Race interaction emerged differently with 50 ms processing time, F(1, 29) = 26.06, p < 0.001, ηp2 = 0.47. Black upright (M = 3.70, SD = 0.79) and inverted (M = 3.58, SD = 0.79) faces were perceived as being similarly trustworthy, F(1, 29) = 1.52, p = 0.23, ηp2 = 0.05. White upright faces (M = 4.79, SD = 0.60) were perceived to be more trustworthy than White inverted faces (M = 3.95, SD = 0.73), F(1, 29) = 37.70, p < 0.001, ηp2 = 0.57.
There was no Race × Processing Time interaction, F(1, 58) = 2.73, p = 0.10, ηp2 = 0.05.
12.2.2. Homogeneity
PD values were entered into a 2 (Processing Time: 50 ms, 1000 ms) × 2 (Face Orientation: upright, inverted) × 2 (Target Race: Black, White) mixed ANOVA. There was a main effect of Face Orientation, F(1, 58) = 5.73, p = 0.02, ηp2 = 0.09. Upright faces (M = 0.77, SD = 0.05) were differentiated more than inverted faces (M = 0.75, SD = 0.06). Also replicating Studies 2a–b, and 3b–d, a Target Race effect emerged, F(1, 58) = 5.78, p = 0.02, ηp2 = 0.09. White faces (M = 0.77, SD = 0.05) were differentiated more than Black faces (M = 0.75, SD = 0.06).
A Processing Time × Target Race interaction emerged, F(1, 58) = 8.22, p = 0.01, ηp2 = 0.12. At 50 ms, Black (M = 0.77, SD = 0.06) and White (M = 0.76, SD = 0.05) faces were similarly differentiated, F(1, 29) = 0.31, p = 0.58, ηp2 = 0.01. At 1000 ms, White faces (M = 0.78, SD = 0.05) were differentiated more than Black faces (M = 0.74, SD = 0.06), F(1, 29) = 5.83, p = 0.01, ηp2 = 0.22.
Unlike Studies 2a–b and 3b–d, there was no Face Orientation × Target Race interaction, F(1, 58) = 0.72, p = 0.40, ηp2 = 0.01. This pattern might be expected because the pattern in the 1000 ms condition would be expected to differ from that of the 50 ms condition. However, there was no Processing Time × Face Orientation × Target Race interaction, F(1, 58) = 0.07, p = 0.80, ηp2 < 0.01. It is worth noting that the means for the 1000 ms condition generally followed the pattern in Studies 2a–b, and 3b–d (upright Black: M = 0.75, SD = 0.09; inverted Black: M = 0.72, SD = 0.08; upright White: M = 0.79, SD = 0.04; inverted White: M = 0.77, SD = 0.05), whereas the means for the 50 ms condition did not (upright Black: M = 0.77, SD = 0.05; inverted Black: M = 0.77, SD = 0.06; upright White: M = 0.76, SD = 0.06; inverted White: M = 0.76, SD = 0.08). Because the power analysis was aimed at detecting the Processing Time × Face Orientation × Target Race interaction on trustworthiness ratings, it is possible that Study 4 was underpowered to detect the interaction on homogeneity. There was no Processing Time × Face Orientation interaction, F(1, 58) = 0.89, p = 0.35, ηp2 = 0.02.
12.3. Discussion
Study 4 showed that the intensified dehumanization of Black versus White faces shown in Studies 2a–b and 3b–d is due to reduced configural processing and not characteristic of more general perceptual disfluency. Although perceivers extract trustworthiness from faces with 33 ms presentations (Todorov et al., 2009), disrupting perceptual operations by masking faces after 50 ms presentations did not replicate the pattern shown in Studies 2a–b and 3b–d. This manipulation reduced the trustworthiness perceived in Black versus White faces regardless of orientation. Impoverishing processing at 50 ms prohibits configural processing (for a review, see Maurer et al., 2002). Upright and inverted Black faces might be rated as similarly untrustworthy after 50 ms because people process trustworthiness even without perceptual awareness of faces (Freeman et al., 2014; Todorov et al., 2009).
Upright and inverted Black faces were perceived as similarly trustworthy with 50 ms presentations. White upright versus inverted faces, however, were perceived as more trustworthy at this duration. Configural processing may modulate face processing very early in perception, although early modulations primarily emerge for ingroup White, but not outgroup Black, faces (Hahn, Jantzen, & Symons, 2012). Although unexpected, an effect for White faces in the 50 ms condition supports this possibility. It will be important for future work to disentangle how different aspects of perceptual operations combine to elicit differences in perceiver evaluations. Overall, that White versus Black faces were perceived as more trustworthy is consistent with work showing that category information is efficiently extracted from faces with minimal exposures (Cloutier et al., 2005). The key insight from Study 4 is that lower trust perceived in Black faces emerged dependent on whether Black faces were afforded configural processing.
Ratings for faces masked after 1000 ms mirrored the pattern shown in Studies 2a, 2b, and 3b. When sufficient time to elicit configural processing has elapsed, inversion effects occur even in the presence of some other perceptual disfluency (i.e., the pattern mask). This pattern suggests that inversion reduced configural processing, contributing to the observed pattern of data across our studies. Interestingly, inverted versus upright White faces were perceived as marginally more trustworthy in the 1000 ms condition, diverging from the pattern from Studies 2a–b, and 3b–d. Speculatively, this could result from inversion-related category salience in the presence of other perceptual disfluency (e.g., a pattern mask). Future work can assess this possibility.
12.4. Meta-analyses
Configural processing effects on perceived trustworthiness and homogeneity were assessed across Studies 2a, 2b, 3b, 3c, 3d and 4. Because the effect sizes obtained across these studies differed, meta-analyses can identify the extent of a common effect. Following the procedures outlined in Morris and DeShon (2002) for combining effect sizes obtained in repeated-measures designs, meta-analyses characterized the interaction effects of interest (i.e., Face Orientation × Target Race) across the current article. Two separate meta-analyses were conducted on the Face Orientation × Target Race interaction effects from Studies 2a, 2b, 3b, 3c, 3d (using the interaction effect for upright and inverted Black and White faces only in Studies 3b–d), and 4 (using the interaction effect in the 1000 ms condition, as the 50 ms condition would not be expected to replicate Studies 2a–b) for, respectively, trustworthiness ratings and PD. For each study, difference scores for Blackupright – Blackinverted and Whiteupright – Whiteinverted represented two points within participants in order to calculate an effect size r and the sampling variance of the effect size r for each study.
For trustworthiness ratings, the meta-analysis yielded an overall effect size of r = 0.32 (95% CI = [0.21, 0.43]); z = 5.80, p < 0.001) for the Face Orientation × Target Race interaction. For relative homogeneity (PD), the meta-analysis yielded an overall effect size of r = 0.16 (95% CI = [0.06, 0.27], z = 2.96, p = 0.003) for the Face Orientation × Target Race interaction.
13. General discussion
The present work showed that disrupting configural processing triggered dehumanization more strongly for Black than White faces. Study 1 showed that reducing the configural processing of outgroup Black versus White faces slowed the activation of human-related concepts. Studies 2–4 investigated if this pattern extended to trustworthiness ascriptions and homogeneity, two down-stream characteristics of dehumanization (Bastian et al., 2011; Kteily et al., 2015; Opotow, 1990). Across these studies, face inversion cued perceptions of Black versus White faces as less trustworthy and more homogeneous.
The face is a basic cue to humanness, and configural face processing may send a signal that a face is human (Fincher & Tetlock, 2016; Hugenberg et al., 2016). Study 1 replicated and extended prior work (Hugenberg et al., 2016) by showing that reducing configural processing slows the activation of human-related concepts more for Black than White faces, thereby establishing a pattern for how configural face processing may interface with outgroup dehumanization. This pattern may seem surprising given work suggesting that configural processing is reserved for ingroup faces (e.g., Hugenberg & Corneille, 2009). Although the studies were not designed to test this hypothesis, this pattern implies that configural processing does occur for outgroup faces, a possibility consistent with work showing that configural processing may be delayed or inefficient, but not absent, for outgroup faces (Wiese et al., 2009).
Reducing configural processing affected the activation of human-related concepts more for Black than White faces in Study 1. Showing the especially potent effect of this manipulation in explicitly dehumanizing judgments, Studies 2a–b and 3b–d evidenced these effects in two characteristics of dehumanization. First, these effects were reflected in the untrustworthy evaluations stereotypic of dehumanized individuals (Vezzali et al., 2012) and specifically of Black individuals (Stephan et al., 2002). Second, they were reflected in the homogeneity of trustworthiness evaluations, as homogeneity characterizes dehumanization (Kteily et al., 2015). Reduced configural processing reduced trust ascriptions to Black, but not White faces, as well as more homogeneity of Black versus White faces. That Black versus White faces were consistently dehumanized more with disrupted configural processing suggests that reduced configural processing may have a stronger effect on dehumanization for outgroup Black versus White faces.
Dehumanization was greater for inverted Black faces. Because disrupting configural processing may have removed individuating aspects of the faces, category stereotypes may have been especially salient. White faces may be less humanized given disrupted configural processing (Hugenberg et al., 2016), but be perceived similarly with regard to trust (Studies 2a, 2b, 3b) because they lack the stereotype of being untrustworthy relative to Black individuals. Studies 3a–d supported this possibility. Studies 3a, 3c, and 3d established that untrustworthiness is a salient category stereotype for Black more than for Asian or White individuals. Studies 3b–d showed that inverting Black faces, but not White or Asian faces, reduced trustworthiness. Study 4 suggested this pattern is due to reduced configural processing and not general perceptual disfluency.
That dehumanizing Black individuals reduces perceptions that they are trustworthy holds serious consequences for targets. People dehumanize convicts (Bastian, Denson, & Haslam, 2013), finding it easier to punish those for whom they engage in less configural processing (Fincher & Tetlock, 2016). Trustworthiness predicts the harshness of sentencing (Wilson & Rule, 2015, 2016). Because Black versus White convicts are more dehumanized even if their crimes are similar (Goff et al., 2008), it suggests that the interface between configural face processing and reduced trust may affect how people of different races are sentenced. This is important to consider because quantitative, and not qualitative differences emerge in the extent to which people naturally process outgroup faces in a configural manner (Wiese et al., 2009). The current work suggests that the way Black faces are naturally processed may cue their being perceived as untrustworthy, predicting subtle and more overt dehumanization in everyday life.
The pattern yielded in trustworthiness by race emerged in homogeneity. Homogeneity is related to dehumanization in that dehumanized individuals will be seen as more equivalent to one another in the extent to which they possess specific traits (Kteily et al., 2015; Ostrom & Sedikides, 1992; Smith, 2011). Reduced configural processing may not only intensify the dehumanization of Black individuals by their being perceived as more untrustworthy. Reduced configural face processing may elicit a stereotypic trait like untrustworthiness being applied to many Black individuals to the same extent. Reduced configural processing decreased the differentiation of Black faces more than for White faces, suggesting more homogeneity among Black faces (Studies 2a–b, 3b–d). Increased homogeneity for upright Black versus White faces in across studies suggests these faces may already be dehumanized to an extent, in that people naturally perceive outgroups versus ingroups as less differentiated on different traits (e.g., Linville et al., 1989). That inversion effects on homogeneity were stronger for Black faces across studies suggests that baseline dehumanization is exacerbated for Black faces. This effect likely occurs because inversion removes the signal of humanness provided by configural processing, subsequently reducing the regulation of dehumanizing judgments.
Assessing the homogeneity of trustworthiness ascriptions is as important as assessing ascriptions themselves. Biased evaluations of outgroups reflect more dehumanization (Cehajic, Brown, & Gonzalez, 2009; Viki, Osgood, & Phillips, 2013). However, it is easier to escalate violence if a group is perceived as a homogeneous mass of people (Keen, 1986; Mullen & Hu, 1989). Notably, inversion cued patterns toward more homogeneity for White faces. These patterns emerged even though the inverted versus upright White faces were not viewed as being less trustworthy. Reducing configural processing may thus elicit the dehumanization of different groups in subtle ways. Although reduced configural processing may not always lead an individual to be perceived as untrustworthy, it lowers the probability of that individual as being perceived as distinct from his or her category on different attributes. Studies 3a–d suggest these findings may be attributed to the salience of category stereotypes. Face inversion prohibits the extraction of individuated but not category-based information (e.g., Cloutier et al., 2005). Because untrustworthiness is not as salient of a category stereotype for White versus Black faces, configural processing may prohibit individuated responding (e.g., perceiving upright versus inverted White faces as more variable regarding their trustworthiness) and promote categorical responding (e.g., perceiving inverted White faces as trustworthy because of their group). Supporting this idea, inversion did not affect the trustworthiness perceived in Asian faces, but elicited more homogeneous responding (Studies 3b–d). Indeed, research from our lab suggests that when perceivers view Black inverted faces, they do not activate brain regions involved in control, whereas they do when Black faces are upright (Rydell et al., 2017). If perceivers do not engage control, stereotypes may therefore play a more prominent role in their evaluations. Future research should more carefully examine this possibility.
The present work tested how reduced configural processing affects the dehumanization of Black versus White individuals. Although inefficient or delayed configural processing of racial outgroups may occur as a result of differences in familiarity (Rhodes, Brake, Taylor, & Tan, 1989; Wiese et al., 2009), people motivated to punish targets may process target faces in a less configural manner regardless of familiarity (Fincher & Tetlock, 2016). This finding suggests the possibility that correlates of dehumanization like perceived threat (Hackel, Looser, & Van Bavel, 2014), ingroup identification (Demoulin et al., 2009), self-protective motives (Castano & Giner-Sorolla, 2006), social affiliation needs (Epley, Akalis, Waytz, & Cacioppo, 2008), and prejudice (Goff et al., 2008), may influence the extent that faces are configurally processed and lead to differences in how much people dehumanize others. These factors may influence how the upright faces seen in myriad situations are afforded configural processing, affecting their dehumanization. Although exploratory analyses suggested that perceivers’ prejudice did not affect their reduced trust for inverted versus upright Black faces (see Supplemental materials), the present work was not designed to test this possibility. Future work should aim to test these possibilities.
The current work suggested a role of relative configural face processing in the stronger dehumanization of Black versus White individuals. Perceiving faces as human depends on configural processing (Hugenberg et al., 2016). Race disparities in trust prevalent in the literature (e.g., Cassidy & Krendl, 2016; Kubota et al., 2013; Stanley, Sokol-Hessner, Banaji, & Phelps, 2011) and in society may be influenced by how much faces are processed in a configural manner, indicative of the relative humanity people perceive in others.
Supplementary Material
Acknowledgments
We thank Shelby Lanie, Gregory Sprout, and Rayne Kim for research assistance. We also thank Michael Frisby for feedback on statistical analyses. This research was supported by NIA grant F32AG051304 to B.S.C. and NSF grant BCS-1423765 to K.H., R.J.R., and S.G.Y.
Appendix A. Supplementary data
Supplementary data to this article can be found online at http://dx.doi.org/10.1016/j.jesp.2017.06.018.
Footnotes
Face inversion is a widely used method to examine configural face processing (e.g., Hugenberg et al., 2016). Face inversion maintains facial features (i.e., the eyes, nose, and mouth still exist), but disrupts the eyes-over-nose-over-mouth configuration of features. Maintaining these features makes face inversion well-suited to isolate effects of configural processing on social cognition.
The word “soul” was included based on pre-testing showing that it was highly characteristic of humanity (Hugenberg et al., 2016). However, “soul” may also be considered Black-stereotypic in a different context. Less response facilitation to human-related words preceded by inverted Black face primes illustrates the strength of this dehumanization effect by race.
To rule out the possibility that participants perceived faces as more trustworthy than others because they were more attractive (i.e., an attractiveness halo), attractiveness norms included with the Eberhardt Face Database from the faces used in Studies 2a–b, 3b–d, and 4 were entered into a 2 (Face Orientation: Upright, Inverted) × 2 (Target Race: Black, White) ANOVA. There were no main effects of Face Orientation, F(1, 116) = 0.008, p = 0.93, ηp2 < 0.01, or Target Race, F(1, 116) = 0.04, p = 0.84, ηp2 < 0.01, and no interaction, F(1, 116) = 0.71, p = 0.40, ηp2 = 0.01.
Attractiveness norms for the Asian faces, Black, and White faces were entered into a 2 (Face Orientation: Upright, Inverted) × 3 (Target Race: Black, Asian, White) ANOVA to rule out the possibility that faces would be perceived as more trustworthy than others because of an attractiveness halo. There were no main effects of Face Orientation, F(1, 174) = 0.04, p = 0.84, ηp2 < 0.01, or Target Race, F(2, 174) = 0.17, p = 0.85, ηp2 < 0.01, and no interaction, F(2, 174) = 0.40, p = 0.67, ηp2 = 0.01.
References
- Bastian B, Denson T, Haslam N. The roles of dehumanization and moral outrage in retributive justice. PLoS One. 2013 doi: 10.1371/journal.pone.0061842. [DOI] [PMC free article] [PubMed] [Google Scholar]
- Bastian B, Laham S, Wilson S, Haslam N, Koval P. Blaming, praising, and protecting our humanity: The implications of everyday dehumanization for judgments of moral status. British Journal of Social Psychology. 2011;50:469–483. doi: 10.1348/014466610X521383. [DOI] [PubMed] [Google Scholar]
- Boccato G, Capozza D, Ralvo R, Durante F. The missing link: Ingroup, outgroup, and the human species. Social Cognition. 2008;26(2):224–234. [Google Scholar]
- Cassidy B, Krendl A. Dynamic neural mechanisms underlie race disparities in social cognition. NeuroImage. 2016;132:238–246. doi: 10.1016/j.neuroimage.2016.02.043. [DOI] [PubMed] [Google Scholar]
- Castano E, Giner-Sorolla R. Not quite human: Infrahumanization in response to collective responsibility for intergroup killing. Journal of Personality and Social Psychology. 2006;90(5):804–818. doi: 10.1037/0022-3514.90.5.804. [DOI] [PubMed] [Google Scholar]
- Cehajic S, Brown R, Gonzalez R. What do I care? Perceive ingroup responsibility and dehumanization as predictors of empathy felt for the victim group. Group Processes & Intergroup Relations. 2009;12:715–729. [Google Scholar]
- Cloutier J, Macrae C. Who or what are you?: Facial orientation and person construal. European Journal of Social Psychology. 2007;37:1298–1309. [Google Scholar]
- Cloutier J, Mason M, Macrae C. The perceptual determinants of person construal: Reopening the social-cognitive toolbox. Journal of Personality and Social Psychology. 2005;88(6):885–894. doi: 10.1037/0022-3514.88.6.885. [DOI] [PubMed] [Google Scholar]
- Cuddy A, Rock M, Norton M. Aid in the aftermath of Hurricane Katrina: Inferences of secondary emotions and intergroup helping. Group Processes & Intergroup Relations. 2007;10(1):107–118. [Google Scholar]
- Demoulin S, Cortes B, Viki G, Rodriguez A, Rodriguez R, Paladino M, Leyens J. The role of in-group identification in infra-humanization. International Journal of Psychology. 2009;44(1):4–11. doi: 10.1080/00207590802057654. [DOI] [PubMed] [Google Scholar]
- Deska J, Almaraz S, Hugenberg K. Of mannequins and men: Judgments of animacy in faces are bounded by perceptual and processing similarities to human faces. Social Psychological and Personality Science. 2016;8(2):183–190. [Google Scholar]
- Devine P. Stereotypes and prejudice: Their automatic and controlled components. Journal of Personality and Social Psychology. 1989;56:5–18. [Google Scholar]
- Epley N, Akalis S, Waytz A, Cacioppo J. Creating social connection through inferential reproduction. Psychological Science. 2008;19(2):114–120. doi: 10.1111/j.1467-9280.2008.02056.x. [DOI] [PubMed] [Google Scholar]
- Farah M, Wilson K, Drain M, Tanaka J. What is “special” about face perception? Psychological Review. 1998;105(3):482–498. doi: 10.1037/0033-295x.105.3.482. [DOI] [PubMed] [Google Scholar]
- Fazio R, Sanbonmatsu D, Powell M, Kardes F. On the automatic activation of attitudes. Journal of Personality and Social Psychology. 1986;50(2):229–238. doi: 10.1037//0022-3514.50.2.229. [DOI] [PubMed] [Google Scholar]
- Fincher K, Tetlock P. Dehumanization of faces is activated by norm violations and facilitates norm enforcement. Journal of Experimental Psychology: General. 2016;145(2):131–146. doi: 10.1037/xge0000132. [DOI] [PubMed] [Google Scholar]
- Fiske S, Cuddy A, Glick P, Xu J. A model of (often mixed) stereotype content: Competence and warmth respectively follow from perceived status and competition. Journal of Personality and Social Psychology. 2002;82(6):878–902. [PubMed] [Google Scholar]
- Freeman J, Stolier R, Ingbretsen Z, Hehman E. Amygdala responsivity to high-level social information from unseen faces. The Journal of Neuroscience. 2014;34(32):10573–10581. doi: 10.1523/JNEUROSCI.5063-13.2014. [DOI] [PMC free article] [PubMed] [Google Scholar]
- Gao W, Cao B, Shan S, Chen X, Zhou D, Zhang X, Zhao D. The CAS-PEAL large-scale Chinese face database and baseline evaluations. IEEE Transactions on Systems, Man, and Cybernetics Part A: Systems and Humans. 2008;38(1):149–161. [Google Scholar]
- Goff P, Eberhardt J, Williams M, Jackson M. Not yet human: Implicit knowledge, historical dehumanization, and contemporary consequences. Journal of Personality and Social Psychology. 2008;94(2):292–306. doi: 10.1037/0022-3514.94.2.292. [DOI] [PubMed] [Google Scholar]
- Goff P, Jackson M, Di Leone B, Culotta C, DiTomasso N. The essence of innocence: Consequences of dehumanizing Black children. Journal of Personality and Social Psychology. 2014;106(4):526–545. doi: 10.1037/a0035663. [DOI] [PubMed] [Google Scholar]
- Guest D, Kent C, Adelman J. Why additional presentations help identify a stimulus. Journal of Experimental Psychology: Human Perception and Performance. 2010;36(6):1609–1630. doi: 10.1037/a0020562. [DOI] [PubMed] [Google Scholar]
- Hackel L, Looser C, Van Bavel J. Group membership alters the threshold for mind perception: The role of social identify, collective identification, and intergroup threat. Journal of Experimental Social Psychology. 2014;52:15–23. [Google Scholar]
- Hahn A, Jantzen K, Symons L. Thatcherizaion impacts the processing of own-race faces more so than other-race faces: An ERP study. Social Neuroscience. 2012;7(2):113–125. doi: 10.1080/17470919.2011.583080. [DOI] [PubMed] [Google Scholar]
- Haslam N. Dehumanization: An integrative review. Personality and Social Psychology Review. 2006;10(3):252–264. doi: 10.1207/s15327957pspr1003_4. [DOI] [PubMed] [Google Scholar]
- Haslam N, Loughnan S. Dehumanization and infrahumanization. Annual Review of Psychology. 2014;65:399–423. doi: 10.1146/annurev-psych-010213-115045. [DOI] [PubMed] [Google Scholar]
- Hewstone M, Rubin M, Wilis H. Intergroup bias. Annual Review of Psychology. 2002;53:575–604. doi: 10.1146/annurev.psych.53.100901.135109. [DOI] [PubMed] [Google Scholar]
- Hugenberg K, Corneille O. Holistic processing is tuned for ingroup faces. Cognitive Science. 2009;33(6):1173–1181. doi: 10.1111/j.1551-6709.2009.01048.x. [DOI] [PubMed] [Google Scholar]
- Hugenberg K, Young S, Bernstein M, Sacco D. The categorization-indivdiuation model: An integrative account of the other-race recognition deficit. Psychological Review. 2010;117(4):1168–1187. doi: 10.1037/a0020463. [DOI] [PubMed] [Google Scholar]
- Hugenberg K, Young S, Rydell R, Almaraz S, Stanko K, See P, Wilson J. The face of humanity: Configural processing influences ascriptions of humanness. Social Psychological and Personality Science. 2016;7(2):167–175. [Google Scholar]
- Jones E, Wood G, Quattrone G. Perceived variability of personal characteristics in in-groups and out-groups: The role of knowledge and evaluation. Personality and Social Psychology Bulletin. 1981;7:523–528. [Google Scholar]
- Kahneman D, Miller D. Norm theory: Comparing reality to its alternatives. Psychological Review. 1986;93:136–153. [Google Scholar]
- Kawakami K, Williams A, Sidhu D, Choma B, Rodriguez-Bailon R, Canadas E, Hugenberg K. An eye for the I: Preferential attention to the eyes of ingroup members. Journal of Personality and Social Psychology. 2014;107(1):1–20. doi: 10.1037/a0036838. [DOI] [PubMed] [Google Scholar]
- Keen S. Faces of the enemy: Reflections of the hostile imagination. San Francisco, CA: Harper & Row; 1986. [Google Scholar]
- Kteily N, Bruneau E, Waytz A, Cotterill S. The ascent of man: Theoretical and empirical evidence for blatant dehumanization. Journal of Personality and Social Psychology. 2015;109(5):901–931. doi: 10.1037/pspp0000048. [DOI] [PubMed] [Google Scholar]
- Kubota J, Li J, Bar-David E, Banaji M, Phelps E. The price of racial bias: Intergroup negotiations in the Ultimatum Game. Psychological Science. 2013;24(12):2498–2504. doi: 10.1177/0956797613496435. [DOI] [PMC free article] [PubMed] [Google Scholar]
- Lee S, Wong N, Alvarez A. The model minority and the perpetual foreigner: Stereotypes of Asian Americans. In: Tewari N, Alvarez A, editors. Asian American psychology: Current perspectives. New York, NY: Routledge/Taylor & Francis Group; 2009. pp. 69–84. [Google Scholar]
- Lin M, Kwan V, Cheung A, Fiske S. Stereotype content model explains prejudice for an envied outgroup: Scale of anti-Asian American stereotypes. Personality and Social Psychology Bulletin. 2005;31(1):34–47. doi: 10.1177/0146167204271320. [DOI] [PubMed] [Google Scholar]
- Linville P, Fischer G, Salovey P. Perceived distributions of the characteristics of in-group and out-group members: Empirical evidence and a computer simulation. Journal of Personality and Social Psychology. 1989;57(2):165–188. doi: 10.1037//0022-3514.57.2.165. [DOI] [PubMed] [Google Scholar]
- Mason M, Cloutier J, Macrae C. On construing others: Category and sereotype activation from facial cues. Social Cognition. 2006;24(5):540–562. [Google Scholar]
- Maurer D, Le Grand R, Mondloch C. The many faces of configural processing. Trends in Cognitive Sciences. 2002;6:255–260. doi: 10.1016/s1364-6613(02)01903-4. [DOI] [PubMed] [Google Scholar]
- Michel C, Corneille O, Rossion B. Race categorization modulates holistic face encoding. Cognitive Science. 2007;31:911–924. doi: 10.1080/03640210701530805. [DOI] [PubMed] [Google Scholar]
- Michel C, Rossion B, Han J, Chung C, Caldara R. Holistic processing finely tuned for faces of one’s own race. Psychological Science. 2006;17:608–615. doi: 10.1111/j.1467-9280.2006.01752.x. [DOI] [PubMed] [Google Scholar]
- Morris S, DeShon R. Combining effect size estimates in meta-analysis with repeated measures and independent-groups designs. Psychological Methods. 2002;7(1):105–125. doi: 10.1037/1082-989x.7.1.105. [DOI] [PubMed] [Google Scholar]
- Mullen B, Hu LT. Perceptions of ingroup and outgroup variability: A meta-analytic integration. Basic and Applied Social Psychology. 1989;10(3):233–252. [Google Scholar]
- Nussbaum M. Sex and social justice. Oxford: EnglandOxford University Press; 1999. Vol. [Google Scholar]
- Oosterhof N, Todorov A. The functional basis of face evaluation. Proceedings of the National Academy of Sciences. 2008;105(32):11087–11092. doi: 10.1073/pnas.0805664105. [DOI] [PMC free article] [PubMed] [Google Scholar]
- Opotow S. Moral exclusion and injustice: An introduction. Journal of Social Issues Policity Review. 1990;46:1–20. [Google Scholar]
- Ostrom T, Sedikides C. Out-group homogeneity effects in natural and minimal groups. Psychological Bulletin. 1992;112(3):536–552. [Google Scholar]
- Park B, Rothbart M. Perception of out-group homogeneity and levels of social categorization: Memory for the subordinate attributes of in-group and out-group members. Journal of Personality and Social Psychology. 1982;42:621–635. [Google Scholar]
- Rhodes G, Brake S, Taylor K, Tan S. Expertise and configural coding in face recognition. British Journal of Psychology. 1989;80(3):313–331. doi: 10.1111/j.2044-8295.1989.tb02323.x. [DOI] [PubMed] [Google Scholar]
- Rule N, Krendl A, Ivcevic Z, Ambady N. Accuracy and consensus in judgments of trustworthiness from faces: Behavioral and neural correlates. Journal of Personality and Social Psychology. 2013;104(3):409–426. doi: 10.1037/a0031050. [DOI] [PubMed] [Google Scholar]
- Rydell R, Stanko K, Krendl A, Cassidy B, Young S, Hugenberg K. Configural processing affects motivation to regulate implicitly measured prejudice toward outgroups. Indiana University; 2017. [Google Scholar]
- Slepian M, Young S, Harmon-Jones E. An approach-avoidance motivational model of trustworthiness judgments. Motivation Science. 2017;3(1):91–97. [Google Scholar]
- Smith D. Less than human: Why we demean, enslave, and exterminate others. Macmillan; 2011. [Google Scholar]
- Stanley D, Sokol-Hessner P, Banaji M, Phelps E. Implicit race attitudes predict trustworthiness judgments and economic trust decisions. Proceedings of the National Academy of Sciences. 2011;108(19):7710–7715. doi: 10.1073/pnas.1014345108. [DOI] [PMC free article] [PubMed] [Google Scholar]
- Stephan W, Boniecki K, Ybarra O, Bettencourt A, Ervin K, Jackson L, Renfro C. The role of threats in the racial attitudes of Blacks and Whites. Personality and Social Psychology Bulletin. 2002;28(9):1242–1254. [Google Scholar]
- Todorov A. Evaluating faces on trustworthiness: An extension of systems for recognition of emotions signaling approach/avoidance behaviors. Annals of the New York Academy of Sciences. 2008;1124:208–224. doi: 10.1196/annals.1440.012. [DOI] [PubMed] [Google Scholar]
- Todorov A, Pakrashi M, Oosterhof N. Evaluating faces on trustworthiness after minimal time exposure. Social Cognition. 2009;27:813–833. [Google Scholar]
- Vezzali L, Capozza D, Stathi S, Giovannini D. Increasing outgroup trust, reducing infrahumanization, and enhancing future contact via imagined intergroup contact. Journal of Experimental Social Psychology. 2012;48:437–440. [Google Scholar]
- Viki G, Osgood D, Phillips S. Dehumanization and self-reported proclivity to torture prisoners of war. Journal of Experimental Social Psychology. 2013;49(3):325–328. [Google Scholar]
- Wheatley T, Weinberg A, Looser C, Moran T, Hajcak G. Mind perception: Real but not artificial faces sustain neural activity beyond the N170/VPP. PloS one. 2011;6(3) doi: 10.1371/journal.pone.0017960. [DOI] [PMC free article] [PubMed] [Google Scholar]
- Wiese H, Stahl J, Schweinberger S. Configural processing of other-race faces is delayed but not decreased. Biological Psychology. 2009;81(2):103–109. doi: 10.1016/j.biopsycho.2009.03.002. [DOI] [PubMed] [Google Scholar]
- Wilson J, Rule N. Facial trustworthiness predicts extreme criminal-sentencing outcomes. Psychological Science. 2015;26(8):1325–1331. doi: 10.1177/0956797615590992. [DOI] [PubMed] [Google Scholar]
- Wilson J, Rule N. Hypothetical sentencing decisions are associated with actual capital punishment outcomes: The role of facial trustworthiness. Social Psychological and Personality Science 2016 [Google Scholar]
- Wilson, J. P., Young, S. G., Rule, N. O., & Hugenberg, K. (under review). Configural processing and social judgments: Face inversion selectively disrupts trustworthiness but not dominance inferences.
- Yin R. Looking at upside-down faces. Journal of Experimental Social Psychology. 1969;81:141–145. [Google Scholar]
Associated Data
This section collects any data citations, data availability statements, or supplementary materials included in this article.