Abstract
Glioblastoma is a stage IV highly invasive astrocytoma tumor. Its heterogeneous appearance in MRI poses critical challenge in diagnosis, prognosis and survival prediction. This work extracts a total of 1207 different types of texture and other features, tests their significance and prognostic values, and then utilizes the most significant features with Random Forest regression model to perform survival prediction. We use 163 cases from BraTS17 training dataset for evaluation of the proposed model. A 10-fold cross validation offers normalized root mean square error of 30% for the training dataset and the cross validated accuracy of 63%, respectively.
1 INTRODUCTION
Glioblastoma (GB) is categorized as a World Health Organization (WHO) stage IV brain cancer that originates in a star-shaped brain cells in the cerebrum called astrocytes [1] [2]. GB is the most invasive brain tumor and its highly diffusive infiltrative characteristics makes glioma a lethal disease [3] with a median survival of 14.6 months with radiotherapy and temozolomide, and 12.1 months with radiotherapy alone [4]. In addition, heterogeneity in GBM [5] poses further challenge not just for diagnosis, but also for prognosis and survival prediction using MR imaging.
In [6], the authors use the different subtype tumor volumes, extent of resection, location, size and other imaging features in order to evaluate the capability of these features in predicting survival. The authors in [7] use comprehensive visual features set known as VASARI (Visually AcceSAble Rembrandt Images) [8] in order to predict survival and correlate these features for genetic alterations and molecular subtypes. In [9], the authors quantify large number of radiomic image features including shape and texture in computed tomography images of lung and head-and-neck cancer patients.
This work discusses overall survival prediction using Random forest regression model based on different structural multiresolution texture features, volumetric, and histogram features. However, accurate representative tumor features requires accurate tumor segmentation. The recent developments in deep learning domain have opened up new avenues in various medical image processing research. Several recent studies [10] [11] apply Convolutional Neural Network (CNN) based deep learning techniques to solve brain tumor segmentation problem successfully. Consequently, this work implements a state-of-the-art CNN architecture following [10] to enhance brain tumor segmentation task.
2 DATASET
In this study, we use MR images of 163 high grade GBM patients with overall survival (in days) data from BtaTS17 training data set [12] [13] (the median age, 61.167 years; range, 18.975–78.762 years). The available scans of the MRI are native (T1), post-contrast T1-weighted (T1Gd), T2-weighted (T2), and T2 Fluid Attenuated Inversion Recovery (FLAIR) volumes. The dataset are co-registered, re-sampled to 1 mm3 and skull-stripped.
3 METHODOLOGY
3.1 Brain tumor segmentation
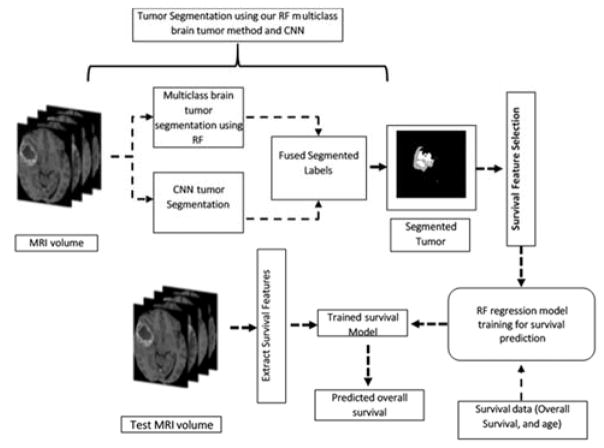
Accurate segmentation of tumor from the MRI is pre-requisite for survival prediction as most potent features are derived from the affected region. Fig. 1 shows the complete pipeline for survival prediction. Note this paper primarily explains the proposed survival model.
Fig. 1.
Pipeline for tumor segmentation and survival prediction.
Our previous works on multiclass MRI brain tumor segmentation using texture based features [14] [15] have yielded important results. The detail description of multiclass abnormal brain tumor segmentation is found in [14] [15]. Our texture features are extracted from raw (T1Gd, T2, and Flair) modalities tumor volumes. The texture representations are piecewise triangular prism surface area (PTPSA) [16], multifractional Brownian motion (mBm) [17], Generalized multifrational Brownian motion (GmBm) [18] [19], and five representations of Texton filters [20], respectively. This work further improves the segmentation performance by employing a two-stage process in which the outcomes from the deep learning based method are fused with that of a handcrafted feature based method that utilizes Random Forest (RF) for the classification task.
The input to the CNN are image patches where the 3rd dimension is comprised of the four MRI modalities: T1, T1Gd, T2, and FLAIR. The output of CNN is the classification of five tissues such as background, enhanced tumor, edema, necrosis and non-enhanced tumor, respectively. All the inputs to the CNN are pre-processed with N4-ITK bias correction, and intensity normalization for inter-volume consistency [10]. The training set is image patches randomly obtained from the BRATS 2017 training MRI volume set. The sufficiently trained CNN is subsequently used for the segmentation of testing data as shown in Fig. 1.
3.2 Survival Prediction
In this study we address the association between structural multiresolution texture features and overall survival. We extract 42 features from each raw MRI modality and texture representation of the whole tumor volume. These features are described by histogram, the co-occurrence matrix (measure the texture of image), the neighborhood gray tone difference matrix (measure a grayscale difference between pixels with certain grayscale and their neighboring pixels) and the run length matrix (capture the coarseness of a texture). In addition, we extract 5 volumetric and 6 histogram features from the tumor and the different tumor sub-regions (edema, enhancing tumor, and tumor core). Further, the tumor locations and the spread of the tumor in the brain are also considered. Finally, 9 area properties are extracted from the whole tumor from three viewpoints (view are set along x, y and z axis).
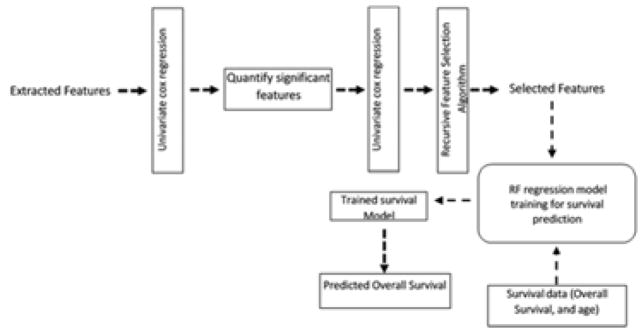
Feature selection is performed in three steps; first significant features were selected using a univariate cox regression model. Then, another univariate cox regression is applied on the quantified significant features. This ensure that these features are able to split the dataset into short vs. long survival. A total of two hundred and forty (240) features out of one thousand and two hundred and seven (1207) features (~ 20 % of the total extracted features) are found to be significant in the previous two feature selection steps.
Finally, the two hundred and forty features are reduced to forty significant features using a recursive feature selection algorithm. Fig. 2 shows the steps of feature selection and survival prediction. The selected features are then fed into Radom Forest regression model [21] for survival prediction.
Fig. 2.
Feature selection steps and survival model Pipeline
4 EXPERIMENTAL RESULTS
We perform tenfold cross-validation on survival prediction features extracted from the ground truth, which is available with the BraTS17 training dataset (163 patients), in order to evaluate the performance of the proposed RF survival regression model. We use the normalized root mean square error (NRMSE) of the overall survival predicted values as metric for evaluation. However, the survival prediction features are extracted from the fused segmented tumor using the BraTS17 validation dataset as described in Fig. 1.
The cross validated NRMSE of the training dataset is 30%. In addition, to evaluate the performance of the survival model based on classification, the overall survival is divided into three classes (long, medium and short) survivors corresponds to (>15 months, >10 months and <15 months, <10months), respectively. The cross validated accuracy is 63%. At the time of writing this paper, the evaluation of the validation dataset is not available.
5 Conclusion
In this work, we present a complete pipeline to perform survival prediction starting with brain tumor segmentation. The method uses BraTS17 validation dataset in a two-stage process for segmentation in which the outcomes from the deep learning based method are fused with that of our handcrafted feature based method. The segmented tumor volumes along with other volumetric, and histogram features are used in an RF regression model for survival prediction. We achieve cross validated NRMSE of 30% on the BraTS17 dataset and cross validated accuracy of 63%, respectively.
Acknowledgments
This work was funded by NIBIB/NIH grant# R01 EB020683.
References
- 1.Louis DN, Ohgaki H, Wiestler OD, Cavenee WK, Burger PC, Jouvet A, Scheithauer BW, Kleihues The 2007 WHO Classification of Tumours of the Central Nervous System. Acta Neuropathologica. 2007;114(2):97–109. doi: 10.1007/s00401-007-0243-4. [DOI] [PMC free article] [PubMed] [Google Scholar]
- 2.Kliehues P, Burger PC, Collins VP, Newcombe EW, Ohgaki H, Cavenee WK. WHO Classification of Tumours: Pathology and Genetics of Tumours of the Nervous System. Lyon, France: International Agency for Research on Cancer; 2000. Glioblastoma; pp. 29–39. [Google Scholar]
- 3.Claes A, Idema AJ, Wesseling P. Diffuse Glioma Growth: a Guerilla War. Acta Neuropathologica. 2007;114(5):443–458. doi: 10.1007/s00401-007-0293-7. [DOI] [PMC free article] [PubMed] [Google Scholar]
- 4.Stupp R, Mason WP, van den Bent MJ, Weller M, Fisher B, Taphoorn MJB, Belanger K, Brandes Alba A, et al. Radiotherapy plus Concomitant and Adjuvant Temozolomide for Glioblastoma. New England Journal of Medicine. 2005;352(10):987–996. doi: 10.1056/NEJMoa043330. [DOI] [PubMed] [Google Scholar]
- 5.Soeda A, Hara A, Kunisada T, Yoshimura S, Iwama T, Park DM. The Evidence of Glioblastoma Heterogeneity. Scientific Reports. 2015;5:9630. doi: 10.1038/srep07979. [DOI] [PMC free article] [PubMed] [Google Scholar]
- 6.Pope WB, Sayre J, Perlina A, Pa Villablanca J, Mischel PS, Cloughesy TF. MR Imaging Correlates of Survival in Patients with High-Grade Gliomas. American Journal of Neuroradiology. 2005;26(10):2466–2474. [PMC free article] [PubMed] [Google Scholar]
- 7.Gutman DA, Cooper LA, Hwang SN, Hwang SN, Holder CA, et al. MR Imaging Predictors of Molecular Profile and Survival: Multi-institutional Study of the TCGA Glioblastoma Data Set. Radiology. 2013;267(2):560–569. doi: 10.1148/radiol.13120118. [DOI] [PMC free article] [PubMed] [Google Scholar]
- 8.VASARI Research Project - Cancer Imaging Archive Wiki. [Online]. Available: https://wiki.cancerimagingarchive.net/display/Public/VASARI+Research+Project.
- 9.Aerts HJWL, Velazquez ER, Leijenaar RTH, Parmar C, Grossmann P, et al. Decoding Tumour Phenotype by Noninvasive Imaging Using a Quantitative Radiomics Approach. Nature Communications. 2014;5 doi: 10.1038/ncomms5006. [DOI] [PMC free article] [PubMed] [Google Scholar]
- 10.Pereira S, Pinto A, Alves V, Silva CA. Brain Tumor Segmentation Using Convolutional Neural Networks in MRI Images. IEEE transactions on medical imaging. 2016;35:1240–1251. doi: 10.1109/TMI.2016.2538465. [DOI] [PubMed] [Google Scholar]
- 11.Havaei M, Davy A, Warde-Farley D, Biard A, Courville A, Bengio Y, et al. Brain tumor segmentation with deep neural networks. Medical Image Analysis. 2016 doi: 10.1016/j.media.2016.05.004. [DOI] [PubMed] [Google Scholar]
- 12.Menze BH, et al. The Multimodal Brain Tumor Image Segmentation Benchmark (BRATS) IEEE Transactions on Medical Imaging. 2015;34(10):1993–2024. doi: 10.1109/TMI.2014.2377694. [DOI] [PMC free article] [PubMed] [Google Scholar]
- 13.Bakas S, Akbari H, Sotiras A, Bilello M, Rozycki M, Kirby JS, Freymann JB, Farahani K, Davatzikos C. Advancing The Cancer Genome Atlas Glioma MRI Collections with Expert Segmentation Labels and Radiomic Features. Nature Scientific Data. 2017 doi: 10.1038/sdata.2017.117. [DOI] [PMC free article] [PubMed] [Google Scholar]
- 14.Ahmed S, Iftekharuddin KM, Vossough A. Efficacy of Texture, Shape, and Intensity Feature Fusion for Posterior-Fossa Tumor Segmentation in MRI. IEEE Transactions on Information Technology in Biomedicine. 2011;15:206–213. doi: 10.1109/TITB.2011.2104376. [DOI] [PubMed] [Google Scholar]
- 15.Reza S, Iftekharuddin KM. Multi-fractal texture features for brain tumor and edema segmentation. SPIE, Medical Imaging 2014: Computer-Aided Diagnosis; San Diego, California. 2014. [Google Scholar]
- 16.Iftekharuddin KM, Jia W, Marsh R. Fractal analysis of tumor in brain images. Machine Vision and Applications. 2003;13:352–362. [Google Scholar]
- 17.Islam A, Reza SMS, Iftekharuddin KM. Multifractal Texture Estimation for Detection and Segmentation of Brain Tumors. IEEE Transactions of Biomedical Engineering. 2013;60(11):3204–3215. doi: 10.1109/TBME.2013.2271383. [DOI] [PMC free article] [PubMed] [Google Scholar]
- 18.Ayache A, Vehel JL. Generalized Multifractional Brownian Motion: Definition and Preliminary Results. Theory and Applications in Engineering. 1999:17–32. [Google Scholar]
- 19.Ayache A, Vehel JL. On the Identificaiton of the Pointwise Holder Exponent of the Generalized Multifractional Brownian Motion. Stochastic Process Application. 2004;111:119–156. [Google Scholar]
- 20.Leung T, Jitendra M. Representing and Recognizing the Visual Appearance of Materials using Three-dimensional Textons. International Journal of Computer Vision. 2001;43:29–44. [Google Scholar]
- 21.caret: Classification and Regression Training. [Online]. Available: https://CRAN.R-project.org/package=caret.


