

Abstract
Purpose
The PROMIS-29 v2.0 profile assesses pain intensity using a single 0–10 numeric rating item and seven health domains (physical function, fatigue, pain interference, depressive symptoms, anxiety, ability to participate in social roles and activities, and sleep disturbance) using four items per domain. This paper describes the development of physical and mental health summary scores for the PROMIS-29 v2.0.
Method
We conducted factor analyses of PROMIS-29 scales on data collected from two internet panels (n = 3,000 and 2,000).
Results
Confirmatory factor analyses provided support for a physical health factor defined by physical function, pain (interference and intensity), and ability to participate in social roles and activities, and a mental health factor defined primarily by emotional distress (anxiety and depressive symptoms). Reliabilities for these two summary scores were 0.98 (physical health) and 0.97 (mental health). Correlations of the PROMIS-29 v2.0 physical and mental health summary scores with chronic conditions and other health-related quality of life measures were consistent with a-priori hypotheses.
Conclusions
This study develops and provides preliminary evidence supporting the reliability and validity of PROMIS-29 v2.0 physical and mental health summary scores that can be used in future studies to assess impacts of health care interventions and track changes in health over time. Further evaluation of these and alternative summary measures is recommended.
Keywords: physical health, mental health, patient-reported, PROMIS®, PROMIS®-29 profile
Introduction
The Patient-Reported Outcomes Measurement Information System (PROMIS®) is a National Institutes of Health initiative to develop state-of-the-science self-report measures to assess functioning and well-being in physical, mental and social domains of health [1]. PROMIS measures are potentially useful to screen for disability, identify health care disparities, enhance communication between patients and clinicians, and improve population health. Moreover, self-reported health is predictive of health care utilization [2] and subsequent mortality [3–4].
PROMIS includes item banks that can be administered using computer-adaptive testing [5], short forms for individual domains [6], and profiles that yield information about multiple domains for use in clinical trials, observational studies, and clinical practice [7–9]. The PROMIS-29 v2.0 profile measure assesses pain intensity using a single 0–10 numeric rating item and seven health domains (physical function, fatigue, pain interference, depressive symptoms, anxiety, ability to participate in social roles and activities, and sleep disturbance) using four items for each domain. The PROMIS-29 v2.0 profile measure is analogous to the most widely used profile measure to date, the SF-36. But the PROMIS-29 v2.0 profile items were selected from PROMIS item banks [10–15] calibrated using item response theory (IRT) analyses and all items in a domain are scored on the same underlying metric.
While profile measures yield a wealth of information, higher-order summary measures are also useful [16]. Factor analyses of scale scores for the SF-36 health survey, provided strong support for two underlying factors with physical health defined primarily by measures of physical functioning, pain, and role limitations due to physical health problems, and by mental health reflected primarily by measures of emotional well-being and role limitations caused by emotional problems [17–18]. General health perceptions, vitality, and social functioning represent both physical and mental health about equally.
This paper presents the development of physical and mental health summary scores for the PROMIS-29 v2.0. Based on previous work [17–20], we hypothesized that physical health would be primarily represented by physical function and pain. In addition, we hypothesized that mental health would be indicated primarily by depressive symptoms, anxiety and sleep disturbance, and to some extent by ability to participate in social roles and activities, and pain. We expected fatigue to be indicative of both physical and mental health.
Method
Participants
Sample 1
We administered by internet the PROMIS-29 v2.0 profile measures to a sample of 3,000 Opinions 4 Good (Op4G) panel members [21]. Op4G maintains a US national sample, and participants are required to update demographic information regularly. The sample was 51% female, 60% non-Hispanic White, 17% Hispanic, 14% non-Hispanic Black, 9% Asian, and 1% other race/ethnicity. The average age was 46 and ranged from 18–88 years old. Twenty-seven percent had a college degree, 28% had some college, 31% were high school graduates, and 14% reported less than a high school education. Fifty-seven percent were married or living with a partner, 30% were never married, 10% separated or divorced, and 3% widowed.
Sample 2
Toluna/Greenfield internet panel members [22] were sent e-mail invitations to obtain responses from 2000 participants. Panelists were given a link that took them to a secure Web site where the survey was administered, after they provided consent. The sample was 50% female, 81% non-Hispanic White, 6% Hispanic, 7% non-Hispanic Black, 4% Asian, and 2% other race/ethnicity. The average age was 52 and the range was 18–93 years old. Thirty percent had a college degree, 42% had some college, 25% were high school graduates, and 3% reported less than a high school education. Fifty-six percent were married or living with a partner, 20% were never married, 14% separated or divorced, and 10% widowed.
Measures
Sample 1 was administered the PROMIS-29 v2.0 profile that assesses social health using the Ability to Participate in Social Roles and Activities scale (Short Form 4a) while Sample 2 was administered the PROMIS-29 v1.0 profile that uses the Satisfaction with Participation in Social Roles scale (Short form 4a). PROMIS-29 scales are scored using a T-score metric via Assessment Center (see www.assessmentcenter.net and https://www.youtube.com/watch?v=KM2FqYoS--A). The pain intensity item asks In the last 7 days, how would you rate your pain on average? The response scale is 0 (no pain) to 10 (worst imaginable pain). While this 0–10 item has been collapsed to 5 categories (0 = 1; 1–3 = 2; 4–6 = 3; 7–9 = 4; 10 = 5) in some prior PROMIS studies [18], we preserved the 11 categories of information.
Both samples provided self-reports of demographic characteristics (age and gender) and chronic conditions: hypertension, angina, coronary artery disease, heart failure, heart attack, stroke, liver disease, kidney disease, arthritis, migraines, asthma, chronic lung disease, diabetes, cancer, depression, anxiety, alcohol or drug problem, sleep disorder, HIV/AIDS, spinal cord injury, and multiple sclerosis (Sample 2 did not include spinal cord injury). Sample 1 included the HUI-3 [23] and PROMIS global health items [24]. The EQ-5D-3L was estimated from the PROMIS global health items [25]. Sample 2 included the SF-36 v2 [26] and we estimated the SF-6D from it [27].
Statistical Analyses
We estimate internal consistency reliability [28] and item response theory estimates of marginal reliability for the 7 PROMIS-29 v2.0 multi-item scales. Marginal (empirical) reliability was estimated by calculating the ratio of the average of the squared standard errors of observed expected a-posterior (EAP) scores over the observed EAP score variance and subtracting that ratio from one.
Because the underlying structure of the PROMIS-29 scales was unknown, we performed exploratory factor analyses. We examined multiple number of factor criteria (Guttman’s weakest lower bound, scree test, Tucker and Lewis reliability coefficients), followed by Promax factor rotation [29–30].
Then, we conducted confirmatory factor analyses. To minimize local dependence among variables, we created a pain composite by averaging z-scores for the pain intensity item and pain interference scale, and we created an emotional distress composite by averaging z-scores for the depressive symptoms and anxiety scales. We fit a correlated two-factor model (physical and mental health) using maximum likelihood estimation. The practical fit of the model was evaluated using the comparative fit index (CFI) and the Root Mean Square Error of Approximation (RMSEA). Good model fit was defined by a CFI>0.95 and RMSEA < 0.06 [31].
We estimated associations of the PROMIS-29 v2.0 physical and mental health summary scores with the other measures of health-related quality of life, number of chronic conditions, and demographic characteristics in the two samples. The EQ-5D-3L and HUI-3 are preference-based measures designed to summarize health-related quality of life in a single score where 0 is dead and 1 is perfect or optimal health. We hypothesized that the PROMIS-29 v2.0 summary scores would be significantly positively associated with estimates of the EQ-5D-3L and HUI-3 scores and negatively associated with the number of chronic conditions. We hypothesized that these associations would be larger than 0.371, which is equivalent to a 0.80 SD (“large”) effect size. We also hypothesized that the PROMIS-29 v2.0 physical health summary score would be more strongly associated with the SF-36 physical component summary score than with the SF-36 mental health component summary score, and that the PROMIS-29 v2.0 mental health summary score would be more strongly associated with the SF-36 mental health component summary score than with the SF-36 physical health component summary score.
SAS version 9.4 was used for most of the analyses while confirmatory factor analyses were estimated using Mplus Version 7 [32].
Results
Internal consistency and marginal reliability estimates, respectively, for the PROMIS-29 scales were as follows: physical function (Sample 1: 0.91 and 0.78; Sample 2: 0.93 and 0.73), fatigue (Sample 1: 0.91 and 0.91; Sample 2: 0.95 and 0.91), pain interference (Sample 1: 0.94 and 0.85; Sample 2: 0.86 and 0.83), depressive symptoms (Sample 1: 0.93 and 0.86; Sample 2: 0.95 and 0.80), anxiety (Sample 1: 0.90 and 0.87; Sample 2: 0.91 and 0.80), ability to participate in social roles and activities/satisfaction with participation in social roles (Sample 1: 0.93 and 0.0.90; Sample 2: 0.96 and 0.90), and sleep disturbance (Sample 1: 0.77 and 0.82; Sample 2: 0.88 and 0.85). Product-moment correlations among the PROMIS-29 scales and pain intensity item are provided in Appendix Table 1. These correlations ranged from −0.40 (physical function and sleep disturbance) to 0.82 (anxiety and depressive symptoms).
Appendix Table 1.
Product-Moment Correlations Among PROMIS-29 Scales and Pain Intensity Item in Sample 1 (top) and Sample 2 (bottom)
| Pain interference | Physical function | Pain intensity | Ability to participate in social roles | Anxiety | Depressive symptoms | Fatigue | |
|---|---|---|---|---|---|---|---|
| Pain interference | 1.00 | ||||||
| Physical function | −.74 | 1.00 | |||||
| Pain intensity | 0.67 | −.56 | 1.00 | ||||
| Ability to participate in social roles | −.75 | 0.73 | −.54 | 1.00 | |||
| Anxiety | 0.59 | −.50 | 0.45 | −.64 | 1.00 | ||
| Depressive symptoms | 0.59 | −.50 | 0.45 | −.63 | 0.82 | 1.00 | |
| Fatigue | 0.67 | −.59 | 0.52 | −.71 | 0.64 | 0.63 | 1.00 |
| Sleep disturbance | 0.49 | −.40 | 0.42 | −.47 | 0.47 | 0.48 | 0.54 |
| Pain interference | Physical function | Pain intensity | Satisfaction with participation in social roles | Anxiety | Depressive symptoms | Fatigue | |
|---|---|---|---|---|---|---|---|
| Pain interference | 1.00 | ||||||
| Physical function | −.60 | 1.00 | |||||
| Pain intensity | 0.78 | −.63 | 1.00 | ||||
| Satisfaction with participation in social roles | −.49 | 0.62 | −.54 | 1.00 | |||
| Anxiety | 0.40 | −.31 | 0.43 | −.45 | 1.00 | ||
| Depressive symptoms | 0.40 | −.34 | 0.44 | −.48 | 0.81 | 1.00 | |
| Fatigue | 0.55 | −.55 | 0.58 | −.61 | 0.58 | 0.62 | 1.00 |
| Sleep disturbance | 0.43 | −.35 | 0.48 | −.52 | 0.49 | 0.53 | 0.62 |
Guttman’s weakest lower bound in sample 1 indicated a single factor (eigenvalues were 5.08, 0.81, 0.64, 0.49, 0.35, 0.23, 0.22, and 0.18). A scree plot of eigenvalues based on squared multiple correlations as communality estimates (4.71, 0.46, 0.09, 0.05) suggested a single dimension, but Tucker and Lewis’s reliability coefficients provided support for two underlying dimensions (0.82 for one factor, 0.95 for two factors, and 0.97 for three factors).
In Sample 2, Guttman’s weakest lower bound (eigenvalues of 4.67, 1.14, 0.61, 0.54, 0.34, 0.29, 0.22, and 0.19) and a scree plot of eigenvalues based on squared multiple correlations as communality estimates (4.28, 0.78, 0.20, 0.07) suggested two dimensions. Tucker and Lewis’s reliability coefficients indicated the possibility of more than two underlying dimensions (0.66 for one factor, 0.87 for two factors, and 0.94 for three factors).
The two-factor rotated solution for the PROMIS-29 scales showed that the first factor (physical health) was represented by pain interference, physical function, pain intensity, and ability to participate in social roles and activities/satisfaction with participation in social roles and the second factor (mental health) was defined by anxiety and depressive symptoms. Consistent with previous research [19], fatigue and sleep disturbance loaded about equally on both factors (factor loading matrix available upon request).
Based on the results of the exploratory analyses, we evaluated a confirmatory factor analytic model with two factors (physical and mental health) using maximum likelihood estimation in Sample 1. This model fit the data well (Sample 1 and 2, respectively: CFI = 0.99 and 0.99; RMSEA = 0.06 and 0.01, 90% CI 0.05–0.07 and 0.00–0.04) and parameter estimates from Sample 1 are shown in Table 1. We estimated factor scores using the standard regression method with a normal prior. Scores are based on the factor scoring coefficients from Sample 1 and z-scores derived from the PROMIS T-score mean (50) and standard deviation (10). The estimated reliabilities [33] of the PROMIS-29 v2.0 physical health summary scores were 0.93 (Sample 1) and 0.95 (Sample 2). For the PROMIS-29 v2.0 mental health summary score reliability estimates were 0.97 (Sample 1) and 0.98 (Sample 2).
Table 1.
Standardized Factor Loadings and Scoring Coefficients (in parentheses) from Confirmatory Factor Analysis Model in Sample 1
| Item | Physical | Mental |
|---|---|---|
| Physical function | 0.95 (0.87) |
0.00& (−.015) |
| Pain* | −0.42 (−.09) |
−0.46 (−.15) |
| Ability to participate in social roles and activities | 0.38 (0.11) |
0.56 (0.25) |
| Fatigue | −0.05 (−.01) |
−0.82 (−.35) |
| Emotional distress** | 0.00& (0.003) |
−0.80 (−.26) |
| Sleep disturbance | 0.00& (0.002) |
−0.62 (−.14) |
Pain is average of pain intensity item and pain interference scale.
Emotional distress is average of anxiety and depressive symptoms.
Fixed.
Note: Estimated correlation among physical and mental health factors was 0.694
Table 2 provides product-moment correlations of the PROMIS-29 v2.0 physical health and mental health summary scores in Sample 1 with the EQ-5D-3L, HUI-3 preference-based score, the HUI-3 single attribute utilities, number of chronic conditions, gender, and age. The correlations are either similar in magnitude or higher with the PROMIS-29 v2.0 physical health summary score than with the PROMIS-29 v2.0 mental health summary score except for the HUI-3 emotion attribute. Male gender, number of chronic conditions, and age were significantly negatively associated with the PROMIS-29 v2.0 physical and mental health summary scores.
Table 2.
Product-moment Correlations of PROMIS-29 v2.0 Physical and Mental Health Summary Scales with Other Health Variables in Sample 1 (p<.0001 except where noted)
| Measure | PROMIS-29 Physical Health | PROMIS-29 Mental Health |
|---|---|---|
| EQ-5D-3L* | 0.82 | 0.73 |
| HUI-3 | 0.73 | 0.67 |
| Ambulate | 0.54 | 0.39 |
| Dexterity | 0.41 | 0.36 |
| Emotion | 0.43 | 0.56 |
| Cognition | 0.52 | 0.52 |
| Pain | 0.61 | 0.44 |
| Vision | 0.28 | 0.25 |
| Hearing | 0.35 | 0.31 |
| Speech | 0.38 | 0.37 |
| Number of Chronic Conditions** | −0.50 | −0.45 |
| Male gender | −0.07 | −0.05 (p=0.0071) |
| Age | −0.06 (p= 0.0005) |
−0.08 |
Predicted from PROMIS global health items (Revicki et al., 2009)
Hypertension, angina, coronary artery disease, heart failure, heart attack, stroke, liver disease, kidney disease, arthritis, migraines, asthma, chronic lung disease, diabetes, cancer, depression, anxiety, alcohol or drug problem, sleep disorder, HIV/AIDS, spinal cord injury, and multiple sclerosis.
Table 3 shows product-moment correlations of the PROMIS-29 v2.0 physical health and mental health summary scores with the SF-36 scales, SF-36 physical and mental component summary scores, number of chronic conditions, gender, and age in Sample 2. The correlations are either similar in magnitude or higher with the PROMIS-29 v2.0 physical health summary score than with the PROMIS-29 v2.0 mental health summary score except for the SF-36 vitality scale, SF-36 mental health scale, the SF-36 mental component summary score, and age. Note that the PROMIS-29 v2.0 physical health summary score correlated 0.82 with the SF-36 physical component summary score versus 0.54 with the SF-36 mental component summary score, and the PROMIS-29 v2.0 mental health summary score correlated 0.82 with the SF-36 mental component summary score versus 0.38 with the SF-36 physical component summary score. Female gender, number of chronic conditions, and age were significantly negatively associated with the PROMIS-29 v2.0 physical and mental health summary scores.
Table 3.
Product-moment Correlations of PROMIS-29 v2.0 Physical and Mental Health Summary Scales with Other Health Variables in Sample 2 (p<.0001 except where noted)
| Measure | PROMIS-29 Physical Health | PROMIS-29 Mental Health |
|---|---|---|
| SF-36 physical function | 0.74 | 0.40 |
| SF-36 role-physical | 0.79 | 0.57 |
| SF-36 bodily pain | 0.84 | 0.53 |
| SF-36 general health | 0.72 | 0.59 |
| SF-36 vitality | 0.72 | 0.72 |
| SF-36 social function | 0.70 | 0.68 |
| SF-36 role-emotional | 0.62 | 0.52 |
| SF-36 mental health | 0.53 | 0.80 |
| SF-36 physical component summary score | 0.82 | 0.38 |
| SF-36 mental component summary score | 0.54 | 0.82 |
| SF-6D | 0.80 | 0.74 |
| Number of chronic conditions* | −0.53 | −0.42 |
| Male gender | 0.06 | 0.07 (p=0.0017) |
| Age | −0.04 (p=.0558) |
0.25 |
Hypertension, angina, coronary artery disease, heart failure, heart attack, stroke, liver disease, kidney disease, arthritis, migraines, asthma, chronic lung disease, diabetes, cancer, depression, anxiety, alcohol or drug problem, sleep disorder, HIV/AIDS, and multiple sclerosis.
Appendix Table 2 provides means scores on the PROMIS-29 v2.0 summary scores in Sample 1 by different chronic conditions. Those with a chronic condition scored significantly worse on the PROMIS-29 v2.0 physical health summary score than those without the condition (p<0.0010). Significantly worse PROMIS-29 v2.0 mental health summary scores were reported by those with all of the chronic conditions except for cancer.
Appendix Table 2.
Mean Scores on PROMIS-29 V 2.0 Physical and Mental Health Summary Scores by Chronic Conditions in Sample 1
| Condition | Physical Health | Mental Health | ||||
|---|---|---|---|---|---|---|
| Without condition | With condition | t-test | Without condition | With condition | t-test | |
| Ever told by doctor you have … | ||||||
| High blood pressure (hypertension) | 47.3 (9.4) n = 1975 | 43.0 (9.3) n = 1024 | t(2997)= 11.7, p <.0001 | 47.8 (9.3) n = 1975 | 45.0 (9.3) n = 1024 | t(2997)= 8.0, p <.0001 |
| Chest pain (angina) | 46.6 (9.5) n = 2705 | 39.1 (7.6) n = 294 | t(401.4)= 15.6, p <.0001 | 47.5 (9.3) n = 2705 | 40.7 (7.5) n = 294 | t(397.7)= 14.4, p <.0001 |
| Hardening of the arteries (CAD) | 46.2 (9.6) n = 2866 | 38.1 (7.1) n = 133 | t(155.4)= 12.6, p <.0001 | 47.1 (9.4) n = 2866 | 41.3 (7.8) n = 133 | t(2997)= 7.1, p <.0001 |
| Heart failure or congestive heart failure | 46.2 (9.6) n = 2888 | 36.8 (5.7) n = 111 | t(134.6)= 16.4, p <.0001 | 47.2 (9.4) n = 2888 | 39.6 (6.6) n = 111 | t(127.5)= 11.5, p <.0001 |
| Heart attack (myocardial infarction) | 46.2 (9.6) n = 2859 | 39.3 (8.1) n = 140 | t(2997)= 8.4, p <.0001 | 47.1 (9.4) n = 2859 | 42.3 (8.0) n = 140 | t(2997)= 5.9, p <.0001 |
| Stroke or transient ischemic attack (TIA) | 46.1 (9.5) n = 2913 | 37.6 (7.6) n = 86 | t(2997)= 8.1, p <.0001 | 47.1 (9.4) n = 2913 | 40.1 (7.7) n = 86 | t(2997)= 6.8, p <.0001 |
| Liver disease, hepatitis, or cirrhosis | 46.1 (9.6) n = 2895 | 38.5 (7.8) n = 104 | t(2997)= 8.0, p <.0001 | 47.1 (9.4) n = 2895 | 41.3 (7.9) n = 104 | t(2997)= 6.2, p <.0001 |
| Kidney disease | 46.1 (9.6) n = 2899 | 37.6 (6.7) n = 100 | t(113.2)= 12.1, p <.0001 | 47.1 (9.4) n = 2899 | 40.2 (7.0) n = 100 | t(111.7)= 9.5, p <.0001 |
| Arthritis or rheumatism | 47.2 (9.4) n = 2397 | 40.6 (8.5) n = 602 | t(1005)= 16.7, p <.0001 | 47.9 (9.3) n = 2397 | 42.9 (8.7) n = 602 | t(2997)= 11.9, p <.0001 |
| Migraines or severe headaches | 46.4 (9.6) n = 2520 | 43.0 (9.2) n = 479 | t(2997)= 7.1, p <.0001 | 47.7 (9.3) n = 2520 | 42.4 (8.8) n = 479 | t(2997)= 11.7, p <.0001 |
| Asthma | 46.5 (9.6) n = 2502 | 42.5 (9.0) n = 497 | t(2997)= 8.5, p <.0001 | 47.5 (9.4) n = 2502 | 43.6 (8.8) n = 497 | t(2997)= 8.4, p <.0001 |
| Chronic lung disease (COPD), chronic bronchitis or emphysema | 46.3 (9.5) n = 2837 | 38.1 (7.5) n = 162 | t(191.8)= 13.2, p <.0001 | 47.2 (9.4) n = 2837 | 41.0 (8.2) n = 162 | t(2997)= 8.2, p <.0001 |
| Diabetes or high blood sugar or sugar in your urine | 46.5 (9.5) n = 2678 | 40.8 (9.2) n = 321 | t(2997)= 10.2, p <.0001 | 47.3 (9.4) n = 2678 | 43.5 (8.9) n = 321 | t(2997)= 6.8, p <.0001 |
| Cancer (other than non-melanoma skin cancer) | 46.0 (9.6) n = 2860 | 43.2 (9.3) n = 139 | t(2997)= 3.3, p <0.0010 | 46.9 (9.43) n = 2860 | 46.0 (8.6) n = 139 | t(2997)= 1.1, p=0.2412 |
| Depression | 47.0 (9.6) n = 2267 | 42.1 (8.7) n = 732 | t(1344.5)= 12.9, p <.0001 | 48.8 (9.0) n = 2267 | 40.8 (8.0) n = 732 | t(1372.6)= 22.8, p <.0001 |
| Anxiety | 46.6 (9.6) n = 2357 | 43.2 (9.1) n = 642 | t(2997)= 8.0, p <.0001 | 48.4 (9.2) n = 2357 | 41.3 (8.0) n = 642 | t(1140.7)= 19.4, p <.0001 |
| Alcohol or drug problem | 46.1 (9.6) n = 2847 | 40.6 (7.6) n = 152 | t(177.5)= 8.4, p <.0001 | 47.2 (9.4) n = 2847 | 40.6 (7.2) n = 152 | t(179.7)= 10.8, p <.0001 |
| Sleep disorder | 46.5 (9.5) n = 2597 | 41.4 (8.8) n = 402 | t(2997)= 10.0, p <.0001 | 47.8 (9.2) n = 2597 | 40.7 (8.0) n = 402 | t(582.1)= 16.3, p <.0001 |
| HIV or AIDS | 46.0 (9.6) n = 2956 | 38.4 (7.5) n = 43 | t(2997)= 5.1, p <.0001 | 47.0 (9.4) n = 2956 | 40.7 (7.7) n = 43 | t(2997)= 4.3, p <.0001 |
| Spinal cord injury | 46.1 (9.5) n = 2917 | 36.0 (6.2) n = 82 | t(92.1)= 14.2, p <.0001 | 47.1 (9.4) n = 2917 | 39.3 (5.9) n = 82 | t(93)= 11.5, p <.0001 |
| Multiple Sclerosis | 46.1 (9.6) n = 2932 | 36.3 (4.5) n = 67 | t(80.6)= 16.9, p <.0001 | 47.0 (9.4) n = 2932 | 41.3 (6.9) n = 67 | t(71.7)= 6.5, p <.0001 |
Appendix Table 3 shows that those with a condition that was limiting their current activities, or the impact of current activities was unknown (i.e., question about impact on current activities was not answered) scored worse on the PROMIS-29 v2.0 physical and mental health summary scores than those without the condition.
Appendix Table 3.
Mean Scores on PROMIS-29 Physical and Mental Health Summary Scores by Limited by Chronic Conditions in Sample 1
| Condition | Physical Health | ||||
|---|---|---|---|---|---|
| Does not have condition | With condition, no limitation | With condition, unknown limitation | With condition, is limited | ANOVA | |
| Current activities limited by.. | |||||
| High blood pressure (hypertension) | 47.3a n = 1975 |
45.7a n = 637 |
35.5b n = 14 |
38.8b n = 373 |
F(3,2995)=96.7, p<.0001 |
| Chest pain (angina) | 46.6a n = 2705 |
42.5ab n = 99 |
33.8c n = 3 |
37.5bc n = 192 |
F(3,2995)=63.4, p<.0001 |
| Hardening of the arteries (CAD) | 46.2a n = 2866 |
41.8b n = 51 |
n=0 | 35.9c n = 82 |
F(2,2996)=52.5, p<.0001 |
| Heart failure or congestive heart failure | 46.2a n = 2888 |
39.2ab n = 33 |
35.2b n = 2 |
35.7b n = 76 |
F(3,2995)=36.8, p<.0001 |
| Heart attack (myocardial infarction) | 46.2a n = 2859 |
41.2ab n = 62 |
34.1c n = 8 |
38.1bc n = 70 |
F(3,2995)=25.6, p<.0001 |
| Stroke or transient ischemic attack (TIA) | 46.1a n = 2913 |
41.3b n = 34 |
33.7c n = 17 |
35.9c n = 35 |
F(3,2995)=25.4, p<.0001 |
| Liver disease, hepatitis, or cirrhosis | 46.1a n = 2895 |
41.4b n = 46 |
34.0c n = 24 |
37.7bc n = 34 |
F(3,2995)=25.0, p<.0001 |
| Kidney disease | 46.1a n = 2899 |
41.3b n = 35 |
34.5c n = 17 |
36.1c n = 48 |
F(3,2995)=28.7, p<.0001 |
| Arthritis or rheumatism | 47.2a n = 2397 |
47.3a n = 162 |
34.5c n = 46 |
38.5b n = 394 |
F(3,2995)=130.2, p<.0001 |
| Migraines or severe headaches | 46.4a n = 2520 |
47.2a n = 163 |
34.5c n = 22 |
41.3b n = 294 |
F(3,2995)=37.3, p<.0001 |
| Asthma | 46.5a n = 2502 |
47.1a n = 189 |
34.0c n = 24 |
40.2b n = 284 |
F(3,2995)=52.2, p<.0001 |
| Chronic lung disease (COPD), chronic bronchitis or emphysema | 46.3a n = 2837 |
42.0b n = 47 |
35.4c n = 22 |
36.8c n = 93 |
F(3,2995)=42.5, p<.0001 |
| Diabetes or high blood sugar or sugar in your urine | 46.5a n = 2678 |
44.2a n = 164 |
34.8c n = 43 |
38.0b n = 114 |
F(3,2995)=52.1, p<.0001 |
| Cancer (other than non-melanoma skin cancer) | 46.0a n = 2860 |
46.7a n = 87 |
35.5b n = 15 |
38.1b n = 37 |
F(3,2995)=14.6, p<.0001 |
| Depression | 47.0a n = 2267 |
45.8a n = 307 |
34.8c n = 29 |
39.8b n = 396 |
F(3,2995)=82.5, p<.0001 |
| Anxiety | 46.6a n = 2357 |
46.5a n = 265 |
35.3c n = 13 |
41.0b n = 364 |
F(3,2995)=42.9, p<.0001 |
| Alcohol or drug problem | 46.1a n = 2847 |
44.1a n = 63 |
34.4c n = 19 |
39.3b n = 70 |
F(3,2995)=22.0, p<.0001 |
| Sleep disorder | 46.5a n = 2597 |
44.9a n = 166 |
35.5c n = 18 |
39.3b n = 218 |
F(3,2995)=48.1, p<.0001 |
| HIV or AIDS | 46.0a n = 2956 |
41.6ab n = 10 |
34.0c n = 10 |
39.0bc n = 23 |
F(3,2995)=9.9, p<.0001 |
| Spinal cord injury | 46.1a n = 2917 |
41.8a n = 15 |
34.7b n = 17 |
34.8b n = 50 |
F(3,2995)=32.5, p<.0001 |
| Multiple Sclerosis | 46.1a n = 2932 |
38.1b n = 11 |
35.7b n = 15 |
36.1b n = 41 |
F(3,2995)=23.1, p<.0001 |
| Condition | Mental Health | ||||
|---|---|---|---|---|---|
| Does not have condition | With condition, no limitation | With condition, unknown limitation | With condition, is limited | ANOVA | |
| Current activities limited by.. | |||||
| High blood pressure (hypertension) | 47.8a n = 1975 |
47.7a n = 637 |
41.6b n = 14 |
40.5b n = 373 |
F(3,2995)=72.9, p<.0001 |
| Chest pain (angina) | 47.5a n = 2705 |
43.5ab n = 99 |
36.1b n = 3 |
39.3b n = 192 |
F(3,2995)=54.3, p<.0001 |
| Hardening of the arteries (CAD) | 47.1a n = 2866 |
45.6a n = 51 |
n=0 | 38.6b n = 82 |
F(2,2996)=34.4, p<.0001 |
| Heart failure or congestive heart failure | 47.2a n = 2888 |
41.9a n = 33 |
40.1a n = 2 |
38.6a n = 76 |
F(3,2995)=24.6, p<.0001 |
| Heart attack (myocardial infarction) | 47.1a n = 2859 |
44.8ab n = 62 |
39.2c n = 8 |
40.4bc n = 70 |
F(3,2995)=14.4, p<.0001 |
| Stroke or transient ischemic attack (TIA) | 47.1a n = 2913 |
43.0a n = 34 |
38.1b n = 17 |
38.2b n = 35 |
F(3,2995)=17.5, p<.0001 |
| Liver disease, hepatitis, or cirrhosis | 47.1a n = 2895 |
43.9a n = 46 |
39.3b n = 24 |
39.1b n = 34 |
F(3,2995)=15.1, p<.0001 |
| Kidney disease | 47.1a n = 2899 |
44.1ab n = 35 |
40.0bc n = 17 |
37.5c n = 48 |
F(3,2995)=21.0, p<.0001 |
| Arthritis or rheumatism | 47.9a n = 2397 |
49.0a n = 162 |
39.2b n = 46 |
40.8b n = 394 |
F(3,2995)=83.5, p<.0001 |
| Migraines or severe headaches | 47.7a n = 2520 |
47.1a n = 163 |
40.8b n = 22 |
39.8b n = 294 |
F(3,2995)=69.3, p<.0001 |
| Asthma | 47.5a n = 2502 |
47.4a n = 189 |
39.4b n = 24 |
41.5b n = 284 |
F(3,2995)=41.9, p<.0001 |
| Chronic lung disease (COPD), chronic bronchitis or emphysema | 47.2a n = 2837 |
43.1b n = 47 |
40.8b n = 22 |
40.1b n = 93 |
F (3,2995) = 23.5, p<.0001 |
| Diabetes or high blood sugar or sugar in your urine | 47.3a n = 2678 |
47.3a n = 164 |
39.9b n = 43 |
39.4b n = 114 |
F (3,2995) = 34.5, p<.0001 |
| Cancer other than non-melanoma skin cancer | 46.9a n = 2860 |
49.2a n = 87 |
40.7b n = 15 |
40.4b n = 37 |
F (3,2995) = 10.0, p<.0001 |
| Depression | 48.8a n = 2267 |
45.5b n = 307 |
40.5c n = 29 |
37.2d n = 396 |
F (3,2995) = 216.1, p<.0001 |
| Anxiety | 48.4a n = 2357 |
45.1a n = 265 |
39.2b n = 13 |
38.6b n = 364 |
F (3,2995) = 138.5, p<.0001 |
| Alcohol or drug problem | 47.2a n = 2847 |
42.8b n = 63 |
39.0b n = 19 |
39.0b n = 70 |
F (3, 2995) = 26.4, p<.0001 |
| Sleep disorder | 47.8a n = 2597 |
44.8a n = 166 |
39.5b n = 18 |
37.7b n = 218 |
F (3,2995) = 92.3, p<.0001 |
| HIV or AIDS | 47.0a n = 2956 |
44.9ab n = 10 |
39.4b n = 10 |
39.4b n = 23 |
F (3,2995) = 7.2, p<.0001 |
| Spinal cord injury | 47.1a n = 2917 |
42.0b n = 15 |
39.7b n = 17 |
38.4b n = 50 |
F (3,2995) = 19.0, p<.0001 |
| Multiple Sclerosis | 47.0a n = 2932 |
41.9ab n = 11 |
40.8b n = 15 |
41.3ab n = 41 |
F (3,2995) = 8.1, p<.0001 |
Duncan’s Multiple Range Test
NOTE: This test controls the Type I comparison wise error rate, not the experiment wise error rate.
Means with the same letter are not significantly different.
The estimated PROMIS-29 v2.0 physical health and mental health summary scores were about 0.4 SDs below the U.S. general population average in Sample 1 (Table 4). This is consistent with the fact that Sample 1 is less healthy than the U.S. general population [34]. Similarly, and consistently, the PROMIS global physical health score was about 0.5 SD below the general population mean while the PROMIS global mental health score was about 0.3 SD below. The estimated PROMIS-29 v2.0 physical health summary score was about 0.1 SD below the U.S. general population average while the estimated PROMIS-29 v2.0 mental health score was at the general population average in Sample 2. In contrast, the SF-36 physical component summary score was 0.4 SD below the U.S. general population mean while the SF-36 mental component summary score was 0.2 SD below.
Table 4.
Descriptive Statistics for PROMIS-29 v2.0 Physical and Mental Health Summary Scores in Sample 1 and Sample 2
| Variable | Mean | SD | Minimum | Maximum |
|---|---|---|---|---|
| Physical Health | ||||
| PROMIS-29 v2.0 (Sample 1) | 46.3 | 9.2 | 21.6 | 62.4 |
| PROMIS Global (Sample 1) | 44.8 | 9.4 | 16.0 | 67.7 |
| PROMIS-29 v2.0 (Sample 2) | 48.6 | 8.9 | 22.3 | 61.9 |
| SF-36 v2 Physical Component Summary Score (Sample 2) | 46.1 | 11.2 | 8.3 | 69.4 |
| Mental Health | ||||
| PROMIS-29 v2.0 (Sample 1) | 45.7 | 9.5 | 19.5 | 62.3 |
| PROMIS Global (Sample 1) | 46.6 | 9.7 | 21.1 | 67.6 |
| PROMIS-29 v2.0 (Sample 2) | 50.2 | 9.2 | 20.4 | 62.2 |
| SF-36 v2 Mental Components Summary Score (Sample 2) | 47.7 | 12.4 | −3.6 | 71.7 |
Discussion
Because of the value and associated demand for bottom-line indicators, the SF-36 physical and mental health component summary scores [35] and PROMIS global physical health and mental health scales [24, 36] are widely used [37]. This study provides PROMIS-29 v2.0 physical health and mental health summary scores that are extremely reliable and have associations with other health-related quality of life measures and chronic conditions that are congruent with a-priori hypotheses. For example, the corresponding PROMIS-29 v2.0 and SF-36 physical and mental health summary scores correlated strongly with one another (r = 0.82 for both in Sample 2).
The PROMIS-29 v2.0 physical and mental health summary scores have clear advantages over existing summary scores. First, the PROMIS v2.0 summary health measures are more reliable than the PROMIS global health summary scores (0.93 and 0.95 vs 0.79 for physical health and 0.0.97 and 0.98 vs 0.86 for mental health) [24, 36]. Second, the new summary scores were constructed allowing physical and mental health to be correlated rather than forcing a zero correlation between them as was the case for the SF-36 summary scores [35]. This is a critical difference because mental health scales are negatively weighted on the SF-36 physical health component summary score, and physical health scales receive negative weighting on the SF-36 mental health component summary score. This leads to inconsistent results between SF-36 scale scores and the summary scores when there is a consistent pattern of responses for the 8 SF-36 scale score (i.e., a majority of or all high scores or low scores) [38]. Allowing the underlying physical and mental health summary scores to be correlated reflects the reality of health and eliminates the inconsistency between scale scores and summary measures [17].
The PROMIS-29 v2.0 now yields 7 multi-item scale scores, a pain intensity item score, and physical and mental health summary scores. The factor scoring coefficients for estimating the summary scores are provided in Table 1, but more extensive information about scoring is available at www.healthmeasures.net [39]. In addition, algorithms have been developed in the PROMIS project to estimate the EQ-5D-3L [25] and the HUI-3 [34] from the PROMIS-29 scales. Preference-based scoring functions can also be estimated directly from the PROMIS-29 [40–42].
While the results of this study provide strong support for some of the psychometric properties of the PROMIS-29 v2.0 summary scores, further work is needed to assess the scoring system in different samples. In addition, we welcome comparisons of the approach used here with alternative methods for deriving summary scores.
Supplementary Material
Figure 1.
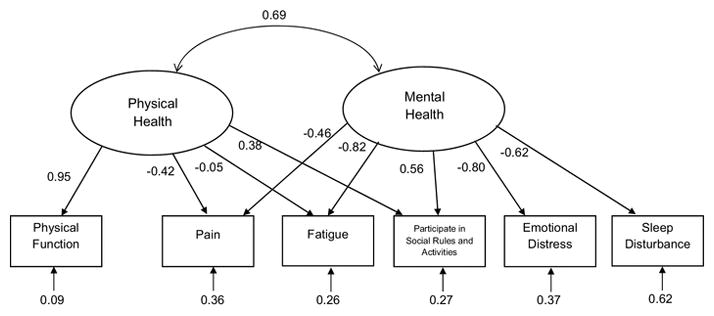
Confirmatory Factor Analysis Standardized Estimates in Sample 1
Acknowledgments
This research was supported in part through the National Cancer Institute (1U2-CCA186878-01). Ron D. Hays was also supported by the National Institute on Aging (P30-AG021684).
Footnotes
Conflict of Interest
The authors declare that they have no conflict of interest.
Contributor Information
Ron D. Hays, Division of General Internal Medicine and Health Services Research, David Geffen School of Medicine at UCLA, 911 Broxton Avenue, Los Angeles, CA 90095, 310-794-2294; 310-794-0732 FAX.
Karen L. Spritzer, Division of General Internal Medicine and Health Services Research, David Geffen School of Medicine at UCLA, 911 Broxton Avenue, Los Angeles, CA 90095, 310-794-2294; 310-794-0732 FAX.
Benjamin D. Schalet, Department of Medical Social Sciences, Feinberg School of Medicine, Northwestern University, 625 N. Michigan Ave., Suite 2700, Chicago, L 60611, 312-503-3640.
David Cella, Department of Medical Social Sciences, Feinberg School of Medicine, Northwestern University, 625 N. Michigan Ave., Suite 2700, Chicago, IL 60611, 312-503-1086.
References
- 1.Cella D, Riley W, Stone A, Rothrock N, Reeve B, Young S, et al. Initial item banks and first wave testing of the Patient-Reported Outcomes Measurement Information System (PROMIS) network: 2005–2008. Journal of Clinical Epidemiology. 2010;63(11):1179–1194. doi: 10.1016/j.jclinepi.2010.04.011. [DOI] [PMC free article] [PubMed] [Google Scholar]
- 2.Hinami K, Smith J, Deamant C, DuBeshler K, Trick W. When do patient-reported outcome measures inform readmission risk? Journal of Hospital Medicine. 2015;10:294–300. doi: 10.1002/jhm.2366. [DOI] [PubMed] [Google Scholar]
- 3.DeSalvo KB, Bloser N, Reynolds K, He J, Muntner PJ. Mortality prediction with a single general self-rated health question. A meta-analysis. J Gen Intern Med. 2006;21(3):267–75. doi: 10.1111/j.1525-1497.2005.00291.x. [DOI] [PMC free article] [PubMed] [Google Scholar]
- 4.Han PKJ, Lee M, Reeve BB, Mariotto AB, Wang Z, Hays RD, et al. Development of a prognostic model for six-month mortality in older adults with declining health. Journal of Pain and Symptom Management. 2012;43:527–539. doi: 10.1016/j.jpainsymman.2011.04.015. [DOI] [PMC free article] [PubMed] [Google Scholar]
- 5.Choi SW, Reise SP, Pilkonis PA, Hays RD, Cella D. Efficiency of static and computer adaptive short forms compared to full-length measures of depressive symptoms. Quality of Life Research. 2010;19:125–136. doi: 10.1007/s11136-009-9560-5. [DOI] [PMC free article] [PubMed] [Google Scholar]
- 6.Hays RD, Spritzer KL, Fries JF, Krishnan E. Responsiveness and minimally important difference for the Patient-Reported Outcomes Measurement and Information System (PROMIS) 20-Item Physical Functioning Short-Form in a Prospective Observational study of Rheumatoid Arthritis. Annals of the Rheumatic Diseases. 2013;74(1):104–7. doi: 10.1136/annrheumdis-2013-204053. [DOI] [PMC free article] [PubMed] [Google Scholar]
- 7.Hinchcliff ME, Beaumont JL, Carns MA, Podlusky S, Thavarajah K, Varga, et al. Longitudinal evaluation of PROMIS-29 and FACIT-dyspnea short forms in systemic sclerosis. Journal of Rheumatology. 2015;42(1):64–72. doi: 10.3899/jrheum.140143. [DOI] [PMC free article] [PubMed] [Google Scholar]
- 8.Katz P, Pedro S, Michaud K. Performance of the patient-reported outcomes measurement information system 29-item profile in rheumatoid arthritis, osteoarthritis, fibromyalgia, and systemic lupus erythematosus. Arthritis Care & Research. 2017;69(8):1312–1321. doi: 10.1002/acr.23183. [DOI] [PubMed] [Google Scholar]
- 9.Fisher F, Gibbons C, Coste J, Valderas JM, Rose M, Leplège A. Quality of Life Research. 2018. Measurement invariance and general population reference values of the PROMIS Profile 29 in the UK, France, and Germany. epub. [DOI] [PubMed] [Google Scholar]
- 10.Rose M, Bjorner JB, Gandek B, Bruce B, Fries JF, Ware JE. The PROMIS physical function item bank was calibrated to a standardized metric and shown to improve measurement efficiency. J Clin Epidemiol. 2014;67(5):516–526. doi: 10.1016/j.jclinepi.2013.10.024. [DOI] [PMC free article] [PubMed] [Google Scholar]
- 11.Lai JS, Cella D, Choi S, et al. How item banks and their application can influence measurement practice in rehabilitation medicine: A PROMIS fatigue item bank example. Arch Phys Med Rehabil. 2011;92(10):S20–S27. doi: 10.1016/j.apmr.2010.08.033. [DOI] [PMC free article] [PubMed] [Google Scholar]
- 12.Amtmann D, Cook KF, Jensen MP, et al. Development of a PROMIS item bank to measure pain interference. Pain. 2010;150(1):173–182. doi: 10.1016/j.pain.2010.04.025. [DOI] [PMC free article] [PubMed] [Google Scholar]
- 13.Pilkonis PA, Choi SW, Reise SP, Stover AM, Riley WT, Cella D. Item banks for measuring emotional distress from the Patient-Reported Outcomes Measurement Information System (PROMIS®): depression, anxiety, and anger. Assessment. 2011;18(3):263–283. doi: 10.1177/1073191111411667. [DOI] [PMC free article] [PubMed] [Google Scholar]
- 14.Hahn EA, DeWalt DA, Bode RK, et al. New English and Spanish social health measures will facilitate evaluating health determinants. Health Psychol. 2014;33(5):490–499. doi: 10.1037/hea0000055. [DOI] [PMC free article] [PubMed] [Google Scholar]
- 15.Buysse DJ, Yu L, Moul DE, et al. Development and validation of patient-reported outcome measures for sleep disturbance and sleep-related impairments. Sleep. 2010;33(6):781–792. doi: 10.1093/sleep/33.6.781. [DOI] [PMC free article] [PubMed] [Google Scholar]
- 16.Hays RD, Alonso J, Coons SJ. Possibilities for summarizing health-related quality of life when using a profile instrument. In: Staquet M, Hays R, Fayers P, editors. Quality of Life Assessment in Clinical Trials: Methods and Practice. Oxford: Oxford University Press; 1998. pp. 143–153. [Google Scholar]
- 17.Farivar SS, Cunningham WE, Hays RD. Correlated physical and mental health summary scores for the SF-36 and SF-12 health survey, V. 1. Health and Quality of Life Outcomes. 2007;5:54. doi: 10.1186/1477-7525-5-54. [DOI] [PMC free article] [PubMed] [Google Scholar]
- 18.Hays RD, Marshall GN, Wang EYI, Sherbourne CD. Four-year cross-lagged associations between physical and mental health in the Medical Outcomes Study. Journal of Consulting and Clinical Psychology. 1994;62:441–449. doi: 10.1037//0022-006x.62.3.441. [DOI] [PubMed] [Google Scholar]
- 19.Hays RD, Stewart AL. The structure of self-reported health in chronic disease patients. Psychological Assessment. 1990;2:22–30. [Google Scholar]
- 20.Carle AC, Riley W, Hays RD, et al. Confirmatory factor analysis of the patient reported outcomes measurement information system (PROMIS) adult domain framework using item response theory scores. Medical Care. 2015;53:894–900. doi: 10.1097/MLR.0000000000000413. [DOI] [PMC free article] [PubMed] [Google Scholar]
- 21. [Accessed January 2, 2018];Op4g website. Available at http://op4g.com/our-panel/
- 22.Butt Z, Peipert J, Webster K, Chen C, Cella D. General population norms for the Functional Assessment of Cancer Therapy-Kidney Symptoms Index (FKSI) Cancer. 2013;119(2):429–437. doi: 10.1002/cncr.27688. [DOI] [PMC free article] [PubMed] [Google Scholar]
- 23.Feeny D, Furlong W, Boyle M, et al. Multi-attribute health status classification systems. Pharmacoeconomics. 1995;7:490–502. doi: 10.2165/00019053-199507060-00004. [DOI] [PubMed] [Google Scholar]
- 24.Hays RD, Bjorner J, Revicki DA, Spritzer K, Cella D. Development of physical and mental health summary scores from the Patient-Reported Outcomes Measurement Information System (PROMIS) global items. Quality of Life Research. 2009;18:873–80. doi: 10.1007/s11136-009-9496-9. [DOI] [PMC free article] [PubMed] [Google Scholar]
- 25.Revicki DA, Kawata AK, Harnam N, Chen WH, Hays RD, Cella D. Predicting EuroQol (EQ-5D) scores from the Patient-Reported Outcomes Measurement Information System (PROMIS) Global items and domain item banks in a United States sample. Quality of Life Research. 2009;18:783–791. doi: 10.1007/s11136-009-9489-8. [DOI] [PMC free article] [PubMed] [Google Scholar]
- 26.Ware JE. SF-36 health survey update. Spine. 2000;25:3130–3139. doi: 10.1097/00007632-200012150-00008. [DOI] [PubMed] [Google Scholar]
- 27.Brazier J, Roberts J, Deverill M. The estimation of a preference-based measure of health from the SF-36. J Health Econ. 2002;21(2):271–92. doi: 10.1016/s0167-6296(01)00130-8. [DOI] [PubMed] [Google Scholar]
- 28.Cronbach LJ. Coefficient alpha and the internal structure of tests. Psychometrika. 1951;16:297–334. [Google Scholar]
- 29.Rummel RJ. Applied factor analysis. Evanston, IL: Northwestern University Press; 1970. [Google Scholar]
- 30.Hendrickson AE, White P. Promax: A quick method for rotation to oblique simple structure. British Journal of Statistical Psychology. 1964;17:65–70. [Google Scholar]
- 31.Hu LT, Bentler PM. Cutoff criteria for fit indexes in covariance structure analysis: Conventional criteria versus new alternatives. Struct Equation Modeling. 1999;6(1):1–55. [Google Scholar]
- 32.Muthén LK, Muthén BO. Mplus User’s Guide. 7. Los Angeles, CA: 1998–2012. [Google Scholar]
- 33.Mosier CI. On the reliability of a weighted composite. Psychometrika. 1943;8(3):161–168. [Google Scholar]
- 34.Hays RD, Revicki DA, Feeny D, Fayers P, Spritzer KL, Cella D. Using linear equating to map PROMIS global health items and the PROMIS-29 V. 2 Profile measure to the Health Utilities Index—Mark 3. Pharmacoeconomics. 2016;34:1015–1022. doi: 10.1007/s40273-016-0408-x. [DOI] [PMC free article] [PubMed] [Google Scholar]
- 35.Taft C, Karlsson J, Sullivan M. Do SF-36 summary component scores accurately summarize subscale scores? Quality of Life Research. 2001;10:395–404. doi: 10.1023/a:1012552211996. [DOI] [PubMed] [Google Scholar]
- 36.Hays RD, Schalet BD, Spritzer KL, Cella D. Two-item PROMIS global physical and mental health scales. Journal of Patient-Reported Outcomes. 2017;1:2. doi: 10.1186/s41687-017-0003-8. [DOI] [PMC free article] [PubMed] [Google Scholar]
- 37.Barile JP, Reeve BB, Smith AW, Zack MM, Mitchell SA, Kobau R, et al. Monitoring population health for Healthy People 2020: Evaluation of the NIH PROMIS® global health, CDC healthy days, and satisfaction with life instruments. Quality of Life Research. 2013;22(6):1201–1211. doi: 10.1007/s11136-012-0246-z. [DOI] [PMC free article] [PubMed] [Google Scholar]
- 38.Simon GE, Revicki DA, Grothaus L, et al. SF-36 summary scores: Are physical and mental health truly distinct? Med Care. 1998;36:567–572. doi: 10.1097/00005650-199804000-00012. [DOI] [PubMed] [Google Scholar]
- 39. [Accessed January 2, 2018];HealthMeasures website. Available at: www.healthmeasures.net.
- 40.Craig BM, Reeve BB, Brown PM, Cella D, Hays RD, Lipscomb J, Pickard AS, Revicki DA. US valuation of health outcomes measured using the PROMIS-29. Value in Health. 2014;17(8):846–853. doi: 10.1016/j.jval.2014.09.005. [DOI] [PMC free article] [PubMed] [Google Scholar]
- 41.Hanmer J, Cella D, Feeny D, Fischhoff B, Hays RD, Hess R, et al. Selection of key health domains from PROMIS® for a generic preference-based scoring system. Quality of Life Research. 2017 doi: 10.1007/s11136-017-1686-2. Epub ahead of print. [DOI] [PMC free article] [PubMed] [Google Scholar]
- 42.Hanmer J, Feeny D, Fischoff B, Hays RD, Hess R, Pilkonis P, et al. The PROMIS of QALYs. Health and Quality of Life Outcomes. 2015;13:122. doi: 10.1186/s12955-015-0321-6. [DOI] [PMC free article] [PubMed] [Google Scholar]
Associated Data
This section collects any data citations, data availability statements, or supplementary materials included in this article.