

Abstract
Objective
Recent mechanistic and epidemiological evidence implicates air pollution as a potential risk factor for diabetes; however, mortality risks have not been evaluated in a large US cohort assessing exposures to multiple pollutants with detailed consideration of personal risk factors for diabetes.
Research Design and Methods
We assessed the effects of long-term ambient air pollution exposures on diabetes mortality in the NIH-AARP Diet and Health Study, a cohort of approximately a half million subjects across the contiguous U.S. The cohort, with a follow-up period between 1995 and 2011, was linked to residential census tract estimates for annual mean concentration levels of PM2.5, NO2, and O3. Associations between the air pollutants and the risk of diabetes mortality (N=3,598) were evaluated using multivariate Cox proportional hazards models adjusted for both individual-level and census-level contextual covariates.
Results
Diabetes mortality was significantly associated with increasing levels of both PM2.5 (HR=1.19; 95% CI: 1.03–1.39 per 10 μg/m3) and NO2 (HR=1.09; 95% CI: 1.01–1.18 per 10 ppb). The strength of the relationship was robust to alternate exposure assessments and model specifications. We also observed significant effect modification, with elevated mortality risks observed among those with higher BMI and lower levels of fruit consumption.
Conclusions
We found that long-term exposure to PM2.5 and NO2, but not O3, is related to increased risk of diabetes mortality in the U.S, with attenuation of adverse effects by lower BMI and higher fruit consumption, suggesting that air pollution is involved in the etiology and/or control of diabetes.
Introduction
Aging populations, sedentary lifestyles, and calorie-dense diets have contributed to the growing prevalence of diabetes mellitus in both developed and developing countries (Guariguata et al., 2014), posing a serious threat to global public health and welfare. According to the International Diabetes Foundation, diabetes affected at least 382 million people worldwide (8.3% prevalence) in 2013, and that number is expected to reach 592 million by the year 2035. Those with diabetes are at elevated risk to develop micro- and macro-vascular diseases throughout their lifetime, substantially reducing their life expectancies (Franco et al., 2007).
Recent evidence implicates ambient air pollution exposure as a potential contributing risk factor for diabetes. Systemic inflammation has a critical role in the etiology of this disease (Donath and Shoelson 2011; Osborn and Olefsky, 2012), and air pollution has been demonstrated to activate inflammatory mechanisms (Brook et al., 2010). Sun et al. (2009) first provided a basis for the biological mechanism for the air pollution-diabetes relationship in an animal model, revealing that exposure to fine particulate matter increased blood glucose and induced adipose inflammation and insulin resistance. Subsequent studies have elucidated other potential pathophysiologic pathways, including overactivity of the sympathetic nervous system, endothelial dysfunction, and dysregulation of visceral adipose tissue (Rajagopalan and Brook, 2012).
Epidemiological investigations have also found associations in multiple cohorts between long-term ambient air pollution exposure and diabetes prevalence, incidence, and mortality. Meta-analyses (Park and Wang, 2014; Eze et al., 2015) have concluded that the collective evidence from such studies is suggestive of a positive relationship, but that additional studies are still required. Only a few studies have evaluated diabetes mortality: in a group of 2.1 million adults from the 1991 Canadian census mortality follow-up study (CanCHEC), higher long-term PM2.5 exposure was associated with increased diabetes mortality (Brook et al., 2013a). In the Danish Diet, Cancer, and Health cohort of 52,061 participants, a significant association between long-term NO2 exposure and mortality was found (Raaschou-Nielsen et al., 2013). In the U.S., an investigation on the association between chronic exposure to PM2.5 and multiple cardiovascular mortality outcomes in the American Cancer Society (ACS) cohort also reported a significant association with diabetes mortality (Pope et al. 2015). There exists a need to independently verify and further evaluate this relationship in a large and well-characterized cohort in the U.S., especially with an emphasis on assessment of exposure to multiple pollutants and determination as to whether certain subpopulations are at enhanced risk. Given the recent trend of increasing prevalence of both obesity and diabetes, it is of growing importance to evaluate and quantify the apparent diabetes-related mortality risk contribution from environmental factors, such as air pollution.
In this study, we evaluated the association between long-term exposure to air pollutants (PM2.5, NO2, and O3) and diabetes-related mortality risk in the NIH-AARP Diet and Health cohort, a U.S study with detailed characterizations of individual-level covariates and census-tract estimates of air pollution concentrations. We also assessed potential effect modification by known personal risk factors.
Research Design and Methods
Population
Detailed study and cohort information are presented elsewhere (Thurston et al., 2016). The NIH-AARP Study was initiated when members of the AARP, 50–71 years of age from six U.S. states (California, Florida, Louisiana, New Jersey, North Carolina, and Pennsylvania) and two metropolitan areas (Atlanta, Georgia, and Detroit, Michigan), responded to a mailed questionnaire in 1995. The NIH-AARP cohort questionnaires elicited information on demographic and anthropometric characteristics, dietary intake, and numerous health-related factors at enrollment. Contextual environment characteristics for the census tract of each of this cohort’s participants have also been compiled, allowing us to also incorporate socioeconomic variables at the census-tract level. All participants provided written informed consent before completing the study. The study was approved by the Institutional Review Boards (IRBs) of the National Cancer Institute and New York University School of Medicine.
Cohort Follow-up and Mortality Ascertainment
Person-years of follow-up were included for each participant from enrollment to the date of death, the end of follow-up (31 December 2011), or the date the participant moved out of the study state or city where s/he lived at enrollment, whichever occurred first. Vital status was ascertained through a periodic linkage of the cohort to the Social Security Administration Death Master File and follow-up searches of the National Death Index Plus for participants who matched to the Social Security Administration Death Master, cancer registry linkage, questionnaire responses, and responses to other mailings. We used the International Classification of Diseases, 9th Revision (ICD-9) and the International Statistical Classification of Diseases, 10th Revision (ICD-10) to define underlying mortality due to diabetes (ICD-9: 250 and ICD-10: E10-E14). Among 566,398 participants enrolled in the NIH-AARP cohort and available for analysis, after exclusions and removing those with missing data the analytic cohort includes 549,735 (97.1% of total cohort) participants with 50,700 (9.2%) self-reported history of diabetes at enrollment. During the follow-up period considered (1995 through 2011), 130,384 (23.7%) total participants died, and 3,597 subjects died from diabetes (2.8% of total deaths during the study period).
Exposure Assessment
Detailed individual residence-level exposure data were considered in these analyses. We employed residential census tract centroid estimates of annual average PM2.5 mass exposures available for the years 1980–2010, as derived from a published spatio-temporal prediction model using geographic predictors and extrapolation to predict pre-1999 exposure levels before implementation of nationwide monitoring (Kim et al., 2016). Monthly averages of census tract NO2 concentrations were also linked, which were estimated based on a national land use regression model using regulatory monitoring (hourly data from 423 monitors) and satellite-based measurements (approximately 4 million measurements, aggregated into annual average values at 81,743) at the census block group level for the years 2000–2010 (Bechle et al., 2015).
We also procured and linked O3 concentrations derived from an EPA Bayesian space–time downscaling fusion model (US EPA 2014), which estimated daily 8-hour maximum O3 concentrations at the census tract centroid based on National Air Monitoring Stations/State and Local Air Monitoring Stations and CMAQ model data in 12 x 12 km grids for the years 2002–2010. However, for years 2002–2006, O3 estimates were only available for the eastern part of the U.S. For this reason, daily ozone (O3) concentrations were obtained for cohort California residents based upon an interpolation of data from monitoring stations in fixed-site Federal Reference Method monitors in the California’s State and Local Air Monitoring Network Plan (NAMS/SLAMS) (https://www.arb.ca.gov/aaqm/mldaqsb/amn.htm). Monthly averages of max 8-hour O3 concentrations with ≥ 70% completeness in each month were calculated at monitoring sites. A statewide 250-m gridded pollutant surface using these monthly average concentrations was then developed with inverse distance-weighted (IDW) interpolation, using the Spatial Analyst extension of ArcGIS version 10.3.1 (ESRI, Redlands, CA). The agreement between the EPA model and monitor-based kriging methods were compared for years 2007–2010 when the EPA values become available for California; the correlations between the two approaches were excellent, with R2 ranging from 0.89 to 0.95.
Statistical Methods
Cox proportional hazards models were employed to estimate hazard ratios (HRs) of mortality in relation to ambient air pollution levels (per 10 μg/m3 for PM2.5; per 10 ppb for NO2 and O3), assigning long-term exposure for PM2.5, NO2, O3 as average annual concentration levels from 2002–2010, in order to match the more limited O3 data availability.
In fully-adjusted multivariate models including individual-level variables, the following covariates were included: age (grouped into 3-year categories), sex, region (6 U.S. states and two cities) as strata; race or ethnic group (Non-Hispanic White; Non-Hispanic Black; Hispanic; Asian, Pacific Islander, or American Indian/Alaskan Native; unknown); level of education (less than high school, some high school, high school completed, post-high school or some college, college and post graduate, unknown); marital status (married, never-married, other, unknown); body-mass index (BMI) (<18.5 kg/m2, 18.5-<25.0, 25.0-<30.0, 30-<35, 35+, unknown); alcohol (none, <1, 1-<2, 2-<3, 3-<5 and 5+ drinks per day); smoking status (never smoker, former smoker of <= 1 pack/d, former smoker of >1 pack/d, current smoker of <= 1 pack/d, current smoker of >1 pack/d, unknown); and diet (total fat consumption, in grams per day; total vegetable and total fruit consumption, in pyramid servings per day), in addition to two contextual characteristics (median census tract household income and percent of census tract population with less than a high school education, based on the 2000 decennial census for the residence at study entry). At study enrollment, cohort participants completed the AARP 124-item FFQ (AARP-FFQ), an early version of the Diet History Questionnaire, to assess dietary intake over the past year. We merged the MyPyramid Equivalents Database, version 1.0, with the AARP food frequency questionnaire data to calculate pyramid equivalents for fruits and vegetables (Reedy et al., 2008).
We also conducted stratified analyses to test for possible effect modification by known individual risk factors: age, sex, race, smoking history, pre-diagnosed health status (heart disease and diabetes), BMI, and diet. Potential effect modification was assessed by including multiplicative interaction terms between the pollutant and covariates of interest in the models, and the likelihood ratio test comparing model fit with and without interaction terms were conducted to test the statistical significance. Also, as further sensitivity analyses, we considered a random effects model at the metropolitan statistical area (MSA) level; without censoring data after people moved; and for PM2.5, we also considered an extended Cox model with time-varying and lagged exposures (1 year prior) for the entire follow-up period of years 1995–2011, to evaluate model robustness to choice of exposure metric timeframe. Packages “survival” and “coxme” in R (version 3.4.0) were utilized for analysis.
Results
Detailed cohort characteristics are presented in Table 1; there is only limited variation in pollutant concentrations by participant characteristics, indicating that potential confounding by these variables with air pollution exposure is likely minimal. Average concentrations for PM2.5 ranged from 2.8 to 21.2 μg/m3, with a mean (SD) of 11.0 (2.7) μg/m3; for NO2 concentration levels ranged from 2.1 to 36.2 ppb, with a mean (SD) of 12.2 (5.5) ppb; and for O3 concentration levels ranged from 25.5 to 56.5 ppb, with a mean (SD) of 39.5 (4.6) ppb. Annual average PM2.5 and NO2 concentration levels for the years considered in the analysis were highly correlated (R2=0.72), while PM2.5 and O3 showed weak correlation (R2=0.10).
Table 1.
Descriptive Statistics for the NIH-AARP Cohort
| N (%) | PM2.5 | NO2 | O3 | |
|---|---|---|---|---|
| Age | ||||
| >=65 | 202,135 (36.8) | 10.9 (2.8) | 12.0 (5.6) | 39.5 (4.6) |
| <65 | 347,600 (63.2) | 11.1 (2.7) | 12.3 (5.5) | 39.5 (4.6) |
| Sex | ||||
| Male | 324,654 (59.1) | 11.0 (2.7) | 12.0 (5.4) | 39.5 (4.5) |
| Female | 225,081 (40.9) | 11.1 (2.8) | 12.4 (5.6) | 39.4 (4.7) |
| Race | ||||
| White | 501,428 (91.2) | 10.9 (2.7) | 11.9 (5.4) | 39.6 (4.5) |
| Black | 21,576 (3.9) | 12.3 (2.4) | 15.3 (5.9) | 38.2 (4.4) |
| Hispanic | 10,228 (1.9) | 11.4 (3.5) | 14.8 (7.0) | 38.8 (5.4) |
| Asian, Pacific Islander, or American Indian/Alaskan Native | 8,878 (1.6) | 11.9 (3.0) | 15.7 (6.5) | 38.0 (5.7) |
| Education | ||||
| Less than high school | 33,311 (6.1) | 11.0 (2.7) | 11.9 (5.7) | 39.5 (4.2) |
| Some high school | 107,547 (19.6) | 11.1 (2.6) | 12.0 (5.4) | 39.4 (4.1) |
| 12 years or high school completed | 53,834 (9.8) | 10.9 (2.7) | 11.6 (5.4) | 39.6 (4.3) |
| post-high school or some college | 127,430 (23.2) | 11.0 (2.9) | 12.3 (5.7) | 39.7 (4.9) |
| college and post graduate | 211,024 (38.4) | 11.1 (2.7) | 12.5 (5.4) | 39.3 (4.7) |
| BMI | ||||
| <18.5 | 4,661 (0.8) | 11.0 (2.7) | 12.0 (5.7) | 39.7 (4.7) |
| 18.5–25 | 184,722 (33.6) | 10.9 (2.7) | 12.2 (5.6) | 39.4 (4.7) |
| 25–30 | 227,220 (41.3) | 10.9 (2.7) | 12.1 (5.5) | 39.5 (4.6) |
| 30–35 | 84,420 (15.4) | 11.1 (2.7) | 12.2 (5.5) | 39.5 (4.5) |
| >35 | 33,894 (6.2) | 11.2 (2.7) | 12.6 (5.6) | 39.3 (4.5) |
| Marital | ||||
| Married | 374,223 (68.1) | 10.9 (2.7) | 11.8 (5.4) | 39.7 (4.5) |
| 144,330 | 11.1 | 12.7 | 39.2 | |
| (26.2) | (2.8) | (5.7) | (4.7) | |
| Other | 26,636 (4.8) | 11.6 (2.7) | 14.2 (6.1) | 38.3 (4.9) |
| Smoking | ||||
| Never | 191,283 (34.8) | 11.2 (2.7) | 12.4 (5.5) | 39.5 (4.6) |
| Less than a pack, 1+ year quit | 146,124 (26.6) | 11.0 (2.7) | 12.2 (5.5) | 39.4 (4.6) |
| More than a pack, 1+ year quit | 115,543 (21.0) | 10.8 (2.7) | 11.8 (5.5) | 39.6 (4.5) |
| Less than a pack, stopped less than a year/current | 48,927 (8.9) | 11.1 (2.7) | 12.4 (5.7) | 39.4 (4.6) |
| More than a pack, stopped less than a year or | 10.9 | 11.7 | 39.6 | |
| current | 26,858 (4.9) | (2.8) | (5.6) | (4.5) |
| Alcohol Drinks Per Day | ||||
| 0 | 136,107 (24.8) | 11.2 (2.7) | 11.9 (5.7) | 39.9 (4.6) |
| <1 | 287,101 (52.2) | 11.1 (2.7) | 12.5 (5.5) | 39.5 (4.6) |
| 1–2 | 62,140 (11.3) | 10.8 (2.7) | 12.1 (5.4) | 39.3 (4.8) |
| 2–3 | 20,778 (3.8) | 10.7 (2.7) | 12.1 (5.5) | 39.2 (4.9) |
| 3–5 | 20,078 (3.7) | 10.7 (2.7) | 11.7 (5.4) | 39.5 (4.7) |
| 5+ | 23,531 (4.3) | 10.6 (2.8) | 11.7 (5.6) | 39.4 (4.7) |
| Vegetable Consumption, Pyramid Servings Per Day | ||||
| 1st Quartile | 136,176 (24.8) | 11.0 (2.7) | 12.0 (5.6) | 39.5 (4.4) |
| 2nd Quartile | 137,359 (24.9) | 11.0 (2.7) | 12.0 (5.6) | 39.5 (4.5) |
| 3rd Quartile | 137,870 (25.1) | 11.0 (2.7) | 12.0 (5.6) | 39.5 (4.6) |
| 4th Quartile | 138,330 (25.2) | 11.0 (2.7) | 12.6 (5.6) | 39.4 (4.7) |
| Fruit Consumption, Pyramid Servings Per Day | ||||
| 1st Quartile | 136,632 (24.9) | 10.9 (2.7) | 11.9 (5.5) | 39.5 (4.2) |
| 2nd Quartile | 137,435 (25.0) | 11.0 (2.7) | 12.0 (5.4) | 39.5 (4.3) |
| 3rd Quartile | 137,745 (25.0) | 11.0 (2.7) | 12.2 (5.5) | 39.4 (4.4) |
| 4th Quartile | 137,923 (25.1) | 11.1 (2.8) | 12.7 (5.6) | 39.3 (4.5) |
| Fat Consumption, Grams Per Day | ||||
| 1st Quartile | 138,972 (25.3) | 11.0 (2.7) | 12.5 (5.6) | 39.2 (4.7) |
| 2nd Quartile | 138,327 (25.2) | 11.0 (2.7) | 12.3 (5.5) | 39.4 (4.6) |
| 3rd Quartile | 137,087 (24.9) | 11.0 (2.7) | 12.1 (5.5) | 39.6 (4.5) |
| 4th Quartile | 135,329 (24.6) | 11.0 (2.7) | 12.0 (5.5 | 39.7 (4.5) |
After adjusting for both individual- and contextual-level covariates, both PM2.5 (HR=1.19; 95% CI: 1.03–1.39) and NO2 (HR=1.09; 95% CI: 1.01–1.18) were found to be significantly associated with diabetes-related mortality. For O3, the mortality risk estimates were not significant for either annual (HR=0.96; 95% CI: 0.88–1.04) or summertime (HR=0.98; 95% CI: 0.92–1.03) exposure averages. The time-varying model for PM2.5 provided similar results to the full model, and inclusion of MSA-level random effects, those who moved out of ascertainment area, and other comorbidities in the model only marginally changed the effect estimates for the pollutants (Table 2).
Table 2.
Diabetes Mortality HRs (per 10 μg/m3 for PM2.5; per 10 ppb for NO2 and O3) by model specifications
| PM2.5 | NO2 | O3 | |||||
|---|---|---|---|---|---|---|---|
|
| |||||||
| HR | 95% CI | HR | 95% CI | HR | 95% CI | ||
| Model 1 | Age, Sex, Location Only | 1.59 | 1.36–1.86 | 1.25 | 1.16–1.35 | 1.01 | 0.93–1.09 |
| Model 2 | Full Model | 1.19 | 1.03–1.39 | 1.09 | 1.01–1.18 | 0.96 | 0.88–1.04 |
| Model 3 | M2 + Comorbidity | 1.22 | 1.05–1.42 | 1.10 | 1.02–1.18 | 0.96 | 0.88–1.04 |
| Model 4 | M2 + Random Effects | 1.23 | 1.03–1.47 | 1.10 | 1.01–1.19 | 0.93 | 0.84–1.03 |
| Model 5 | Without censoring movers | 1.21 | 1.03–1.43 | 1.09 | 1.01–1.18 | 0.96 | 0.88–1.04 |
| Model 6 | Time-varying Exposure | 1.18 | 1.03–1.36 | ||||
Adjusted for age, sex, and location as strata; and race, BMI, education, smoking, and marriage at individual-level; and median income and % with high school education at census-tract level
The overall exposure-response relationship using splines was plotted, with the best degree of freedom (df=2) selected via Akaike Information Criterion (AIC) and Bayesian Information Criterion (BIC) values. We observed the significant associations between PM2.5 and NO2 with diabetes-related mortality to be monotonic, and positively linear across the range of concentration levels in the cohort (Figure 1).
Figure 1.
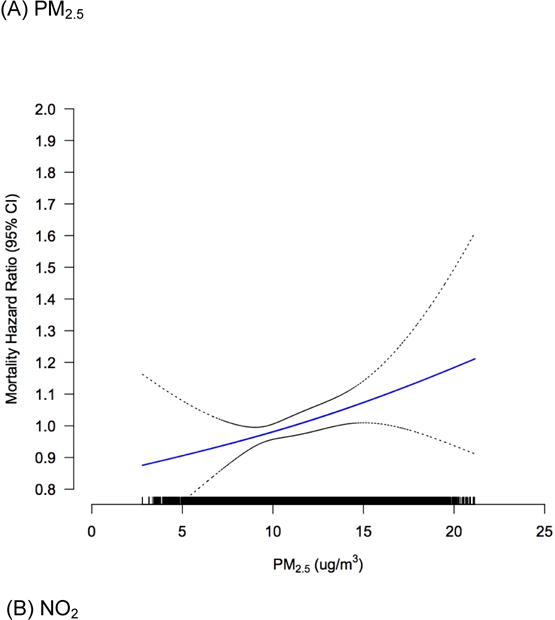
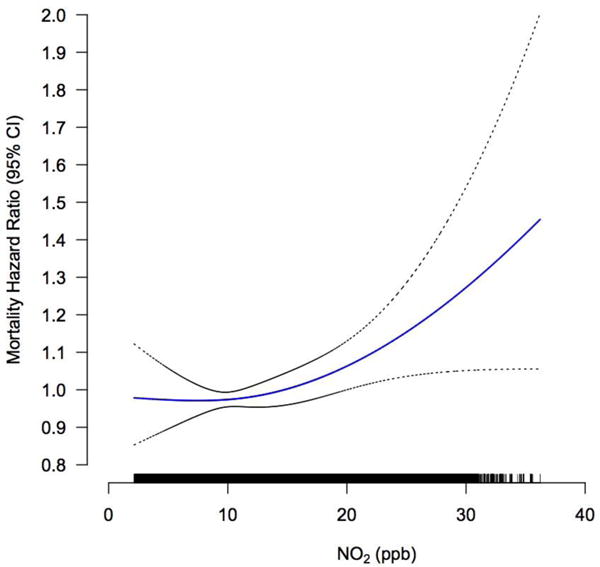
Concentration-response curves (solid lines) and 95% CIs (dashed lines) relative to the effect at mean concentration, based on natural spline models with 2 degrees of freedom, for standard Cox models adjusted for individual-level and contextual covariates. The tick marks on the x-axis identify the distribution of observations according to air pollutant concentrations.
Stratified analyses were also conducted for potential effect modifier subgroups. As shown in Table 3, the strength of the PM2.5-diabetes mortality association (per 10 μg/m3) was greater for obese subjects (HR=1.30; 95% CI: 1.05–1.62), compared to overweight (HR=1.13; 95% CI: 0.77–1.65) and normal or underweight subjects (HR=1.07; 95% CI: 0.83–1.40) (p interaction=0.04). The strength of the PM2.5-diabetes mortality association was also greater in subjects who consumed less than 2.5 pyramid servings of fruits per day (HR=1.28; 95% CI: 1.08–1.53), compared to those who consumed greater amounts (HR=0.93; 95% CI: 0.69–1.27) (p interaction=0.01). For NO2, we largely observed similar patterns to those for PM2.5, including evidence of effect modification by level of fruit consumption effects (p interaction<0.01).
Table 3.
Diabetes Mortality HRs by category of selected risk factors
| PM2.5
|
p-val | NO2
|
p-val | ||||
|---|---|---|---|---|---|---|---|
| HR | 95% CI | HR | 95% CI | ||||
| Age | >65 | 1.28 | 1.04–1.58 | 0.12 | 1.15 | 1.04–1.27 | 0.57 |
| <65 | 1.09 | 0.87–1.38 | 1.04 | 0.93–1.17 | |||
| Sex | Female | 1.03 | 0.79–1.34 | 0.37 | 0.96 | 0.84–1.10 | 0.07 |
| Male | 1.28 | 1.07–1.55 | 1.17 | 1.06–1.29 | |||
| Race | White | 1.10 | 0.93–1.30 | 0.09 | 1.10 | 1.01–1.20 | 0.96 |
| Other | 1.61 | 1.04–2.49 | 0.83 | 0.60–1.15 | |||
| BMI | Obese | 1.30 | 1.05–1.62 | 0.04 | 1.08 | 0.97–1.20 | 0.51 |
| Overweight | 1.13 | 0.77–1.65 | 1.13 | 0.99–1.29 | |||
| Normal | 1.07 | 0.83–1.40 | 1.08 | 0.89–1.30 | |||
| Smoke | Ever | 1.22 | 1.02–1.47 | 0.37 | 1.10 | 1.00–1.21 | 0.91 |
| Never | 1.19 | 0.90–1.58 | 1.10 | 1.01–1.20 | |||
| Vegetable | >2.5 pyramid servings/day | 1.38 | 1.05–1.82 | 0.93 | 1.13 | 0.99–1.30 | 0.79 |
| <=2.5 pyramid servings/day | 1.11 | 0.93–1.34 | 1.11 | 1.02–1.20 | |||
| Fruits | >2.5 pyramid servings/day | 0.93 | 0.69–1.27 | 0.01 | 0.93 | 0.79–1.09 | <0.01 |
| <=2.5 pyramid servings/day | 1.28 | 1.08–1.53 | 1.17 | 1.08–1.27 | |||
| Fat | >100 g/day | 1.13 | 0.83–1.54 | 0.89 | 1.13 | 0.96–1.32 | 0.21 |
| <=100 g/day | 1.20 | 1.01–1.43 | 1.07 | 0.99–1.17 | |||
| Pre-Heart | Yes | 1.23 | 0.94–1.61 | 0.72 | 1.10 | 0.96–1.26 | 0.55 |
| No | 1.21 | 1.00–1.45 | 1.11 | 1.01–1.22 | |||
| Pre-Diabetes | Yes | 1.14 | 0.95–1.37 | 0.77 | 1.07 | 0.98–1.17 | 0.82 |
| No | 1.23 | 0.92–1.64 | 1.07 | 0.92–1.23 | |||
Adjusted for age, sex, and location as strata; and race, BMI, education, smoking, and marriage at individual-level; and median income and % with high school education at census-tract level
Discussion
In this analysis, long-term exposure to both PM2.5 and NO2 were found to be significantly associated with increased risk for diabetes mortality in a large, well-characterized U.S. cohort, implicating air pollution exposure as an important modifiable environmental risk factor for diabetes mortality. The strength of the relationship was robust to various model and exposure assessment specifications, and also generally consistent among the observed subgroups, although several subpopulations had significantly elevated risks, notably among those who are obese and consumed lower levels of fruits. The significant NO2 association is suggestive of a role by traffic-related air pollution, but as tracers for other sources are not available, it was not possible to eliminate other PM2.5 sources as possible contributors to the PM2.5-diabetes mortality association found here.
The results here further contribute to the body of evidence from numerous investigations thus far that have reported generally positive associations between ambient air pollution exposure and diabetes. PM2.5 exposure was related to increased diabetes prevalence in a US-wide ecologic study (Pearson et al., 2012), and the studies that have assessed long-term exposure to PM2.5 (Chen et al., 2013; Qi et al., 2018), NO2 (Andersen et al., 2012), and O3 (Jerrett et al., 2017; Renzi et al., 2018) in relation to development of diabetes have reported positive findings. Several studies, however, have observed non-significant associations (e.g., Coogan et al., 2016; Eze et al, 2018) with diabetes incidence. Our findings are also consistent with similar prospective cohort studies examining the relationship between air pollution exposure and elevated diabetes mortality risk (Brook et al., 2012; Raaschou-Nielsen et al., 2013; Pope et al., 2015), although such studies did not find evidence of subgroup effect modifications.
Many studies have elucidated biologically plausible pathophysiologic mechanisms of the air pollution-diabetes relationship. Sun et al. (2009) first reported impaired insulin sensitivity, increased visceral adiposity, enhanced systemic inflammation, and impaired vascular endothelial function in mice exposed to PM2.5. PM2.5 exposure also resulted in impaired energy metabolism, increased inflammation in insulin responsive organs, increased brown adipose inflammation, and imbalances in circulating leptin/adiponectin levels in a genetically susceptible diabetic model (Liu et al., 2014). Recent evidence also suggests that PM2.5 exposure induces vascular insulin resistance and inflammation triggered by a mechanism involving pulmonary oxidative stress, suggesting an intermediate step between exposure and development of systemic insulin resistance (Haberzettle et al., 2016). Other proposed mechanisms include alternations in autonomic balance, exacerbating systemic insulin resistance via overactivity of the sympathetic nervous system (Rajagopalan and Brook, 2012), and activation of hypothalamic-pituitary-adrenal axis (Thomson et al., 2013).
Mechanistic evidence for the relationship between air pollution and diabetes is further supported by epidemiologic studies, largely cross-sectional in design, that examine diabetes precursors. In Germany, long-term exposures to PM10 and NO2 increased homeostatic model assessment (HOMA-IR) levels among children (Thiering et al., 2013), and long-term exposures to PM10 and NO2 were associated with elevated levels of biomarkers of insulin resistance (IR), subclinical inflammation, and adipokines (Wolf et al., 2016). Increased PM2.5 exposure was associated with elevated fasting glucose and glycosylated hemoglobin levels in China (Liu et al., 2016), and higher annual average PM2.5 exposure was significantly associated with higher fasting glucose, increased homeostatic model assessment (HOMA-IR), and LDL cholesterol, and lower insulin clearance in a cohort of Mexican-American adults at high risk of diabetes (Chen et al., 2016). Among elderly individuals in Korea, short-term NO2 exposure was associated with elevated HOMA-IR levels, with increased susceptibility for participants carrying risk genotypes in the oxidative stress-related human glutathione S-transferase genes (Kim et al., 2012). In a recent longitudinal study of Los Angeles Latino children, NO2 exposure negatively affected B-cell function, while higher NO2 and PM2.5 exposures were associated with a faster decline in insulin sensitivity (Alderete et al, 2017). Collectively, the cumulative evidence is generally supportive of a potentially causal association between exposure to air pollutants and diabetes risk, as found here for PM2.5 and NO2, and suggests that air pollution exposure could potentially increase risk of diabetes mortality events by worsening the underlying diabetes disease course or exacerbating glycemic control and insulin resistance.
Of the pollutants considered, we did not observe any statistically significant associations with O3, in contrast to the recent extended analyses of multiple causes of mortality outcomes in the aforementioned ACS (Turner et al., 2016) and CanCHEC (Crouse et al., 2015) cohorts, which utilized more spatially coarse estimates for O3 than the analysis conducted here, reported significant positive findings. Both animal and human exposure studies have also implicated insulin resistance in response to ozone exposure; exposure of rats to ozone have been demonstrated to induce whole-body insulin resistance and oxidative stress via production of lung mediators that induce oxidative stress and disrupting insulin-induced signaling and glucose uptake (Vella et al., 2015), while in a recent study where human subjects were exposed to acute O3 exposures for 2 hours during 15-min on-off exercise, it was found that exposure increased stress hormones and altered peripheral lipid metabolism (Miller et al., 2016). Potential exposure misclassification due to limited exposure assessment (in using more recent years only, 2009–2011) for long-term ozone concentrations in our study, different correlation structures between the co-pollutants across the locations, population differences, and generally lower concentration levels and variability observed for ozone for those in our particular study may be driving the inconsistencies between the cohorts. Both animal and epidemiological studies of ozone exposure in relation to diabetes risk are relatively limited in number, and additional investigations of the ozone-diabetes risk association are warranted.
In our assessments of effect modification by individual risk factors, significantly elevated mortality risks associated with PM2.5 and NO2 were indicated among those who are obese, consistent with past epidemiologic studies that observed elevated effects of PM2.5 in those with such conditions (Dubowsky et al., 2006; Delfino et al., 2010), suggesting that individuals under a chronic state of inflammation may be more susceptible to pro-inflammatory effects of air pollution exposure. However, we did not observe any effect modification by pre-existing comorbidities, although this may be largely due to their less reliable, self-reported nature in this cohort. We also observed effect modification by diet; significantly decreased mortality risks attributable to air pollution were found among those who consumed higher levels of fruits, potentially due to their high antioxidant content and reduction of systemic oxidative stress, and consistent with past evidence that increasing intake of vegetable and fruit consumption decreases incident diabetes risk (Carter et al., 2010). To our knowledge, there are no prior studies reporting this synergism between dietary habits and air pollution exposure on the risk of diabetes, although a few studies have observed attenuated risk of negative health impacts of air pollution from intake of nutritional supplements with anti-inflammatory properties: for example, omega-3 polyunsaturated fatty acid supplementation prevented heart rate variability decline related to PM2.5 exposure (Romeiu et al., 2005), and supplementation with olive oil seemed to protect against the adverse vascular effects of concentrated ambient PM2.5 exposure (Tong et al., 2015). As dietary habits and obesity are well-recognized as traditional modifiable risk factors for diabetes, our results suggest that among such individuals, modification of these risk factors (obesity and diet) may additionally reduce diabetes mortality risk attributable to air pollution exposures.
Primary strengths of this study include: the large size of the cohort, long follow-up period (17 years), exposure assessment of multiple pollutants at the census-tract level using latest prediction models, evaluation of time-varying exposures, and availability of information on detailed individual-level risk factors (including diet, BMI, smoking history, and pre-diagnosed health conditions). Our cohort characteristics and study design address some of the limitations noted in past published long-term air pollution exposure-diabetes mortality studies, such as a lack of personal-level information on smoking history or BMI. However, several potential weaknesses also exist in this study; as residence census tract and personal covariates were recorded at baseline and prospective changes in these factors could not be accounted for, except that follow-up was censored when participants moved out of the study region. In addition, we could not differentiate whether the deaths were due to type 1 or type 2 diabetes. Also, our analysis concerned diabetes as an underlying cause of death and did not consider contributory cause to cardiovascular mortality and other diseases to which diabetics are susceptible; nevertheless, the previous studies have found excess mortality whether diabetes was considered as an underlying or contributory cause (Raaschou-Nielsen et al., 2013; Pope et al., 2015). We also did not adjust for exposure to traffic noise, a correlate and potential confounder of traffic-related air pollution, which has been shown to be associated with elevated diabetes risk (Clark et al., 2018; Eze et al., 2017).
In the U.S., approximately 22 million adults (11% prevalence) have diagnosed type 2 diabetes mellitus (T2DM), with the greatest prevalence in people 65 years of age or older (Menke et al., 2015; CDC 2014). Diabetes imposes a sizable burden on U.S. society, with an estimated total economic cost in 2012 of $245 billion (accounting for 1 in every 10 health care dollars spent), due to increased use of health resources and lost productivity (Yang et al., 2013). Given the ubiquitous nature of ambient air pollution and the risks attributable to exposure, the associated dollar costs and valuations are likely to be substantial. On the other hand, air pollution exposure is a risk factor potentially modifiable by regulatory interventions in lieu of the challenges of societal changes in the public’s personal behaviors and diets. Thus, our results contribute to a growing body of evidence suggesting that policies aimed at improving air quality could provide an efficient way to ease the public health and economic burden imposed by diabetes, in the U.S. as well as the developing world. National efforts have been successful thus far in lowering population exposure to air pollutants; remarkably, from 2000 to 2012 the annual average PM2.5 concentrations dropped 33% while NO2 dropped 31% (EPA 2013). Nevertheless, with an aging population, continued abatement efforts and monitoring of associated health effects are needed to maintain and improve on these gains in public health. The significantly elevated mortality risks attributable to PM2.5 and NO2 that were observed among individuals with modifiable risk factors traditionally associated with diabetes also suggest that potential health benefits of lifestyle improvements (e.g. dietary changes) may well be larger than previously reported.
Conclusions
In this study, we found statistically elevated diabetes mortality risk associated with PM2.5 and NO2 in a large prospective U.S. cohort, corroborating past studies, with significant effect modification by BMI and fruit consumption levels. The public health implications our findings are likely even greater in developing nations, where the prevalence of obesity and diabetes as well as air pollution concentration levels are both rising. Additional research is necessary in such locations, where, in addition to the elevated concentration levels, the composition of pollutants (e.g., PM2.5 constituents) and population characteristics (e.g., age distribution) likely differ markedly from industrialized countries, where the bulk of past studies have been conducted to date.
Highlights.
The NIH-AARP Diet and Health Study, a prospective cohort with more than a half million participants and a follow-up period of 17 years, was linked with latest prediction models for PM2.5, NO2, and O3
Long-term exposures to PM2.5 and NO2 are significantly associated with elevated diabetes mortality risk
The associations were significantly modified by BMI and total fruit consumption
Acknowledgments
The study is supported by National Institute of Health NIEHS (1R01ES019584–01A1, R21 ES021194) and NYU NIEHS Center of Excellence (grant ES00260). C.C.L analyzed the data and wrote the manuscript. D.S, R.J, J.A, and Y.S edited the manuscript and contributed to discussion. C.G developed the O3 dataset for California and edited the manuscript. R.B.H and G.D.T are the main investigators for the study and edited the manuscript.
Footnotes
Publisher's Disclaimer: This is a PDF file of an unedited manuscript that has been accepted for publication. As a service to our customers we are providing this early version of the manuscript. The manuscript will undergo copyediting, typesetting, and review of the resulting proof before it is published in its final citable form. Please note that during the production process errors may be discovered which could affect the content, and all legal disclaimers that apply to the journal pertain.
Disclaimer
The opinions expressed in this article are solely those of the authors and do not represent the official position or policy of the State of California, the California Environmental Protection Agency, or the California Air Resources Board. The mention of trade names, products, and organizations does not constitute endorsement or recommendation for use.
References
- Alderete Tanya L. Longitudinal associations between ambient air pollution with insulin sensitivity, β-cell function, and adiposity in Los Angeles Latino children. Diabetes. 2017;66(7):1789–1796. doi: 10.2337/db16-1416. [DOI] [PMC free article] [PubMed] [Google Scholar]
- Andersen ZJ, Raaschou-Nielsen O, Ketzel M, Jensen SS, Hvidberg M, Loft S, Sørensen M. Diabetes incidence and long-term exposure to air pollution: A cohort study. Diabetes Care. 2012;35(1):92–98. doi: 10.2337/dc11-1155. [DOI] [PMC free article] [PubMed] [Google Scholar]
- Brook RD, Cakmak S, Turner MC, Brook JR, Crouse DL, Peters PA, Burnett RT. Long-Term Fine Particulate Matter Exposure and Mortality From Diabetes in Canada. Diabetes Care. 2013;36(10):3313–3320. doi: 10.2337/dc12-2189. [DOI] [PMC free article] [PubMed] [Google Scholar]
- Brook RD, Jerrett M, Brook JR, Bard RL, Finkelstein MM. The relationship between diabetes mellitus and traffic-related air pollution. J Occup EnvironMed. 2008;50(1):32–8. doi: 10.1097/JOM.0b013e31815dba70. [DOI] [PubMed] [Google Scholar]
- Brook RD, Rajagopalan S, Pope CA, Brook JR, Bhatnagar A, Diez Roux AV, Kaufman JD. Particulate matter air pollution and cardiovascular disease: An update to the scientific statement from the american heart association. Circulation. 2010;121(21):2331–2378. doi: 10.1161/CIR.0b013e3181dbece1. [DOI] [PubMed] [Google Scholar]
- Carter P, Gray LJ, Troughton J, Khunti K, Davies MJ. Fruit and vegetable intake and incidence of type 2 diabetes mellitus: systematic review and meta-analysis. British Medical Journal. 2010;341(7772):c4229. doi: 10.1136/bmj.c4229. [DOI] [PMC free article] [PubMed] [Google Scholar]
- Centers for Disease Control and Prevention. National diabetes fact sheet: national estimates and general information on diabetes and prediabetes in the United States 2015. Atlanta, GA: U.S. Department of Health and Human Services, Centers for Disease Control and Prevention; 2015. http://www.cdc.gov/diabetes/pubs/pdf/ndfs_2011.pdf Accessed October 22, 2015. [Google Scholar]
- Clark C, Sbihi H, Tamburic L, Brauer M, Frank LD, Davies HW. Association of long-term exposure to transportation noise and traffic-related air pollution with the incidence of diabetes: A prospective cohort study. Environmental Health Perspectives. 2017;125(8):1–10. doi: 10.1289/EHP1279. [DOI] [PMC free article] [PubMed] [Google Scholar]
- Chen Z, Salam MT, Toledo-Corral C, Watanabe RM, Xiang AH, Buchanan TA, Gilliland FD. Ambient air pollutants have adverse effects on insulin and glucose homeostasis in mexican americans. Diabetes Care. 2016;39(4):547–554. doi: 10.2337/dc15-1795. [DOI] [PMC free article] [PubMed] [Google Scholar]
- Crouse DL, Peters PA, Hystad P, Brook JR, van Donkelaar A, Martin RV, Burnett RT. Ambient PM2.5, O3, and NO2 Exposures and Associations with Mortality over 16 Years of Follow-Up in the Canadian Census Health and Environment Cohort (CanCHEC) Environmental Health Perspectives. 2015;123(11):1180–1186. doi: 10.1289/ehp.1409276. [DOI] [PMC free article] [PubMed] [Google Scholar]
- Coogan PF, White LF, Yu J, Burnett RT, Marshall JD, Seto E, Jerrett M. Long term exposure to NO2 and diabetes incidence in the Black Women’s Health Study. Environmental Research. 2016;148(2):360–366. doi: 10.1016/j.envres.2016.04.021. [DOI] [PMC free article] [PubMed] [Google Scholar]
- Delfino RJ, Tjoa T, Gillen DL, Staimer N, Polidori A, Arhami M, Longhurst J. Traffic-related air pollution and blood pressure in elderly subjects with coronary artery disease. Epidemiology (Cambridge, Mass) 2010;21(3) doi: 10.1097/EDE.0b013e3181d5e19b. [DOI] [PMC free article] [PubMed] [Google Scholar]
- Dijkema MB, Mallant SF, Gehring U, van den HurkK, Alssema M, van Strien RT, et al. Long-term exposure to traffic-related air pollution and type 2 diabetes prevalence in a cross-sectional screening-study in the Netherlands. Environ Health. 2011;10:76. doi: 10.1186/1476-069X-10-76. [DOI] [PMC free article] [PubMed] [Google Scholar]
- Donath MY, Shoelson SE. Type 2 diabetes as an inflammatory disease. Nat Rev Immunol. 2011;11:98–107. doi: 10.1038/nri2925. [DOI] [PubMed] [Google Scholar]
- Dubowsky SD, Suh H, Schwartz JD, Coull Ba, Gold DR. Diabetes, obesity, and hypertension may enhance associations between air pollution and markers of systemic inflammation. Environmental Health Perspectives. 2006;114(7):992–998. doi: 10.1289/ehp.8469. [DOI] [PMC free article] [PubMed] [Google Scholar]
- Eze IC, Hemkens LG, Bucher HC, Hoffmann B, Schindler C, Künzli N, Probst-Hensch NM. Association between Ambient Air Pollution and Diabetes Mellitus in Europe and North America: Systematic Review and Meta-Analysis. Environmental Health Perspectives. 2015;123(5):381–389. doi: 10.1289/ehp.1307823. [DOI] [PMC free article] [PubMed] [Google Scholar]
- Eze IC, Foraster M, Schaffner E, Vienneau D, Héritier H, Rudzik F, Probst-Hensch N. Long-term exposure to transportation noise and air pollution in relation to incident diabetes in the SAPALDIA study. International Journal of Epidemiology. 2017;46(4):1115–1125. doi: 10.1093/ije/dyx020. [DOI] [PMC free article] [PubMed] [Google Scholar]
- Franco OH, Steyerberg EW, Hu FB, Mackenbach J, Nusselder W. Associations of Diabetes Mellitus With Total Life Expectancy and Life Expectancy With and Without Cardiovascular Disease. Archives of Internal Medicine. 2007;167(11):1145. doi: 10.1001/archinte.167.11.1145. [DOI] [PubMed] [Google Scholar]
- Guariguata L, Whiting DR, Hambleton I, Beagley J, Linnenkamp U, Shaw JE. Global estimates of diabetes prevalence for 2013 and projections for 2035. Diabetes Research and Clinical Practice. 2014;103(2):137–149. doi: 10.1016/j.diabres.2013.11.002. [DOI] [PubMed] [Google Scholar]
- EPA. Air trends: particulate matter. U.S. Environmental Protection Agency; 2013. http://www.epa.gov/airtrends/pm.html Accessed November 21, 2016. [Google Scholar]
- Jerrett M, Brook R, White LF, Burnett RT, Yu J, Su J, Coogan PF. Ambient ozone and incident diabetes: A prospective analysis in a large cohort of African American women. Environment International. 2017:6–11. doi: 10.1016/j.envint.2016.12.011. [DOI] [PMC free article] [PubMed] [Google Scholar]
- Liu C, Bai Y, Xu X, Sun L, Wang A, Wang TY, Rajagopalan S. Exaggerated effects of particulate matter air pollution in genetic type II diabetes mellitus. Particle and Fibre Toxicology. 2014;11(27):1–14. doi: 10.1186/1743-8977-11-27. [DOI] [PMC free article] [PubMed] [Google Scholar]
- Liu C, Yang C, Zhao Y, Ma Z, Bi J, Liu Y, Chen R. Associations between long-term exposure to ambient particulate air pollution and type 2 diabetes prevalence, blood glucose and glycosylated hemoglobin levels in China. Environment International. 2016:92–93. 416–421. doi: 10.1016/j.envint.2016.03.028. [DOI] [PMC free article] [PubMed] [Google Scholar]
- Menke A, Casagrande S, Geiss L, Cowie CC. Prevalence of and Trends in Diabetes Among Adults in the United States, 1988–2012. Jama. 2015;314(10):1021–9. doi: 10.1001/jama.2015.10029. [DOI] [PubMed] [Google Scholar]
- Miller DB, Ghio AJ, Karoly ED, Bell LN, Snow SJ, Madden MC, Kodavanti UP. Ozone Exposure Increases Circulating Stress Hormones and Lipid Metabolites in Humans. American Journal of Respiratory and Critical Care Medicine. 2016;193(12):1382–1391. doi: 10.1164/rccm.201508-1599OC. [DOI] [PMC free article] [PubMed] [Google Scholar]
- Osborn O, Olefsky JM. The cellular and signaling networks linking the immune system and metabolism in disease. Nat Med. 2012;18:363–374. doi: 10.1038/nm.2627. [DOI] [PubMed] [Google Scholar]
- Pearson JF, Bachireddy C, Shyamprasad S, Goldfine AB, Brownstein JS. Association Between Fine Particulate Matter and Diabetes Prevalence in the U.S. Diabetes Care. 2010;33(10):2196–2201. doi: 10.2337/dc10-0698. https://doi.org/10.2337/dc10–0698. [DOI] [PMC free article] [PubMed] [Google Scholar]
- Pope CA, Turner MC, Burnett RT, Jerrett M, Gapstur SM, Diver WR, Brook RD. Relationships Between Fine Particulate Air Pollution, Cardiometabolic Disorders, and Cardiovascular Mortality. Circulation Research. 2014;116(1):108–115. doi: 10.1161/CIRCRESAHA.116.305060. [DOI] [PubMed] [Google Scholar]
- Qiu H, Schooling CM, Sun S, Tsang H, Yang Y, Lee RSY, Tian L. Long-term exposure to fine particulate matter air pollution and type 2 diabetes mellitus in elderly: A cohort study in Hong Kong. Environment international. 2018 doi: 10.1016/j.envint.2018.01.008. [DOI] [PubMed] [Google Scholar]
- Raaschou-Nielsen O, Sørensen M, Ketzel M, Hertel O, Loft S, Tjønneland A, Andersen ZJ. Long-term exposure to traffic-related air pollution and diabetes-associated mortality: A cohort study. Diabetologia. 2013;56(1):36–46. doi: 10.1007/s00125-012-2698-7. [DOI] [PubMed] [Google Scholar]
- Rajagopalan S, Brook RD. Air Pollution and Type 2 Diabetes: Mechanistic Insights. Diabetes. 2012;61(12):3037–3045. doi: 10.2337/db12-0190. [DOI] [PMC free article] [PubMed] [Google Scholar]
- Rao X, Montresor-Lopez J, Puett R, Rajagopalan S, Brook RD. Ambient air pollution: an emerging risk factor for diabetes mellitus. Current Diabetes Reports. 2015;15(6):603. doi: 10.1007/s11892-015-0603-8. [DOI] [PubMed] [Google Scholar]
- Reedy J, Mitrou PN, Krebs-Smith SM, Wirfalt E, Flood A, Kipnis V, Subar AF. Index-based Dietary Patterns and Risk of Colorectal Cancer: The NIH-AARP Diet and Health Study. American Journal of Epidemiology. 2008;168(1):38–48. doi: 10.1093/aje/kwn097. [DOI] [PMC free article] [PubMed] [Google Scholar]
- Renzi Matteo, et al. Air pollution and occurrence of type 2 diabetes in a large cohort study. Environment international. 2018;112:68–76. doi: 10.1016/j.envint.2017.12.007. [DOI] [PubMed] [Google Scholar]
- Romieu I, Téllez-Rojo MM, Lazo M, Manzano-Patiño A, Cortez-Lugo M, Julien P, Holguin F. Omega-3 fatty acid prevents heart rate variability reductions associated with particulate matter. American Journal of Respiratory and Critical Care Medicine. 2005;172(12):1534–1540. doi: 10.1164/rccm.200503-372OC. [DOI] [PubMed] [Google Scholar]
- Thiering E, Cyrys J, Kratzsch J, Meisinger C, Hoffmann B, Berdel D, Heinrich J. Long-term exposure to traffic-related air pollution and insulin resistance in children: Results from the GINIplus and LISAplus birth cohorts. Diabetologia. 2013;56(8):1696–1704. doi: 10.1007/s00125-013-2925-x. https://doi.org/10.1007/s00125–013–2925-x. [DOI] [PMC free article] [PubMed] [Google Scholar]
- Thomson EM, Vladisavljevic D, Mohottalage S, Kumarathasan P, Vincent R. Mapping acute systemic effects of inhaled particulate matter and ozone: multiorgan gene expression and glucocorticoid activity. Toxicol Sci. 2013;135:169–181. doi: 10.1093/toxsci/kft137. [DOI] [PMC free article] [PubMed] [Google Scholar]
- Thurston GD, Ahn J, Cromar KR, Shao Y, Reynolds HR, Jerrett M, Hayes RB. Ambient Particulate Matter Air Pollution Exposure and Mortality in the NIH-AARP Diet and Health Cohort. Environmental Health Perspectives. 2015;124(4):484–490. doi: 10.1289/ehp.1509676. [DOI] [PMC free article] [PubMed] [Google Scholar]
- Tong H, Rappold AG, Caughey M, Hinderliter AL, Bassett M, Montilla T, Samet JM. Dietary supplementation with olive oil or fish oil and vascular effects of concentrated ambient particulate matter exposure in human volunteers. Environmental Health Perspectives. 2015;123(11):1173–1179. doi: 10.1289/ehp.1408988. https://doi.org/10.1289/ehp.1408988. [DOI] [PMC free article] [PubMed] [Google Scholar]
- Turner MC, Jerrett M, Pope CA, III, Krewski D, Gapstur SM, Diver RW, Burnett RT. Long-Term Ozone Exposure and Mortality in a Large Prospective Study. American Journal of Respiratory and Critical Care Medicine. 2015;64(6):897–905. doi: 10.1164/rccm.201508-1633OC. [DOI] [PMC free article] [PubMed] [Google Scholar]
- Vella RE, Pillon NJ, Zarrouki B, Croze ML, Koppe L, Guichardant M, Soulage CO. Ozone exposure triggers insulin resistance through muscle c-Jun N-terminal kinase activation. Diabetes. 2015;64(3):1011–1024. doi: 10.2337/db13-1181. [DOI] [PubMed] [Google Scholar]
- Wang B, Xu D, Jing Z, Liu D, Yan S, Wang Y. Effect of long-term exposure to air pollution on type 2 diabetes mellitus risk: a systemic review and meta-analysis of cohort studies. European Journal of Endocrinology / European Federation of Endocrine Societies. 2014;171(5):R173–82. doi: 10.1530/EJE-14-0365. [DOI] [PubMed] [Google Scholar]
- Wolf K, Popp A, Schneider A, Breitner S, Hampel R, Rathmann W, Peters A. Association Between Long-Term Exposure to Air Pollution and Biomarkers Related to Insulin Resistance, Subclinical Inflammation and Adipokines. Diabetes. 2016 Nov;65 doi: 10.2337/db15-1567. [DOI] [PubMed] [Google Scholar]
- Yang W, Dall TM, Halder P, Gallo P, Kowal SL, Hogan PF, Petersen M. Economic costs of diabetes in the U.S. in 2012. Diabetes Care. 2013;36(4):1033–1046. doi: 10.2337/dc12-2625. [DOI] [PMC free article] [PubMed] [Google Scholar]
- U.S. Environmental Protection Agency. Fused air quality surfaces using downscaling tool for predicting daily air pollution [accessed 2016 Nov 2] Available from: http://www.epa.gov/air-research/fused-air-quality-surfaces-using-downscaling-tool-predicting-daily-air-pollution.