

Abstract
Social media are being increasingly used for health promotion, yet the landscape of users, messages and interactions in such fora is poorly understood. Studies of social media and diabetes have focused mostly on patients, or public agencies addressing it, but have not looked broadly at all of the participants or the diversity of content they contribute. We study Twitter conversations about diabetes through the systematic analysis of 2.5 million tweets collected over 8 months and the interactions between their authors. We address three questions. (1) What themes arise in these tweets? (2) Who are the most influential users? (3) Which type of users contribute to which themes? We answer these questions using a mixed-methods approach, integrating techniques from anthropology, network science and information retrieval such as thematic coding, temporal network analysis and community and topic detection. Diabetes-related tweets fall within broad thematic groups: health information, news, social interaction and commercial. At the same time, humorous messages and references to popular culture appear consistently, more than any other type of tweet. We classify authors according to their temporal ‘hub’ and ‘authority’ scores. Whereas the hub landscape is diffuse and fluid over time, top authorities are highly persistent across time and comprise bloggers, advocacy groups and NGOs related to diabetes, as well as for-profit entities without specific diabetes expertise. Top authorities fall into seven interest communities as derived from their Twitter follower network. Our findings have implications for public health professionals and policy makers who seek to use social media as an engagement tool and to inform policy design.
Keywords: Twitter, social networks, diabetes, public health, humour, temporal networks, topic detection
Introduction
Of an estimated 3 billion internet users around the world (over 40% of the global population), approximately 310 million actively use the social networking site Twitter (according to Twitter's own figures from July 2016). Since Twitter's launch in 2006, the platform and its users have been the protagonists of several major events (e.g. the Arab Spring, protest movements in Iran, Spain and elsewhere1–7), and it has become a prominent venue for companies, personalities and ordinary people to broadcast news and events, send public messages, express opinions and socialise.8,9
There is growing interest in the potential uses for Twitter, and other social media, in public and population health. Research has been carried out on the use of Twitter for epidemiological applications and public health surveillance. For instance, influenza spread,10,11 contagious disease outbreaks12 and tobacco use13 have been mapped using public data from Twitter. Geographic or spatial risk factors have also been elucidated using Twitter.14,15 This medium is being increasingly used for health information sharing,16 primary care, delivery of health support, primary prevention and public health education.17–21
Health promotion has typically drawn on unidirectional, top-down social marketing and advertising strategies to disseminate health-related messages to a wide audience.22 The recent use of Twitter in health promotion coincides with the influx of commercial agencies into social media to sell commodities, trends and ideas.22 The confluence of health promotion and commercial agents on Twitter has led to a cacophony of short health-related messages directed at users and passed through social networks. Some users who create and disseminate content have the exclusive aim of promoting health, while others may have additional or alternative aims (e.g. commercial interest, self-promotion). Yet this complex environment is rarely acknowledged in public health promotion research, reviews and planning. Instead, public health marketing strategies and evaluations focus on the quantity of messages disseminated by health authorities over time, the number of followers an account has attracted and the design of new slogans.20,21 There is little critical analysis of the wider landscape of, and relationships underpinning, health-related content on Twitter, or of the impact that messages have in the broad user base.
In this paper, we investigate messages on Twitter (‘what’ is discussed and by ‘whom’) relating to a single clinical and public health concern: diabetes. Diabetes is a clinical condition associated with blood sugar regulation by the hormone insulin and other endocrine factors. Complications associated with unmanaged or poorly managed diabetes can typically affect the heart, blood vessels, eyes, kidneys and nerves. There are two types of diabetes: type 1 (often abbreviated as T1 or T1D on Twitter) occurs when the pancreas does not produce sufficient insulin; type 2 (T2 or T2D) develops when the body does not effectively respond to insulin. In 2012, the global prevalence of diabetes of both types was estimated to be nine percent among adults aged 18 years and over.23 However, this is likely to be an underestimate; in the United States alone, 27.8% of all diabetes cases are thought to be undiagnosed.24 Globally, around 10% of all people with diabetes have T1, which typically requires the daily administration of insulin. The remaining 90% have diagnoses of T2, which is commonly associated with obesity, poor nutrition and physical inactivity. Both types have genetic components, although no known genes directly cause diabetes.23 T2 is managed predominantly through health education, diet and activity change, and weight loss; treatments also may include medication and, in more advanced cases, regular insulin administration.23 People who have diabetes are encouraged to self-surveil their blood sugar levels and self-manage their lifestyles and insulin levels (through diet, physical activity and medications, where prescribed) in order to control their blood sugar levels and minimise related health complications such as those described above.
Previous research on diabetes and social media has focused on the possibilities that the internet and social media open up for both self-management25,26 and clinical management27–29 for people living with the disease. Others have focused on the dissemination of information relating to diabetes-specific outreach events30 or from specific platforms.31 Our approach is different; instead of assuming that patients, clinicians and health promotion organisations are the main protagonists in the Twitter conversation about diabetes, we place all stakeholders on an initial equal footing with respect to Twitter exchanges around the broad category ‘diabetes’.
We compiled over 2.5 million English-language tweets containing the term ‘diabetes’, which were generated by more than one million users over a period of 8 months (March 2013 to January 2014). These are the type of messages that users encounter when they search for the term ‘diabetes’ on Twitter, or click on the hashtag #diabetes. We analysed these tweets (public messages comprising of text strings with a maximum length of 140 characters), using a mixed-methods approach that combines mathematical and computational techniques with anthropological analysis. We used tools from data and network science to detect patterns in social interactions1,32,33 and to extract topics from the messages.34,35 We then interrogated these patterns using discourse analysis approaches from anthropology,36–38 which permit the elaboration of themes, personalities, and contexts. As a result, we extract and classify the topics that appear in the messages, and identify the important participants in the conversations (which include patients, practitioners, public health authorities, commercial entities and others).
Researchers have called for improving our understanding of social media to inform its use in public health policy making and practice.29 Our work contributes to this understanding by addressing three questions. First, what are the main themes of messages posted on Twitter that contain the term ‘diabetes’? To answer this question, we extract the topics that appear in the tweets by processing word co-occurrence networks, and analyse their content, participants, and evolution over time. Second, who talks about diabetes on Twitter and in what capacity? To answer this question, we investigate the Twitter users who drive conversations by analysing networks of interactions (posting, sharing/retweeting, following) among the users. And third, which users contribute content to which topics and themes? We answer this question by examining the type of accounts that post in the different themes. We discuss the relevance of this interdisciplinary research for public health professionals and policy. The methods employed in this project are general and may be applied in other studies where similar data become available.
Methods
Data from Twitter
We collected every tweet containing the term ‘diabetes’ (2,698,114 tweets in total), posted between 26 March 2013 and 19 January 2014 by 1,202,143 different users (Figure 1). We also collected information about ‘retweets’: a retweet event is when a user re-broadcasts a message (or ‘status’) originally posted by another user and which is disseminated to his or her followers. Each retweet is a time-annotated interaction between two users: the target (the author of the original tweet, or the target of the attention) and the source (the user who retweeted the message, or the source of the attention). We recorded 1,219,282 retweets from June 2013 up until when the data collection ended. We also recorded 41,582 friend–follower relationships among a select subset of the users along with their Twitter biographies, messages of at most 140 character in which users can describe themselves. All data were collected by Sinnia using Twitter Gnip PowerTrack API (https://gnip.com/realtime/powertrack/). We have made available a list containing tweet IDs used in this study (see the Data Statement at the end of the article).
Figure 1.

The number of daily tweets in English containing the term ‘diabetes’ (blue line), the number of daily tweets containing some version of the ‘Mathematics joke’, a particularly recurrent tweet (red line, see also Table 7), and the number of tweets mentioning the actor Tom Hanks (green dashed-line), who revealed his diabetes in October 2013.
There is an ongoing debate about the ethical implications of using Twitter data for research. Some authors maintain that the lack of complicated privacy settings on Twitter means that messages placed in the public domain are intended to be there; alternatively, other authors consider that posting tweets should not be interpreted as permission to use tweets for research.39 We believe that the topic, analysis and results presented here serve the public interest and pose no risk to users. None of the tweets we analyse and reproduce here contain notable amounts of sensitive or private material. Indeed, the most prominent users in our data set also maintain other online profiles and produce tweets for public consumption.
Construction of the different networks
The number of ‘diabetes’ tweets follows weekly cycles of activity (Figure 1). Consequently, we group the data into weekly bins. Given that the date of the original message and the date of its retweet are not always the same, retweets are labelled by the date of the original posting.
Retweet network
For each week w, we construct a directed, weighted retweet network with N(w) nodes, corresponding to all of the users who participated in a retweet event either actively (by retweeting) or passively (by having their statuses retweeted by someone else). A directed connection (edge or arc) exists between two nodes if the source node has retweeted the status of the target node, and the weight of the edge corresponds to the number of retweets (see Figure 2), i.e. we define the N(w) × N(w) adjacency matrix of the retweet network as A(w), where the element Aij(w) records the number of retweets from i to j over week w. For a given node, the in-degree corresponds to the number of users who have retweeted statuses of that node, and the out-degree corresponds to the number of users whose status that node has retweeted. In the example network from Figure 3(a), node 1 has retweeted statuses of nodes 3, 4 and 7, and has had nodes 2, 6 and 8 retweet some of her own (i.e. the in- and out-degree of node 1 are both three). A weakly connected component is a group of nodes that are all mutually reachable if we ignore the direction of the edges. For example, the initial network in Figure 3(a) consists of only one weakly connected component, but its co-citation and bibliographic projections (defined below) have six and five components, respectively.
Figure 2.
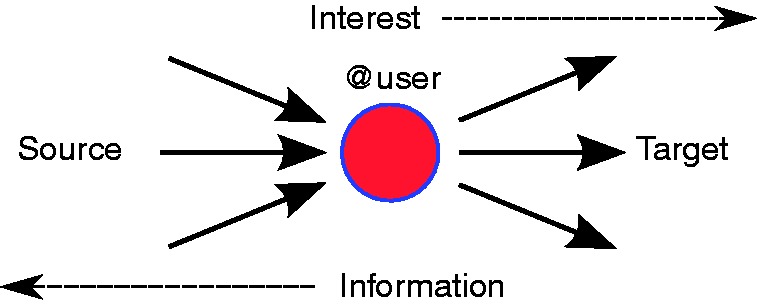
In retweet networks, nodes that are exposed to content can ‘pass it on’ to their followers. The flow of data goes in the opposite direction to the interest of the users, where interest is represented by arrows which indicate the direction of attention.
Figure 3.

(a) Projections of a retweet network. The original retweet network is directed. The co-citation projection joins nodes who are the targets of the interest of other nodes. Nodes 5 and 6 have both been retweeted by node 4, hence they are connected in the co-citation projection (edges in red). In turn, nodes 2 and 8 have both retweeted statuses by node 1, which is why they are connected in the bibliographic projection (edges in magenta). Both of the projections have several disconnected components. (b) Example of retweet, co-citation and bibliographic networks constructed from one week's worth of interactions in our data. There are approximately 44,000 nodes, each coloured according to their weakly-connected component in each network.
In a retweet network, the direction of the edge signifies an explicit declaration of interest (i.e. source nodes find certain messages worth passing along to their followers) and information flows in the opposite direction (i.e. from the target nodes), as shown in Figure 2. Such retweet networks have a distinct structure, with many weakly connected components and an abundance of ‘star’ motifs, in which a highly retweeted node (with high in-degree) is surrounded by many nodes that point almost exclusively to the star node. Figure 3(b) shows a typical network for one week in our data with 44,000 nodes and about 4000 weakly connected components. Over 50% of the nodes belong to a giant connected component (nodes in purple) whereas each of the smaller components contain less that 1% of the nodes.
A fundamental feature of retweet networks is the fact that they are directed (they may contain extreme asymmetry of interest, ‘leaders’ and ‘followers’ and other roles). Directionality entails additional computational challenges, which is why it is often neglected. However, ignoring directionality in such settings destroys valuable information and can severely affect the results and their interpretation.1 Our analysis below takes the directed and temporal nature of the network into full account.
Co-citation and bibliographic projections of the retweet network
To understand not only who drives conversations and produces influential content, but also which users are instrumental in the dissemination of content, we study two useful networks derived from the original retweet network: the co-citation and bibliographic projections.33 These projections reflect the asymmetry of the original adjacency retweet matrix A(w), and provide (a) information about the shared interests of users who have retweeted tweets by the same authors (bibliographic) and (b) information about whose tweets generate responses from the same users (co-citation).
The co-citation network projection of A(w) is an undirected, weighted network defined on the same set of N(w) nodes as the original retweet network with adjacency matrix C(w):
| (1) |
An edge of the co-citation network Ci,j(w) exists when at least one user has retweeted messages from both users i and j during week w. Hence, this network links authors of tweets that elicit interest in users, even though they themselves may belong to different spheres of interest and activity (Figure 3). The number of disconnected nodes in the co-citation network is typically large (Figure 4(a)). For example, all nodes whose in-neighbours have a maximum out-degree equal to 1 in the retweet network will be isolated in the co-citation projection (Figure 3).
Figure 4.
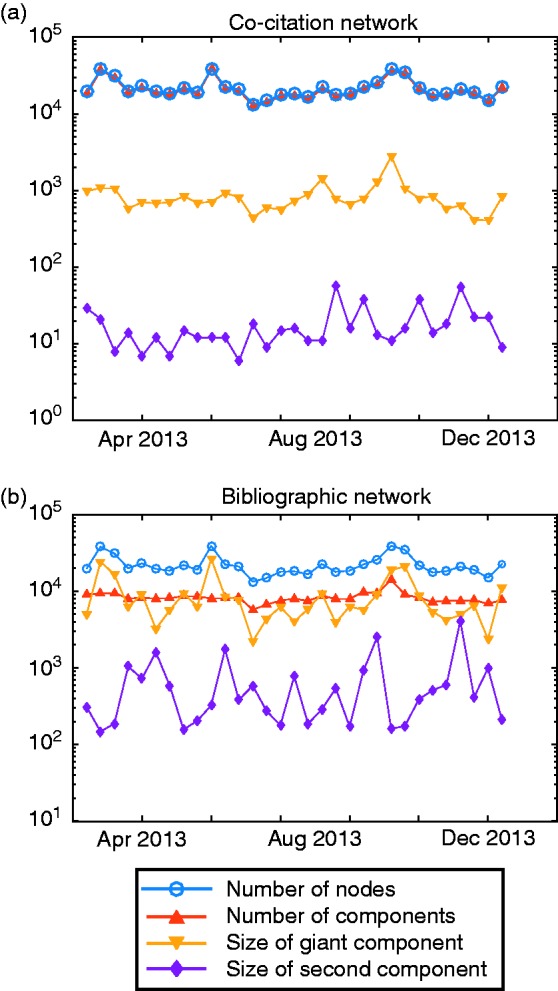
(a) Number of nodes, number of components and size of the two largest connected components in the co-citation projection through the observation period. (b) Same measurements for the bibliographic projection.
The bibliographic network projection is the converse of the the co-citation network. It is also built from the original retweet network A(w) and has adjacency matrix
| (2) |
This projection links pairs of users who have retweeted messages posted by at least one author in common; in other words, the bibliographic projection connects users who share interests. In a retweet networks context the size of the largest component in the bibliographic projection is typically larger than in the co-citation projection (Figures 3(b) and 4); this is due to the fact that, on average, Twitter users retweet more than they are retweeted.
Note that all nodes in the original retweet network exist in both projections. However, depending on their connectivity (induced by the interest elicited or the interest bestowed) they may appear isolated in one or both of the projections. Figure 3 shows an illustration of the construction of the co-citation and bibliographic projections in a simple example, as well as the retweet, co-citation and bibliographic networks compiled from a typical week in the data.
Follower network
In addition to the retweet network, we also constructed a follower network for a small subset of users of interest (see Section ‘The ‘who' of diabetes on Twitter’). In this network a directed connection between two nodes exists when the source node follows the target node on Twitter (i.e. is subscribed to the target's content). The interpretation of the follower network is similar to the retweet network (Figure 2) in the sense that a directed connection is a declaration of interest, with content flowing in the opposite direction.1 One key difference between retweet and follower networks is that connections in the retweet network can be understood as localised expressions of interest associated to a specific tweet, whereas in follower networks a connection may be understood as a more general (and stable) expression of interest.
Computation of the hub and authority scores over time
Hub and authority scores provide a useful tool to analyse directed networks.32 Intuitively, a hub is a node whose outgoing connections point to important nodes in the retweet network (authorities); conversely, an authority is a node with many incoming connections from hubs. The entries of the lead eigenvectors of the adjacency matrices of the co-citation and bibliographic projections C(w) and B(w) correspond to the authority and hub centrality scores of the nodes during week w. A node may rank highly as hub, authority, both or none, as we will show below.
Henceforth, for notational simplicity, we drop the w from the matrices A(w), C(w) and B(w), but the dependence on w remains implicit.
An alternative way to understand hub and authority scores is through the singular value decomposition (SVD) of A: A = UΣVT, where U and VT are unitary matrices containing the left and right singular vectors, respectively, and Σ = diag(σi) is the diagonal matrix of the N singular values. The entries of the leading left and right singular vectors of A correspond to the hub and authority scores, respectively.40
As explained above, the bibliographic and co-citation networks contain several disconnected components (Figures 3 and 4). The largest connected component in a typical co-citation network in our dataset contains about 10–15% of the nodes, yet it is responsible for producing about 50% of messages that have at least one retweet. This observation is consistent with Wu et al.9 who report that about 50% of URLs on Twitter are posted by a small minority of ‘elite users’. On the other hand, since the number of users who retweet is much larger than those whose messages are retweeted, the bibliographic projection has a much larger giant connected component, with about 75% of the nodes.
Given the fragmented nature of the projection networks, we compute hub/authority scores weight-averaged over all components as follows. Let the co-citation network for a given week C have K weakly connected components (excluding components of size 1), which we label with the index k in order of decreasing size (i.e. k = 1 corresponds to the largest and k = K to the smallest component). Therefore, , where Ck is the Nk × Nk adjacency matrix of the kth component. For each component k, we compute the authority score, vk:
where is the largest eigenvalue and vk is normalised such that all its entries add up to 1 (i.e. ‖vk‖1 = 1). The authority score of the ith user in component k is vk(i). We then aggregate the authority scores of all components into the weight-averaged vector . The score for each node is weighed according to the size of the component in which it is found, thus ensuring that the scores are comparable and that we do not discard information from the smaller components.
To extract the hub scores in each week we follow the same procedure on matrix B.
Topic extraction
Topic extraction from the data proceeds in several steps. First, the tweets in the dataset are grouped in weekly bins (as for the networks constructed above). For each week, the raw text is pre-processed and a word co-occurrence network is created. The probability that the tweets in each bin belong to different topics is computed using techniques from textual analysis and community detection for graphs. Note that topics are extracted using only the original tweets: retweets are excluded because they do not add any new topical information. The details of each of the steps for topic extraction are as given as follows.
Text pre-processing
Prior to topic extraction, the text of each tweet is processed in the following way.
Convert words to lowercase, e.g. the terms ‘diabetes’, ‘Diabetes’ and ‘DIABETES’ are all processed as the same word.
Remove all punctuation signs and non-alphanumeric characters, i.e. we compare tweets based only on the words they contain.
Replace collocations for specific terms (e.g. ‘Type 2’ or ‘T2D’ are replaced by ‘type2’) in order to homogenise terms that are known to refer to the same concept.
Remove stop-words and special words (articles, conjunctions, etc.),35 numbers and vestigial URLs, which bear no topical information.
Stem the text.41 This step strips suffixes so that related words are mapped to the same stem, e.g. ‘house’, ‘houses’, ‘housing’ are replaced by ‘hous’.
The result of this pre-processing step is illustrated in Table 1, which contains examples of ‘raw tweets’ and their processed version.
Table 1.
Examples of ‘raw tweets’ and their processed version prior to topic extraction.
| Raw tweet | Processed tweet |
|---|---|
| US FDA approves Johnson & Johnson diabetes drug, canagliflozin – Reuters http://t.co/pKYCbqiVAZ #health | us fda approv johnson johnson drug canagliflozin reuter health |
| SAVOR-TIMI 53 sets new standard for cardiovascular outcome trials in diabetes http://t.co/j9jkB1RagE #pharma | savortimi set standard cardiovascular outcom trial pharma |
| RESEARCH AND MARKETS: Type 2 Diabetes – Pipeline Review, H2 2013 http://t.co/5afh5ypDTl | research market type2 pipelin review h2 |
| Last Dec my son (then 4) was diagnosed with type 1 Diabetes. JDRF UK do excellent research into prevention, lifestyle and cure. #walkforcure | last dec diagnos type1 jdrf uk excel research prevent lifestyl cure walkforcur |
Topic extraction from word co-occurrence graphs
After text pre-processing, we extract the topics from the tweets in each weekly bin in the following steps.
Following Lancichinetti et al.,34 we create a word adjacency graph for each weekly bin. The nodes in the graph are words, and edges indicate two words that co-appear in tweets with higher probability than one would expect at random (i.e. when the probability of such an edge in a random network with the same degree sequence is less than 0.05).
We analyse the word co-occurrence graph using Markov Stability42,43 (in contrast with the use of Infomap in Lancichinetti et al.34) to extract relevant communities (or groups) of words that co-appear in tweets more consistently than with words outside of their own group, and to consider groupings of different granularity.1,44
The communities of words are used as the input for the Latent Dirichlet Allocation (LDA) topic extraction method.45 Hence, the communities obtained with Markov stability provide an initial guess for the topics to which a tweet is likely to belong. Specifically, we assume that each document (tweet) di belongs to a topic (community) tk with a prior probability P0(di|tk) that is proportional to the number of words that document di has in topic tk. LDA then proceeds iteratively to produce the posterior probability that document di belongs to each topic tk: P(tk|di). LDA also produces P(hj|tk), the probability of finding word hj in a document given topic tk.
We make the assumption that, given their brevity, each tweet can only belong to at most one topic. This entails collecting only the assignments of topics to documents with abnormally large values (i.e. the outliers) of P(tk|di), and discarding all other values. A tweet is assigned to a topic if P(tk|di) > pc(99) + IPR, where pc(99) is the 99th percentile of the distribution and IPR is the inter-percentile range: IPR = pc(99) − pc(1). Figure 5(a) shows an example of this criterion where a tweet about the FDA's approval of a diabetes drug is assigned to a topic that contains almost 2000 tweets about this event.
Figure 5.
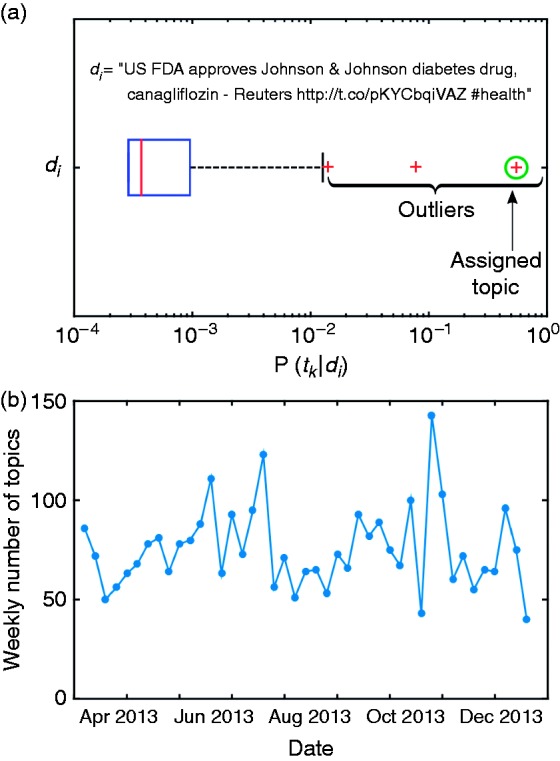
(a) Box-plot of the posterior probability of a specific tweet di after LDA optimisation. The red line indicates the median LDA assignment score for this tweet, the box indicates the 25th and 75th percentiles, and the whiskers mark the interpercentile range (IPR, see the text). There are three topics (red crosses) that lie outside the interpercentile range, the one furthest to the right is designated as the topic of the tweet. This tweet belongs to a topic which covers the FDA's approval of a diabetes drug in late March 2013. The topic belongs to a theme the ‘Commercial’ thematic group in Table 2. (b) The number of topics extracted varies for each week with an average of 75.
This method for topic extraction is applied separately to each of the 43 weeks in our dataset. Figure 5(b) shows the number of topics in each week. The average number of topics per week is 75.
Themes from topics
In order to identify the dominant themes in the dataset, we applied open thematic coding38 to the topics obtained in the previous section, for a random selection of weeks. In total, we analysed in-depth 290 topics (from weeks 34, 39, 44 and 50 of 2013, and week 2 of 2014) containing 63,000 processed tweets with identified topic.
The analysis consisted of reading all of the tweets in each topic, and assigning a label to the topic according to the dominant theme present. In general, one or two themes clearly dominated each topic. In some cases, tweets in one topic were too mixed to identify one single theme; in this case, we did not assign a theme label but we read the tweets to ensure that no new themes emerged within the topic. As per standard practice, we continued this process until saturation; that is, until no new themes emerged from the evaluation of topics, and the repetition of existing theme labels was constant.37 This process was repeated twice by the same researcher to ensure consistency. For ease of representation, we then grouped the themes identified through open thematic coding into thematic groups, as seen in Table 2.
Table 2.
Thematic groups and associated themes obtained through open coding applied to the topics detected in the tweets of the collected dataset.
| Thematic group | Theme |
|---|---|
| Health information | Public health messages |
| Links to articles, blogs and studies about risks, treatment and cure | |
| Population health fears | |
| Publicity about outreach and awareness events and activities | |
| Advice about diabetes management and diagnosis | |
| Lifestyle, diet and cookery tips, news and links | |
| Life stories and experiences (some for marketing purposes) | |
| Dangers of sugar, sugar replacements and/or soda | |
| News | Headline links to particular ‘breakthrough’ studies or technologies |
| Celebrity news | |
| General news articles about diabetic people or pets | |
| News relating to the pharmaceutical industry and the economy | |
| Social interaction | Users joking about how what they have eaten is likely to give them diabetes |
| Chatter and social interchanges that include mentions of diabetes | |
| Everyday experiences of diabetes | |
| Stigmatising comments | |
| Banter and sexual innuendo and humour relating to sweetness and diabetes | |
| Commercial | Advertisements for jobs in the pharmaceutical and care industries |
| Marketing for a specific product, app, treatment, event or service | |
| Pharmaceutical, health industry and stockmarket updates and FDA approvals | |
| Sale of diabetes drugs, diets or treatment products online | |
| Recurrent content | Song lyric: ‘All the time’ by Jeremih47 |
| Song lyric: ‘I'm still happy’ by Boosie Badazz48 | |
| Viral ‘fact’: Alcohol reduces diabetes risk | |
| Viral ‘fact’: Urine tasting | |
| The mathematics joke |
In summary, our analysis of content progressed as follows: first, we automatically extracted weekly topics from the tweets; second, we manually applied open thematic coding until saturation to obtain a list of coded themes; and third, we manually placed these themes into thematic groups.
In order to learn which themes dominated in tweets by the most influential accounts, we also analysed the tweets by the top authority nodes. Here, tweets belonging to each user were coded according to themes identified in the thematic analysis.
Interest communities in the follower network of authorities
To complement the textual analysis above, we also analysed the community structure of the follower network of the 1000 accounts with the highest cumulative authority score over the observation period. The giant connected component of this network comprises 880 nodes, with the rest being either isolated or suspended. To extract the communities in the networks, we used the Markov stability community detection framework as described by Beguerisse-Díaz et al.1 and Amor et al.46; we found a robust partition of the network into seven communities of different size. We labelled the communities according to the type of accounts that each contains (e.g. health agencies, diabetes advocacy, research scientists and so on).
Results
The ‘what’ of diabetes on Twitter
As described above, the tweets in our dataset were first automatically grouped into topics, and their content was then manually assigned themes using open thematic coding. These themes fall into one of four broad thematic groups: health information, news, social interaction and commercial. For tweets in these groups, although the content and messages changed from week to week, the themes remained constant. In addition to these four thematic groups, we identified a fifth group of tweets with consistent and recurrent content. In this distinct group, the specific content was repeated consistently across the data sample (i.e. the tweets did not change from week to week). In Table 2, we present the thematic groups and the themes within each group. Figure 6 contains a visual summary of the thematic groups as ‘word-clouds’ with the 200 top words in each thematic group (i.e. the words most likely to appear in the topics), and ‘word-clouds’ with the usernames (scaled to size of number of tweets) of the 200 most active users (available also as a supplementary spreadsheet, see the Data statement). Note that the term diabetes has been removed from the analysis because it appears in all of the tweets. It is important to remark that the most active users (e.g. those who tweet the most) are not necessarily the most important, or ‘central’ in the different networks, from the point of view of information generation.
Figure 6.

Top 200 words and most frequent authors in each of the thematic groups in Table 2. The size of each word is proportional to its probability of appearing in a topic in the group. The size of the username is proportional to the number of tweets in the thematic group.
We now discuss in more detail the themes, topics and users found in each of the five thematic groups.
Health information tweets
One of the largest thematic groups consists of health information, research findings, recommendations, advice and warnings, which are all abundantly tweeted and retweeted. Figure 6(a) contains a word-cloud with the 200 most probable words in the topics of this group (the total number of distinct terms is 29,647 in 90 topics from open thematic coding). The top 10 words in this thematic group are: risk, type2, disea (disease, diseased), heart, research, month, obe (obese, obesity), fruit, news, awar (aware, awareness). Such terms are typical of tweets that fall within this broad thematic group, as seen in Figure 6(a) and the supplementary spreadsheet, as well as in Table 3 at the end of the article containing specific examples of tweets. The tweets in this group include information about diabetes (its causes, treatments and cures); technologies and pharmaceutical products that can be used for managing it; as well as risks associated with the disease. Other health-related messages include publicity about outreach and awareness events, activities and information. These individual messages are typically not long-lived, and are only visible at the top of a user's timeline for short periods of time.49 In general, there is a high turnover in the content that each user is exposed to, even though many messages (e.g. those from newspapers and online media) are posted multiple times. One of the themes that is less variable in this regard concerns the dangers of sugar, sugar replacements and/or sodas. Its frequency is unsurprising given the nature of diabetes as a problem of blood sugar regulation. It is worth mentioning that the largest spike of activity in our data (in November 2013, see Figure 1) is in part due to a surge in tweets about World Diabetes Day on 14 November 2013.
The health information in the collected sample does not appear to be directly or specifically associated with health promotion groups. Instead, such tweets are posted by users with different claims to expertise: individuals who have experienced diabetes; personal trainers marketing their services; companies selling lifestyle products or services; and other users with an apparent interest in diabetes, cookery and healthy eating. These tweets include advice about diabetes management and diagnosis, cookery and diet tips, life stories and experiences, and links to articles about new treatments or promising cures. Some tweets make claims about ‘curing’ diabetes, or offer natural or ‘miracle’ treatments. Advice of this nature appears to be authoritative in tone and language, making it difficult to distinguish it from advice disseminated by official health authorities. Links contained in such tweets point to different types of authoritative sources of content: from people who have first-hand experience of diabetes, to marketing agencies trying to sell a particular food, supplement or device, to hospitals attempting to communicate a specific health message. Home remedies and ‘miracle’ cures appear alongside health tips and recommendations. Digests and newsletters specifically containing diabetes-related news (where the authors gather information from multiple sources around the internet and supply it to their followers) appear at different moments in time and mix all such messages together.
News tweets
News-related tweets in the collected dataset typically list a headline of a news article; they sometimes give the first line of the story and often also provide a weblink to the complete story. These tweets rarely relate to health promotion or education messages. Figure 6(b) contains the 200 most probable words theme (out of 10,416 in 29 topics). The top 10 words are: type2, risk, fruit, type1, eat, peopl (people, peoples), blueberri (blueberry, blueberries), cut, research, juic (juice, juicer, juicing, juicy). Some news-related tweets communicate research breakthrough studies or technologies, which may be reported with messages of hope for those who have diabetes, in particular T2. Just as common in this thematic group are tweets with celebrity news (especially about celebrities diagnosed with diabetes) and diverse news about people or pets with diabetes. Another prominent theme in this group consists of tweets disseminating news headlines about the pharmaceutical industry and stock market. Diabetes treatment is a lucrative industry because diabetes is a chronic condition that requires regular and ongoing treatment (rather than cure), and so the demand for pharmaceutical products and lifestyle aids is inelastic.50 Furthermore, the number of people with T2 is projected to increase dramatically in the future as a result of population ageing and obesity,51 which will further expand the market. Table 4 contains examples of tweets in this category.
Social interaction and humorous tweets
Twitter is not simply an information-sharing technology, but also a space that permits (virtual) social interaction.3,8 Social interaction tweets use language differently to the thematic groups above: they are typically informal in tone, their attention to spelling and grammar is limited, and they often use exclamation marks and punctuation to express fun, laughter, exasperation, sarcasm, irony, and abuse. The top 10 words (out of 31,061 in 97 topics) in this group are: give, health, food, die, think, fat, year, diet, diseas (disease, diseased), cau (cause, causes, causing). See Figure 6(c) for the theme's word-cloud. Users frequently joke about how what they have eaten is likely to give them diabetes, with a wide variety of sugary foods and drinks, junk foods and other ‘unhealthy’ options being cited. Such tweets indicate a level of awareness of dietary guidelines and diabetes aetiology. Users have conversations and interact about a diversity of topics in chatter that is not necessarily directly related to diabetes but may include references to it. People who have diabetes, particularly T1, also talk about their daily experiences of their bodies, sugar management, and social acceptance or stigma; such tweets may elicit retweets or messages of support from others. Some users also talk in terms of “us” (with T1) and “them” (without). For example, one user talks about T1 as being a ‘perk’ or feature he/she looks for in a romantic partner:
I haven't stopped thinking about this girl for seriously like…a month. AND she has diabetes! #diabetesperks
Such chatter often elicits retweets and replies, including messages of support, or appreciation of a joke.
On the other hand, stigmatising comments, especially tweets which blame diabetic people for bringing the disease on themselves through, for example, poor diet or lack of physical activity, are abundant in the dataset. Figure 6(c) and the supplementary spreadsheet contain numerous examples of profanity and pejoratives. Faced with such messages, users with T1 diabetes frequently point out that it is important to differentiate between T1 and T2, insinuating that while T1 diabetes is not a person's ‘fault’, T2 may well be. Other tweets include calling other people ‘diabetic’ as an insult and wishing diabetes upon a person a user does not like. Table 5 contains examples of social interaction, humorous and stigmatising tweets.
A distinct theme in this category consists of tweets with sexual innuendo. At their mildest, such tweets refer to boy-band members or other (often celebrity) ‘crushes’ that are so sweet they are diabetes-inducing. At their most extreme, tweets joke that others' bodily fluids and genitals are so sweet they are diabetes-inducing. These tweets contain weblinks to pornography websites or other explicit material. Like the jokes discussed earlier, these tweets reflect a baseline awareness of the links between sugar and diabetes.
Commercial tweets
As mentioned previously, diabetes is an industry with an attractive (and expanding) market: it is a chronic condition which is currently incurable, and it requires constant and regular testing, surveillance and treatment. The top 10 words (out of 5841 words in 20 topics) in this group are: type2, drug, job, manag (manage, manager), care, health, marijuana, sale, test, forsal (for sale). See Figure 6(d) for the theme's word-cloud and the most active users within this topic. People with diabetes depend on different technologies, consumables, health services and pharmaceutical products. This commercial dimension of diabetes is reflected in many Twitter messages. Tweets concerned with stockmarket listing announcements, FDA approval (e.g. Figure 5(a)), court cases and business recruitment (for example, a company hiring a new CEO or advertising for new staff) are common. Table 6 contains typical examples of these types of message.
Recurrent content
While the specific content of tweets in different themes varies over time, there are some tweets whose content appears consistently across time over our dataset. The top 10 words (out of 8731 words in 19 topics) in this theme are: sugar, eat, blood, sweet, risk, type2, drink, high, reduc (reduce, reducing, reduction), health. Figure 6(e) contains this theme's word-cloud. There is a large number of tweets repeating lyrics from two specific rap songs, both of which contain the term ‘diabetes’ (see Table 7). Of these, ‘All the Time’ by Jeremih47 was released in 2013, so it is possible that the appearance of one line from the song in many tweets in our sample may be linked to marketing and initial responses to the song. The lyric repeated from the song relates to the sexual innuendo discussed previously, so its continued presence may result from it being used to express a joke rather than as a direct and deliberate citation (indeed, the song name or artist are rarely mentioned). The second song ‘I'm Still Happy’ by Lil Boosie (now Boosie Badazz)48 was released on a 2010 digital mixtape, suggesting that the lyric has been consistently attractive to users over time. This lyric is about determination in the face of challenges; the artist himself has T1 and has talked with his fans about the challenge of managing his diabetes.
In addition, several specific viral ‘facts’ and jokes are posted frequently and repeatedly (for example, that tasting urine for sweetness was a method to detect diabetes in the past,52 or that consuming alcohol moderately has been reported to reduce diabetes53). These few specific facts appear to intend to entertain or amuse. They retain almost identical phrasing over time, with sustained popularity. In fact, such facts are repeated more consistently over time than other headlines, health messages and reports.
One of the most prominent instances of recurrent content in our data corresponds to various versions of a mathematics-themed joke. A typical instance of this joke is
Math Problems: If Jim has 50 chocolate bars, and eats 45, what does he have? Diabetes. Jim has diabetes…
See Table 7 for more versions of the same joke. This joke appears consistently in our dataset (44,130 times including retweets, Figure 1). As with other jokes about certain foods that are linked to diabetes, for this joke to be amusing or entertaining (which its sheer volume suggests it is to many) it requires that readers and retweeters have a minimum awareness that certain foods might contribute to diabetes. To highlight the consistency with which the mathematics joke appears in our data, we compare it in Figure 1 with the number of tweets mentioning Tom Hanks. In October 2013, TomHanks announced he had type 2 diabetes, which was discussed and shared widely on Twitter (13,454 tweets in our dataset). In contrast to the mathematics joke, the number of tweets about Tom Hanks displays an abrupt ‘exogenous peak’ (evidence of external events affecting the behaviour of a system54) followed by a steady relaxation to a baseline level.
The ‘who’ of diabetes on Twitter
We now turn our focus to the analysis of the users in the retweet networks extracted from our dataset. Figure 6 provides a visual illustration of the users that posted more tweets in the topics contained within each of the thematic groups. Although helpful, this figure does not provide information about how important these users are perceived to be in the community, or the impact they have in the conversation about diabetes. Therefore, in order to understand who are the key users that influence diabetes-related content on Twitter over time, we examine the hub and authority scores of all nodes for each of the weekly retweet networks from June 2013 to January 2014 (see Section 2.3 for a description of the methodology). We then examine the content generated by the most important users (according to their hub and authority scores), and we finally analyse their follower network (i.e. who follows whom within this group of important users).
Authorities and hubs in the weekly retweet networks
Authority nodes. Figure 7 shows the score over time for the top 10 authorities ranked by their aggregate weekly score. Of these authorities, nine are institutional accounts and one belongs to an individual blogger, Kelly Kunik (@diabetesalish). This blogger is a diabetes advocate who has had T1 for over 30 years and is involved with a number of diabetes advocacy organisations. She also administrates the Diabetesaliciousness blog (http://diabetesaliciousness.blogspot.co.uk/), which ‘spreads diabetes validation through humour, ownership and advocacy’. Kunik's tweets and blog posts are humorous, casual and interpersonal in style.
Figure 7.

Top 10 users by aggregate authority score, number of weeks with non-zero authority score and a brief description.
Three of the nine institutional accounts belong to stockmarket-listed commercial ventures (i.e. established with the purpose of generating profits for shareholders). Of these, two (@diabetesfacts and @EverydayHealth) belong to Everyday Health Media. This company, which does not claim to have any specific diabetes expertise, owns and operates a range of brands. It was founded in 2002 by Ben Wolin (an entrepreneur who has previously worked for Beliefnet, acquired by News Corp., PBS, Warner Brothers and Tribune Interactive) and Mike Keriakos (a media sales expert who began his career at Procter and Gamble and who built partnerships between Everyday Health and AOL, Google, YouTube and the ABC). The other listed company account, @Diabetes_Sanofi, belongs to the global pharmaceutical firm Sanofi, which produces diabetes treatments.
Another three of the top 10 authorities correspond to national and international diabetes associations: @AmDiabetesAssn (the American Diabetes Association) @DiabetesAssoc (the Canadian diabetes association) and @WDD (which belongs to the International Diabetes Federation). The latter account is established especially to promote World Diabetes Day (14 November), although it disseminates diabetes information and messages all year round. These associations were originally founded by physicians and they focus on advocacy and research.
The remaining three authorities in the top ten belong to not-for-profit organisations founded by people who have experienced T1. These organisations target T1 specifically: one is a funding body (@JDRF, an organisation previously known as Juvenile Diabetes Research Foundation), and the other two are blog platforms that host discussions and disseminate information (@diabetesblogs and @DiabetesSocMed).
Figure 8 shows the complement of the cumulative distribution function (CDF) (i.e. 1 − CDF) of the aggregate authority scores (blue triangles). The distribution of authorities shows that over 95% of users involved in a retweet event do not feature as an authority at all (in our weekly binning). Users who do attain a non-zero authority score fall into two categories.
Users with a sporadic or marginal appearance (i.e. they appear in only a handful of weeks and/or not in the giant components of the weekly co-citation networks). These users are concentrated in the long plateau in Figure 8.
Users who appear more regularly usually as part of the weekly giant connected components. These users constitute the top 2% in the heavy tail of high scores in Figure 8.
Figure 8.
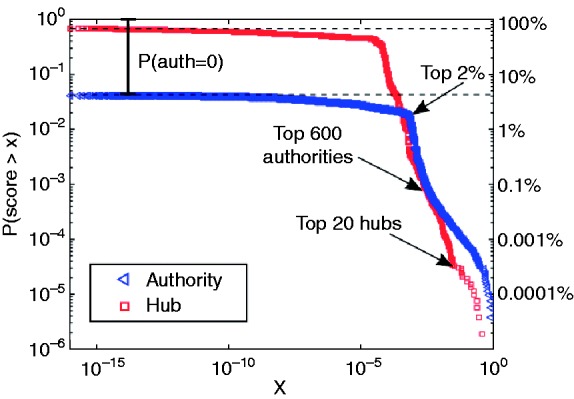
Cumulative distribution of aggregate hub (red) and authority (blue) scores on a doubly-logarithmic scale. The horizontal dotted lines show the proportion of nodes with zero aggregate hub (< 10%) and authority (≃ 95%) scores.
In the supplementary spreadsheet, we provide the top 1000 accounts by aggregate authority score as a further resource for research. As with the top 10 users discussed above, this longer list contains accounts of known commercial, public and advocacy organisations, as well as medical schools, hospitals, individual activists and bloggers. In addition, we note the appearance of academic publishers (@bmj_latest, ranked 55; @NEJM, ranked 67); comedians (@ChelcieRice, ranked 28; @SherriEShepherd, ranked 85); news and media outlets (@medical_xpress, ranked 40; @foxnewshealth, ranked 82); entertainment (@FoodPorn, ranked 197); and large health-oriented organisations (@WHO, ranked 88; @NIH, ranked 111), all of which have a focus much broader than diabetes.
These accounts disseminate content and information about diabetes on Twitter efficiently, with messages that elicit a wide, measurable response through re-tweets and replies from the general population. The sustained presence of the top authorities (i.e. the sustained strictly positive authority score in Figure 7) is an indication that these users consistently produce content that resonates with the general Twitter-using population.
Hub nodes. The top 10 accounts by aggregate hub score have a markedly different character to the authorities, both in behaviour and types of users. In the context of a retweet network, hubs are connectors; they forward information generated by authorities across Twitter. The top accounts by aggregate hub score over time (see Figure 9(a) and the supplementary spreadsheet) contain: content aggregators (i.e. accounts that gather internet content for re-use such as @1MEDICAL2NEWS or @Diabetes_Month); accounts designed to promote products such as @reTouchMD; automated accounts (e.g. so-called ‘robots’); and some individual accounts. Some of these accounts have been suspended (@shaschneider1); have become inactive (@1MEDICAL2NEWS); or have seemingly changed hands (@abdSauce) since the data was originally collected.
Figure 9.

Two different rankings of hub nodes. (a) Top 10 users ranked by their aggregate hub score, along with the number of weeks in which they appear with a non-zero hub score. (b) Top 10 users ranked by their number of weeks with a non-zero hub score. Note the change in the scale of the y-axis.
These hub nodes have a highly variable number of followers. For instance, in August 2016 @Diabetes_Month had over 20,000 followers, whereas @abdSauce had about 50. What all hubs have in common is a high rate of retweeting and a feeble, unsustained presence throughout the observation period. Figure 9(a) shows the scores over time for the top 10 hubs based on aggregate score, along with the number of weeks in which they have a non-zero score. The data shows that, in most cases, the high aggregate hub score is the result of a ‘one-off’ surge. We thus term these ‘intermittent hubs’.
The biographical information provided by these users about who they are and what they do is sparse, often vague and difficult to corroborate. For example, the account @1MEDICAL2NEWS claims to be a Dr Richard Billard from Los Angeles, but while the account had a high level of activity on Twitter in our data (and until August 2014) there is no other evidence online that this doctor exists. Given the extremely active Twitter account, it is unusual that this doctor has absolutely no other online presence. The rate at which this particular user retweeted (on average, 65 times per day), together with the lack of any original tweets (or non-retweets), further suggests that it could have been an automated account assigned an authoritative-sounding alias.
Figure 8 shows the complementary CDF of aggregate hub scores for all users (red squares). In contrast with the authority scores, most users (∼90%) have a non-zero aggregate hub score), and the split between low scoring and high scoring hubs is more even, with around 50% of the ∼1.2 million users contained in the heavy-tailed part of the distribution. There is a distinct bend at the right end of the heavy tailed regime of the distribution that contains the top 20 users by aggregate hub score, half of which have been discussed above.
To obtain a clearer picture of ‘persistent hubs’, we created an additional activity ranking of hubs by number of weeks in which the users have a non-zero hub score (Figure 9(b)). The top hub according to this persistence score is still @1MEDICAL2NEWS, which is a hub in each of the 31 weeks for which we computed the hub scores. Another noteworthy appearance is @diabetesalish, who is also a top 10 authority, and who was active as a hub in each week as well. The top 1000 (intermittent and persistent) hub accounts are included in the supplementary spreadsheet as a resource for further research.
Authorities versus hubs. Our results in Figures 7–9 show that the behaviour of the top authorities and hubs in our data is fundamentally different: top authorities tend to have a more sustained presence throughout the observation period than top hubs. We therefore investigate the combined characterisation of users in terms of joint aggregate hub and authority scores. Figure 10 shows the accounts with high hub and authority scores (i.e. in the global top 2% in both rankings). It is relevant to study users that have a prominent role as both hub and authority. These include not only the blogger @diabetesalish and the advocacy group @DiabetesSocMed, but also the following users (highlighted in black in Figure 10).
@JDRFAdvocacy: a US Government-funded organisation which focuses on building support for T1D research; the advocacy account of @JDRF; (authority rank, hub rank) = (38, 234).
@askmanny: Manny Hernandez, a prominent Venezuelan–American diabetes advocate who has had diabetes since 2002, and whose professional expertise is in social media, technology and health (authority rank, hub rank) = (12, 208).
@amidiabetic: Diabetes advocate and writer Stuart Wimbles, who runs a diabetes information website and reportedly has T1D, although there is little additional information about him online; (authority rank, hub rank) = (20, 366).
@DiabetesMine: A website/blog/newsletter run by Healthline, a consumer health information website. The company has a large team of staff and a panel of three medical advisors (a Professor of Emergency Medicine, a drug information specialist, and a pharmacist) who provide insights into user needs; (authority rank, hub rank) = (13, 208),
@KayleighAdams3: Account currently suspended; (authority rank, hub rank) = (300, 64).
@theNGdoc: Nigeria Diabetes Online Community, a non-government organisation launched in 2013 to provide empowerment, education and support for diabetics in Nigeria. An original idea by Cherise Showkley (@DiabetesSocMed), the site is officially recognised by the International Diabetes Federation, and two of its Directors are medical doctors; (authority rank, hub rank) = (127, 200).
@BattleDiabetes: Account of informationaboutdiabetes.com, a website with no details about who it belongs to, but which traces to Jill Knapp, a T2 diabetic who is an advocate for the American Diabetes Association; (authority rank, hub rank) = (49, 442).
@KellyRawlings: Diabetes advocate, T1 diabetic, journalist, and editor of Diabetes Forecast, a publication of the American Diabetes Association; (authority rank, hub rank) = (107, 387).
@diaTribeNews: Account of the diaTribe Foundation, a non-profit organisation founded by T1 diabetic Kelly Close to help people with diabetes to live better lives. Close was previously a financial sector analyst and also runs Close Concerns, a healthcare information firm focusing on diabetes and obesity; the Foundation Board contains one medical doctor; (authority rank, hub rank) = (171, 273).
@MyGlu: T1D Exchange, a non-profit organisation providing connectivity for people whose lives are affected by diabetes. The site's leadership team contains a physician and pediatric endocrinologist, but it also makes a clear disclaimer that discussions on the site should not be a substitute for medical advice; (authority rank, hub rank) = (122, 326).
@abdSauce: Top hub account, has been taken down or switched hands since data were collected; a Pinterest account with the same handle belongs to Rasheed Adewole, who works with the Nigeria Diabetes Online Community (@theNGdoc); (authority rank, hub rank) = (676, 6),
@dr_bolajidauda: Top hub account, no longer active at the time of analysis; (authority rank, hub rank) = (637, 7).
In addition to posting messages that evoke a broad response (as authorities), these users also engage by retweeting and replying to messages posted by other users (as hubs). The empty upper-right corner in Figure 10 indicates that there are no accounts at the very top as both hubs and authorities.
Figure 10.

Twitter accounts with the highest combined aggregate hub and authority score (top 2% on both rankings, on a logarithmic scale). The colour of each data point corresponds to the user's combined hub/authority score; blue denotes a lower hub or authority both (relative to the other accounts on shown here), a transition towards red denotes strength on both scores. Shown here are the usernames of 35 accounts that score highly both as hubs and as authorities; usernames in black are discussed further in the text.
Extended analysis of authorities: content and relationships
The analysis so far has established the persistence and relevance of a relatively small number of authorities in the collected retweet networks. To further our understanding of the group of authorities, we perform two further analyses. First, we analyse in detail the thematic content produced by the top 10 authorities. Second, we extract the network of followers within the top 1000 authorities and characterise the interest communities within the network of authorities.1,46
Topical analysis of authorities. We analyse into which of the topics and themes obtained through our earlier analysis of the whole dataset, the tweets from the top 10 authorities are classified. All of the top 10 authorities post messages frequently and consistently in all the themes listed under the thematic group ‘Health information’ in Table 2. Some ‘News’ related tweets are also featured, although these are less common.
Two accounts, @Diabetes_Sanofi and @diabetesblogs, do not appear to be dominated by any one of the themes listed, but contain a mixture of all the ‘Health Information’ themes. Two other accounts, @WDD and @AmDiabetesAssn participate in themes that are related to outreach and advocacy activities, events and news. The not-for-profit organisation and research funding body @JDRF produces tweets that contain life stories and experiences of diabetes sufferers more than any other top 10 authority.
Two accounts, @diabetesfacts and @EverydayHealth (owned by the same company) focus predominantly on lifestyle and diet-related tips, hints and advice. Unlike the other authorities, these do not produce outreach or advocacy messages at all. Typical messages posted by these accounts include:
@diabetesfacts: Tips on adjusting your insulin pump during exercise from diabetes educator Gary Scheiner @Integ_Diabetes – http://t.co/28Hx8c7PES
@EverydayHealth: Medical costs for people with #diabetes are more than 2x those of people without it. Are you budgeting for diabetes? http://t.co/2ohMOVJvwp
@EverydayHealth: The best beverages to quench your thirst with #diabetes http://t.co/HbR4poFfF5
The vast majority of the tweets from these two accounts provide a link back to the company's website, which offers articles containing health and lifestyle advice.
The messages posted by the accounts @diabetesalish and @DiabetesSocMed are dominated by a mix of social interactions, banter and advocacy. They participate in news topics, but to a lesser degree than the other top 10 authorities. Their tone is different to the others: it is informal and conversational rather than authoritative or informational. For example:
@DianetesSocMed: Happy Mother's (aunts, fur baby moms, god moms, etc.) to all the women in the diabetes community! Have a great day!
and
@diabetesalish: #dblog:Dear240 #bgnow: You R but fleeting & temporary, I am permanently fabulous. #Iwin #diabetes #doc #dsma http://t.co/w9iZw83f97
which links to a blog posting about the user's experience with diabetes. Two other users, @diabetesblogs and @DiabetesAssoc, also tweet some social and interpersonal messages.
Two accounts, @diabetesblogs and @diabetesalish, occasionally feature marketing or product promotion messages. Such instances of marketing are to be expected, as some bloggers generate income by advertising goods and services, and sponsoring blog advertising in this way is not regulated by governments. In this case and others, while marketing might not be made explicit to other users, it is still possible that ostensibly non-commercial accounts are also practising marketing, especially accounts owned by stockmarket-listed firms.
The topics where the highest number of top 10 authorities converge are related to advocacy and awareness. For example, a topic about Diabetes Blog Week in May 2013 gathered 6 of the top 10 authorities: @diabetesalish, @diabetesblogs, @DiabetesSocMed, @Diabetes_Sanofi, @diabetesfacts and @EverydayHealth. In other weeks, the top 10 authorities appear together in topics related to promotion of blogs by diabetics (using the hashtag #dblogs, which appears in 15,901 tweets in the data set), and diabetes social media awareness (using the hashtag #dsma, which is promoted by @DiabetesSocMed and appears in 10,945 tweets).
Analysis of the authority follower network. In order to understand how the users with high authority scores interact with each other, we have mined Twitter further to extract and analyse the follower network of the top 1000 authorities by aggregate score (see the supplementary spreadsheet). In this network, each of the top 1000 authorities is a node and a directed connection between two nodes indicates that the source node ‘follows’ the target node on Twitter.
This directed network has a large weakly connected component of 880 nodes (see Figure 11): the rest of the nodes are either isolated (a handful are connected to only one node) or have since been deleted or blocked. We work below with this network of 880 Twitter users and their follower relationships.
Figure 11.

(a) The Twitter follower network of the top authorities. The nodes correspond to the 1000 users with the highest aggregate authority score and the follower network was obtained by mining Twitter in September 2015. The users are coloured according to their interest community, as obtained through the analysis of the follower network using Markov stability. We find seven main communities (there are an additional six very small communities not shown). (b) The authority follower network coarse-grained by the obtained communities. Word clouds of the Twitter biographies of the users in each interest community were computed a posteriori to help establish the thematic content of each of the seven groups, as summarised in the description. The directed arrows reflect the direction of interest between groups, and the width of the arrows is proportional to the number of connections between the groups.
It is important to note that, unlike the retweet networks studied up to this point, the follower network is not ‘conversation-centric’. In a retweet network, the existence of a connection is the result of one user retweeting a message containing the term ‘diabetes’ at least once. In contrast, in the follower network a directed edge indicates an interest by the ‘follower’ to receive information from the ‘followed’ on a more permanent basis. This declaration of interest may reflect more general information beyond the specific retweets about diabetes.
As discussed above, the top 1000 authorities form a heterogeneous group of users, including, among others: public health institutions and foundations; diabetes advocates, researchers, activists and patients; hospitals and medical schools; academic and mainstream publishers, media and personalities; companies. The most central nodes in this follower network according to pagerank55,56 (a proxy for importance) are users with a broad reach and not diabetes-specific:
Centers for Disease Control & Prevention (CDC), @CDCgov (ranked 65 as an authority in the previous section);
National Institutes of Health, @NIH (authority rank 111);
New York Times-Health, @NYTHealth (authority rank 150);
World Health Organization, @WHO (authority rank 88);
CDC flu updates, @CDCFlu (authority rank 87);
recall information from the US Food and Drug Administration (FDA), @FDArecalls (authority rank 651);
news about medical research and health advice from the New York Times, @nytimeswell (authority rank 412);
National Public Radio-Health, @NPRHealth (authority rank 336);
US Office on Women's Health, @womenshealth (authority rank 93);
New England Journal of Medicine, @NEJM (authority rank 67).
The high centrality of accounts relating to health research and information (@NIH, @NEJM, @CDCgov, @WHO, @CDCFlu, @womenshealth), health-specific news media (@NYTHealth, @nytimeswell, @NPRHealth), health advocacy (@WHO) and commercial activities relating to foods and medicines (@FDArecalls) indicates that health in general is a key concern to users in this network. Diabetes is one health concern, but it is not isolated from others.
Beyond a ranking of centrality, it is important to extract information about relevant communities in this follower network, so as to reveal information about who the authorities are and about their interests. A community in a network is usually defined as a highly cohesive group of nodes, with above-expected connections within the group.57 In directed networks such as the follower network, we define communities in terms of flows of information, i.e. as groups of nodes in which interest or information is retained and circulated. To extract such interest communities, we use the Markov stability framework,42,43 a dynamical framework especially well-suited to extract directed communities.1,44 In this follower network, we found a robust partition into seven main interest communities (Figure 11(b)) and six additional communities with three nodes or fewer. Each of the seven larger communities contains a distinct group of users characterised by domain of activity, background, interests or employer (see supplementary spreadsheet for the full list).
C0 Health and medicine generalist accounts. This community, the largest in the network (30% of the nodes, light blue in Figure 11), contains many accounts with high pagerank (including all the top 10 by pagerank listed above). Most members are related in general to health and medicine. For example, public health bodies, hospitals, medical schools, academic publishers, the health divisions of mainstream media and commercial entities.
C1 Diabetes-related users. This community (28% of nodes, in green) contains the overwhelming majority of the diabetes-centred accounts discussed earlier, including associations, funders, advocates and patients and companies. All of the top 10 authority accounts in Figure 7 belong to this community.
C2 Lifestyle and well-being users. This community contains accounts related to lifestyle and wellbeing advice, publications, natural and alternative remedies, detox, health and organic foods and products (17% of the nodes, in red).
C3 Science writers and media. This community contains science writers (e.g. @bengoldacre) and popular scientific publications, British media, and biotech-industry related accounts (11% of the nodes, in orange).
C4 Celebrity and wider public. This community contains celebrities, men's publications, and celebrity doctor @DrOz (5% of nodes, in dark blue).
C5 Tesco-related. In this community, most accounts are either owned by the UK retailer Tesco or by its employees (3% of the nodes, in yellow).
C6 Humour. This community contains comedians, parody, novelty accounts and others (2% of the nodes, in purple).
Through this succinct analysis of the follower network of authorities we obtain a clearer global picture of: the general participants in the diabetes-specific discussions analysed earlier; the groups of interests that are present; the audiences involved in the debate; and how they relate to each other. For instance, as Figure 11(b) shows, the largest community (C0), which contains generalist health and medicine agencies, is clearly seen as a reference by all other communities, and especially by the three other large communities: C1 (Diabetes), C2 (Lifestyle) and C3 (Science writers and media). There are other clear asymmetries in the follower-followed relationships: C2 accounts strongly follow C1 accounts (but this following is not reciprocated to the same extent), whereas C2 users do not strongly follow C3 accounts (which largely ignore C2). The connection between C1 and C3 is not strong in either direction. The presence of the UK retailer Tesco as a distinct community (C5) in this network is also noteworthy; Tesco is a high-profile supporter of the charity Diabetes UK (@DiabetesUK, in C1; https://www.diabetes.org.uk/tesco/ accessed on 8 October 2015). As we have noted previously, humour is a prominent feature in our datasets, and it makes another significant appearance here. Community C6 accounts, which contain many comedy and parody accounts, have also been observed in other follower networks obtained from different topical issues.1 To provide a visual interpretation of the communities found, Figure 11(b) also contains word-clouds constructed from the Twitter biographies of the members in each community. The word-clouds are aligned with our descriptions of the interest communities. In particular, the members of communities C0, C1, C2, C3 and C5 use consistently-themed language to describe themselves. In contrast, the members of the celebrity and humour communities (C4 and C6) are heterogeneous in their self-descriptions, yet clearly identifiable through examination of their usernames. As noted by Beguerisse-Díaz et al.,1 the word-clouds obtained from the biographies can be thought of as an independent annotation or ‘self-description’ of the communities. It is important to remark that the biographies were not used in the analysis of the network.
Discussion
Twitter is a source of information and interaction for a growing section of the world's population.58 Hence, understanding online conversations around health issues on Twitter (and social media platforms more broadly) is important, especially since such platforms are frequently considered as possible tools in public health outreach and health promotion initiatives.20,21,59–61 Such initiatives are designed based on extended assumptions about the Twitter health landscape, the messages which dominate it and the interactions of users within it. However, detailed data-driven research can help ascertain the validity of such assumptions and enrich our understanding of the online landscape and its implications for population health.
In our study, references to diabetes on Twitter fall into four broad thematic groups: health information, news, social exchanges and commercial messages (Table 2). While these groups define a body of consistent themes, specific messages are largely irregular and variable over time, both in their language and content.
In contrast, there exists an additional group of highly consistent messages that are propagated through popular culture and humour, including jokes, song lyrics or viral ‘facts’. Such messages are consistent in content and style over time as they continue to be posted and shared. Humorous tweets, banter, jokes and social engagement (both supportive and stigmatising) are common in our data. Tweets with such content have a different tone and vocabulary than tweets containing authoritative posts, formal health messages or news headlines. This observation is in line with previous reports, which have found that the most retweeted tweets are emotionally evocative (either humorous or evoking anger).46,62,63 Moreover, we also find that these tweets appear on Twitter more persistently over time than other tweets in the sample (Figure 1). From a health promotion perspective, this highlights a need to consider not only the consistency of slogans or lines in the messages, but also their style and sentiment. The importance of sentiment in promoting dietary choices has also been discussed in the literature.64–66
The abundance of jokes and sexual innuendo about foods and substances that contribute to diabetes indicates at least a basic understanding of diabetes, some of its causes and its connection to blood sugar. The embedding of such fundamental understandings about diabetes in online social media may be the result of health efforts in nutrition over the past decades. This observation is at odds with assumptions that more health education is required to help people to understand the sorts of foods which might contribute to the development of diabetes. Furthermore, such use of humour may imply a sense of powerlessness to make ‘healthy’ choices as users seemingly mock health advice when faced with realities of the food and drink products they encounter on a daily basis.67
When it comes to the ‘who’ of diabetes on Twitter, our analysis shows a clear separation between the relatively few accounts that produce the most engaging content (authorities), and the broader audiences that disseminate and respond to it (hubs), as seen in Figure 10. Only about 10% of the accounts in our dataset (approximately 120,000) produce tweets that evoke some (heterogeneous) response (Figure 8). Among the top authority accounts, we find a mix of stockmarket-listed firms; public, civil and grassroots organisations; and individuals who have experience as diabetes patients and care-givers. The engagement levels of all authorities are sustained throughout the observation period, and it is difficult to clearly discern between these different groups based on the content, style or theme of their tweets alone. These observations reflect the fact that the health landscape today no longer consists of government and citizens alone.65 Other entities (such as commercial agents, individual bloggers and automated accounts) also exist and exert influence on the health promotion landscape, and on the conversations taking place around such themes. Their motives are sometimes challenging to discern, and sponsorship arrangements can be difficult to identify or regulate. Similar findings have been noted with respect to Facebook, another social media platform used for health care and communication.31 Such entities, which are assumed by health authorities to be extrinsic to the healthcare arena, need to be acknowledged and considered in successful strategies for health promotion.
Our results show that the role of hubs in disseminating information is less persistent over time than the role played by authorities in generating information. Hubs are generally far less transparent about their identity. Some accounts, for example, claim to have medical expertise, but these claims cannot always be verified. As a result, it is difficult for Twitter users to be ‘informed citizens’ and discern legitimate from misleading or discredited information, or a bona-fide health expert from a social-media expert, or a marketer with business motivations from a marketer with public health ones. Establishing the credibility of an account by the number of messages, followers or even through the published user profile, for example, can therefore be misleading. This poses challenges to the use of Twitter as a health promotion platform, and requires the use of sophisticated techniques (e.g. collaboration of health professionals with practitioners of network and data science). Further research and engagement with ‘real’ people, and not simply their virtual online personae which represent them, is necessary to elucidate the expertise and intentions of users generating some of the key diabetes-related content on Twitter.
This research has implications for health policy makers and health promotion practitioners. We show that key authorities in relation to diabetes on Twitter are not simply those with accredited and formally recognised health expertise, but also bloggers (men and women), patients, celebrities, advocacy organisations, stockmarket-listed firms, news media and automated accounts. There are diverse stakeholders that use Twitter; even when limited to the English language, these accounts originate from a range of countries (notably, several Nigerian accounts have prominent roles as both hubs and authorities). It may be that establishing long-term collaborations with the most influential users, as well as enhancing the connections between different communities of users, may be more effective health promotion strategies than running short-term government-led campaigns and slogans aimed at informing people who have (or who are at risk of developing) diabetes. In addition, it is important that policy makers understand what social media users already know about health before new initiatives are introduced: simply telling users what they already appear to know, for example, about which foods contribute to diabetes, may hinder health agencies' impact and credibility.
Our findings also have implications for programme evaluation, where ‘number of tweets/followers’ is commonly assumed to equate to ‘impact’. Other metrics that leverage the structure of the network of interactions to consider relative impact, or a sustained high-centrality presence over time (e.g. via centrality metrics such as hub-authority scores) may more closely reflect the reality of Twitter use for health purposes.
The health information landscape on Twitter is complex, and it cannot be assumed that people can easily discern ‘good’ and ‘bad’ information. Our observations echo previous reports that there is more information available to consumers than they have the capacity to process and understand.68,69 In this context, public health approaches and messages that simply aim to ‘inform’ the public might be insufficient in themselves, or even be counterproductive as they make a complicated cacophony of messages even busier. This is particularly relevant for health policy makers. For instance, information that is disseminated by bloggers, stockmarket-listed firms or automated accounts may be in line with broad health recommendations (and indeed may provide a valuable service to users), but without clear distinction from ‘legitimate’ health advice, such information might equally push particular aspects of a commercial agenda that could lead to harm or greater health costs in future. In this case, public health agencies may have to develop novel approaches to ensure that the electronic health information landscape is one that promotes healthy citizens and not only sweet profits.
Data statement
The Supplementary Spreadsheet that accompanies this article, with the lists of the top users and topic keywords is available from the publisher's website. The IDs of the tweets used in this research and the supplementary spreadsheet can be downloaded from the ReShare UK Data Service repository.70
Supplementary Material
Acknowledgements
We thank E. Garduño for useful advice and discussions on how best to gather and process the data. We thank H. Harrington and S. Yaliraki for fruitful discussions and comments on the manuscript.
Appendix
Table 3.
Specific examples of health information tweets.
| Public health messages | Experts recommend universal diabetes testing for pregnant women at first prenatal visit http://t.co/6nLAUytBCX |
| FDA warns of massive diabetes test strip recall Nova Max strips http://t.co/dxtv4YLMIR via @nbcnewshealth | |
| Links to articles, blogs and studies about risks, treatment and cure | One Overlooked Trace Mineral Could Wipe Out Diabetes: http://t.co/lD1GgBy6ry |
| : Insulin Pumps vs. Insulin Injections for Type 1 Children http://t.co/d2Np519zAN #diabetes | |
| Effect of imidapril versus ramipril on urinary albumin excretion in hypertensive patients with type 2 diabetes… http://t.co/wLZfIsiElp | |
| Reverse Your Diabetes Today: Learn a little-known but 100% proven way to erase your pre-diabetes and type 2 diabetes. http://t.co/TUDwKT3R8F | |
| Studies show chlorella could improve insulin sensitivity in type 2 diabetes patients http://t.co/J4GxrbLF32 via @HealthRanger | |
| Flu shot extra important if you have diabetes http://t.co/59Qx57TiI4 | |
| Population health and fears | Health chief fears diabetes to soar across Bradford district (From Bradford Telegraph and Argus) http://t.co/g5A1yZTbsJ |
| Fears Rockhampton facing diabetes epidemic: Diabetes Queensland says more than 10 per cent of the population i… http://t.co/bQhnR4x4Rk | |
| Obesity and diabetes pose a serious threat to the long-term health of young people in the United States. http://t.co/biz4U2gWup | |
| Diabetes is a disease that can strike when you don't take care of your body. Check out these eye-opening statistics. http://t.co/zwpfTPgbtu | |
| Publicity about outreach and awareness events and activities | Many @Enterasys employees riding in @AmDiabetesAssn Tour de Cure are too familiar w/ diabetes. Here's why they ride http://t.co/qURu4XP2xy |
| Donate to @Brenda_Novak's auction for the cure for diabetes. I'm giving away 2 tix to my blog tour course #win – http://t.co/sR65gINrx6 | |
| Join us as we fight to #StopDiabetes. Sign our petition to urge Congress to invest in #diabetes prevention & a cure: http://t.co/6ztkHxnNy1 | |
| Support World Diabetes Day 2012, add a #twibbon to your avatar now! – http://t.co/7mLvcvY1Hx | |
| Merck Animal Health Launches Global Awareness Campaign to Support Pet Diabetes Month™ http://t.co/BDr77CoCg5 | |
| Advice about diabetes management and diagnosis | Open Question: Diabetes question i want to know if i have diabeties? i was in eye hospital today and they have… http://t.co/2BNfwNZL2f |
| Open Question: Whart are some good ways to deal with pre-diabetes? 9I have some too but are open to yous)? http://t.co/y6wT3BXSaX | |
| 5 things #caregivers need to know about #diabetes. http://t.co/oncoPhK0QH via @sallyabrahms | |
| Open Question: I think I may have diabetes? http://t.co/UGnLZaZ3Gf | |
| Lifestyle, diet and cookery tips, news and links | 8 Tips for Eating Out With Diabetes – Type 2 Diabetes Center-Everyday Health http://t.co/u5nIZ4cg5E #diabetes #health #diettips |
| Control Your Diabetes: Diet Tips Check out this post Control Your Diabetes: Diet Tips!.. http://t.co/nES3pfIwg | |
| Purina veterinary diets dm http://t.co/cJ7bVFrbz8 #diabetes management feline formula | |
| Zucchini Escarole Soup: From Diabetes Cooking for Everyone, by Carol Gelles. Exchanges: 1/4 bread, 1 vegetable,… http://t.co/IiH1Da9d4u | |
| Micronutrient Enriched Wheat Steamed Bread is Beneficial for Diabetes Patients http://t.co/SHthuJliHh #health #cancer | |
| Tips For Living A Life With Diabetes: TIP! Almonds are a great way to get some additional protein into your di… http://t.co/XPkJm6jAJ0 | |
| To manage your diabetes, Weird Science recommends the munchies http://t.co/QybNo8qfTd | |
| Life stories and experiences (some for marketing purposes) | Tiny cells lift Type 1 diabetes hope: Michael Schofield gets to meet the mother of the man whose death gave hi… http://t.co/ODMOzctOWI |
| Debby M Shared this yesterday and its outstanding!!! April 23rd 2013, I was diagnosed with diabetes type 2. My… http://t.co/iv4blIR5Nj | |
| The Day I was Diagnosed with Juvenile Diabetes: I was diagnosed on July 21st 1999 when I was eight years old. … http://t.co/U1GPaX812b | |
| #50ThingsAboutMe 38) I have diabetes since I was 9 years old | |
| Dangers of sugar, sugar replacements and/or soda | Drinking one can of soda a day increases your chances of getting type 2 diabetes by 22%! Details – http://t.co/BzOmFKhhbw |
| Diabetes warning over soft sugary drinks: Dr Tim Dalton, chair of the Wigan Borough Clinical Commissioning Gro… http://t.co/uaLWTZaHDI | |
| A soda a day keeps the doctor in pay: soft drinks and diabetes: Recent research linking soft drinks to type 2 … http://t.co/QhB31VRES2 | |
| If Mountain Dew: Baja Blast was sold in the stores, diabetes would spread like wildfire, y'all. | |
| Thanks for putting a damper on my #1 pregnancy craving. Coke and Pepsi Face Diabetes Backlash http://t.co/MI8it8xphD via @adweek | |
| Fighting flab? Think before u reach out 4 sugar substitute #Sugar #Sucralose #Diabetes http://t.co/cfeYURK7r3 |
Table 4.
Examples of news tweets.
| Headline links to particular ‘breakthrough’ studies or technologies | Immune protein could stop diabetes in its tracks, discovery suggests: Researchers have identified an immune pr… http://t.co/rd8Jx2avnn |
| $FPMI – Advanced Imaging Studies May Enhance Diabetes Management http://t.co/Ow3QX0yuYm | |
| Fish Oil Pills Might Cut Diabetes Risk, Researchers Say http://t.co/fvsIMXFKGR | |
| Great article from @jdwilson2 on islet cell transplant testing offering hope for T1 #diabetes http://t.co/qn9XYwIxC5 @cnnhealth | |
| Celebrity news | Another reason to dislike the Pats | NFL Patriots release Kyle Love after diabetes diagnosis: http://t.co/lAV114TP06 via @wtcommunities |
| Sherri Shepherd Talks About Her Fight With Diabetes! [Video]: video platformvideo managementvideo solutionsvid… http://t.co/6FiJMcUal3 | |
| Wow Trump just gave Lil John $100K toward his diabetes charity & his mom just passed away they all cheered endlessly. #apprenticefinale | |
| General news articles about diabetic people or pets | Thief steals family car with daughters #diabetes medicine inside http://youtu.be/juPZtMmzL2s via @youtube @tmz http://t.co/agDquGWmUL |
| Diabetes service dog saves the day and night for Fort Worth teen http://t.co/LQ4NRm9PLm | |
| Cop beats up girl for diabetes, exposes racist government schools: http://t.co/5AYnBxPEsI via @youtube | |
| Why Jasper TX Service Trains Quality Service Dogs For Those With Diabetes And Autism http://t.co/xFzI5hdRCP | |
| News relating to the pharmaceutical industry and the economy | Glooko's New Diabetes Management System FDA Cleared: Glooko (Palo Alto, CA) received FDA clearance for its lat… http://t.co/j1KffOmigz |
| $CXM Plays Two Vital Roles in the Fight Against Diabetes http://t.co/f0zVaXMsv9 | #diabetes #stocks http://t.co/QK5Zw5tGQt | |
| Woman with Type 2 diabetes sees premiums plummet from $500 to $1 under Obamacare | http://t.co/CUurbdnwqR | |
| News: Cytori Licenses AsiaPacific Cardiovascular Renal & Diabetes Markets to Lorem Vascular for up to $531 Million http://t.co/6SNySsC7qX | |
| AstraZeneca could buy Bristol stake in diabetes JV: analyst: LONDON (Reuters) – AstraZeneca may seek to increa… http://t.co/rcZQPIIZxo | |
| Salix to Buy Santarus for $2.6 Billion to Gain (type 2) #Diabetes Drug http://t.co/wpjNIxKGLf# |
Table 5.
Social interaction and humorous tweets.
| Users joking about how what they have eaten is likely to give them diabetes | cake cake cake cake cake cake cake cake cake cake cake cake cake cake cake cake cake cake cake cake cake cake cake cake cake cake diabetes |
| 2 bowls of yogurt, a bowl of oreos, hersheys, chips, cheese and a shitload of mints. My diet consists of diabetes. | |
| Bother! Burger King has arrived. Hello obesity, diabetes, poor nutrition. McD's is bad enough. Grumble Grumble ???? | |
| To us: candy,chocolate,nasi lemak,fries To parents: diabetes,tooth decay,heart disease,high blood pressure. | |
| Chatter and social interchanges | I JUST TOLD MY DAD A BAD DIABETES JOKE AND HE'S A DIABETIC OMFG IM SUCH A BAD PERSON |
| My mom said I probably have diabetes.. aaa I didn't know she went to school to be a doctor lol | |
| Everyday experiences of diabetes | Screw this diabetes business today. Just wanna sleep.. #HeadAche #FeelHungover |
| My #husband going in for #surgery this morning for #amputation of his toe and partial foot due to #diabetes #diabetesawareness #fckudiabetes | |
| Watching belly dancers on youtube & wishing I never stopped going-No time & damn diabetes took over my life. #killjoy #fcbd #hipsofglory | |
| Breakfast gone wild? Pump set gone wild? Hellooo Monday. WTF diabetes. http://t.co/uK3xTuJuMD | |
| Me and diabetes aren't getting along today. #ifeellikepoop #badmood #diabeticproblems ???? http://t.co/3OwXSe2keO | |
| Ever have a cat chew on your insulin pump tubing? #diabetes #tubing #insulinpump | |
| Is it too much to ask that media clearly differentiate between type 1 and type 2 diabetes? Lap band surgery will not cure T1 diabetes #fedup | |
| Stigmatising comments | “I'm working on something” “The only thing you're working on is diabetes you fat fuck” #Projectx is jokes :L |
| Why do you think your beautiful you look like a fucking frog with diabetesOMFG ahahahahahahahah | |
| To the cunt in work that smeared shit on the floor in the toilets. I hope you get type 2 diabetes and aids. | |
| I hope y'all fucking future kids get fat and get diabetes talking shit bout Ms Dumas | |
| I seriously miss my doctor in touness, this one told me today that he thinks diabetes is gonna be the cause of my death. How rude): | |
| ‘A nation of porkers’: Diabetes expert complains on national radio that we're eating ourselves into an early grave | |
| Excuse me sir..Just leave the gym with ur diabetes-lookin, wheezin self.. Puffing ur chest doesnt hide ur huge beer belly ??? #idontplayatgym | |
| Sexual innuendo and humour relating to sweetness and diabetes | ‘Niall's so sweet, i'd bet you'd get diabetes by swallowing his cum’ OMFG HAHAAHAHAAH I LOVE THIS |
| HARRY YOU LJTTLE CUTIE PATOOTIE I THINK I JUST RECIEVED DIABETES FROM LOOKIGN AT THIS SUGAR PIE HOINEY BUCNH http://t.co/nJZqYUfOMW | |
| I'd lick your sweet pussy till I get diabetes. | |
| Do me baby. Uh oh, did you say DEW ME?! *Mountain Dew gushes from his penis and gives her sexually transmitted diabetes* | |
| woah woah stop giving girls diabetes Ahh EYE CANDYMAN – EH I don't even know what's going on now! What eye candy… | |
| #ABCReports The Blacker The Berry,The Sweeter the Juice Is Wesley Snipes own sweat giving him Diabetes???More @ 10pmlol | |
| Jokes, sarcasm and humorous tweets | Just saw a commercial for diabetes medicine. Side effects: Low Blood Sugar. Let that sink in. |
| I didn't even know what the gd pancreas did until Violet was diagnosed with Type 1 Diabetes. Fuck you, you shitty non-working pancreas. | |
| A marwadi opens a Sweets Shop … Puts an Advertisement : Helper Needed … Qualification : Should have Diabetes | |
| Pray for the rain forest. Pray for that gay NBA player. Pray for the o-zone layer. Pray for stray animals. Pray for diabetes | |
| The coca cola Christmas advert, because nothing says Christmas quite like diabetes and capitalism. LOL |
Table 6.
Commercial tweets.
| Advertisements for jobs in the pharmaceutical and care industries | Sioux City Jobs: Sioux City, IA Diabetes Sales Specialist at Inventiv Health (Sioux City, IA) http://t.co/9vDO6xjUKS #Jobs #SiouxCityJobs |
| #jobs4u #jobs #ABQ Pharmaceutical Representative – Diabetes Products – Albuquerque, NM http://t.co/ghNCYrMbHo #albuquerque #NM | |
| #jobs,#ukjobs Clinical Nurse Specialist Diabetes http://t.co/QtnCwYK6WR #jobs4u | |
| Start a new #career at American Diabetes Association in Rocky Hill, CT. Associate Director – Fundr… http://t.co/Wi3tM70wMd | |
| Marketing for a specific product, app, treatment, event or service | Caffeine stimulates elevated of Cortisol = arthritis, obesity, diabetes, and depression. Try healthy coffee: – http://t.co/4paSPZ0mrc |
| Acid Reflux, Arthritis, Diabetes, Enlarged Prostate, Overweight! http://t.co/aCXiugNQsh | |
| FREE Kindle eBook: Apple Cider Vinegar Natural Cures for Diabetes, Cancer, and MORE!… http://t.co/gGNGXwVfqx | |
| Buy diabetes drugs, diets or treatment products online | http://t.co/wJ6z0hd1BO Buy Diabetes online if Cheap Diabetes no prescription, Order Diabetes without prescription |
| aggressive diabetes actos http://t.co/biK2GYcOQI #buy #cheap #pills #online #pharmacy #drugs #generic | |
| #aldactone: Co-trimoxazole: Buy Generic Bactrim – Aldactone for diabetes at http://t.co/0qM9gUUa69 | |
| No Script Slimex For Cheap No Prescriptions Needed For Slimex Cause Diabetes http://t.co/6uhu2RmMZh | |
| American-Diabetes-Wholesale : $12 Off Order of $100 or More! Code: ADW12100 http://t.co/e5K20ptIhH |
Table 7.
Recurrent tweets.
| Lyrics of ‘All the time’, by Jeremih47 | If its sweet then ima eat it, til I get sugar diabetes. Ima blood n she anemic. We perfect. |
| And If It's Sweet Then Ima Eat It Till I Get Sugar Diabetes Ima Blood And She A Nemick!!!! | |
| And if it''s sweet then imma smoke it till I get sugar diabetes – wayne | |
| Pusssssy for breakfast. Yo' pussy betta. Ima eat till i get sugar diabetes. #AllTheTime #Jermiah | |
| Lyrics of ‘Mind of a maniac’, by Boosie Badazz48 | Use to hold my head down.. not no more diabetes n my body police kickin in my door.. but I'm still happyyyy… #boosie |
| USED TO HOLD MY HEAD DOWN NOT NOMO DIABETES IN MY BODY POLICE KICKING IN MY DOE!!!BUT IM STILL HAPPY!!!!!! | |
| diabetes in my body police kickin in my door, but im still happy. | |
| Alcohol reduces diabetes risk | “One Alcoholic drink a day can reduce your risk of type 2 diabetes by up to 30 percent.” See I'm not an alcy I'm keepin helthy |
| “One Alcoholic drink a day can reduce your risk of type 2 diabetes by up to 30 percent.” Let's drink more | |
| “One Alcoholic drink a day can reduce your risk of type 2 diabetes by up to 30 percent.” #tequila | |
| Viral fact about detecting diabetes by tasting urine | “Doctors used to taste urine to determine if someone had diabetes because their urine would taste sweet.” HAHAHAHA |
| “Doctors used to taste urine to determine if someone had diabetes because their urine would taste sweet.” #nasty | |
| Ammm ewwww “Doctors used to taste urine to determine if someone had diabetes” | |
| The mathematics joke | Elementary math problems are weird. ‘I had 10 chocolate bars and ate 9. What do I have now?’ Oh, I don't know, DIABETES MAYBE. :| |
| Louis has 40 chocolate bars. He eats 35. What does Louis have now? Diabetes. Louis has diabetes. | |
| Here's a question. Juan has 40 choco bars. He eats 35. What does Juan hve now? Diabetes. Juan has diabetes. *Mathematics + Logic = Sarcasm |
Contributorship
MBD and AM researched literature and conceived the study, carried out quantitative (MBD) and qualitative (AM) data analysis, and prepared the first draft of the manuscript. GGH and MBD collected the data. MBD, AM, MB and SU wrote the paper. All authors reviewed and edited the manuscript and approved the final version of the manuscript.
Declaration of Conflicting Interests
The author(s) declared no potential conflicts of interest with respect to the research, authorship, and/or publication of this article.
Ethical approval
Not applicable.
Funding
The author(s) disclosed receipt of the following financial support for the research, authorship, and/or publication of this article: MBD acknowledges support from the James S. McDonnell Foundation Postdoctoral Program in Complexity Science/Complex Systems Fellowship Award (#220020349-CS/PD Fellow). MB acknowledges funding from the EPSRC (grant numbers EP/I017267/1 and EP/N014529/1).
Guarantor
MBD/AM.
Peer review
This manuscript was reviewed by Tim Robbins, University of Warwick and Dhiraj Murthy, Goldsmiths, University of London.
Supplemental material
The online supplementary materials are available at http://journals.sagepub.com/doi/suppl/10.1177/2055207616688841.
References
- 1.Beguerisse-Díaz M, Garduño-Hernández G, Vangelov B, et al. Interest communities and flow roles in directed networks: the Twitter network of the UK riots. J Royal Soc Interface 2014; 11: 101. [DOI] [PMC free article] [PubMed] [Google Scholar]
- 2.Denef S, Bayerl PS and Kaptein N. Social media and the police – Tweeting practices of British police forces during the August 2011 riots. In: Proceedings of the Computer–Human Interaction Conference. New York: ACM Press, 2013.
- 3.González-Bailón S, Borge-Holthoefer J, Rivero A, Moreno Y. The dynamics of protest recruitment through an online network. Sci Rep 2011; 1: 197. [DOI] [PMC free article] [PubMed] [Google Scholar]
- 4.González-Bailón S, Wang N. Networked discontent: The anatomy of protest campaigns in social media. Social Networks 2016; 44: 95–104. [Google Scholar]
- 5.Morales AJ, Losada JC, Benito RM. Users structure and behavior on an online social network during a political protest. Physica A 2012; 391: 5244–5253. [Google Scholar]
- 6.Tonkin E, Pfeiffer HD, Tourte G. Twitter, information sharing and the London riots? Bull Amer Soc Informat Sci Technol 2012; 38(2): 49–57. [Google Scholar]
- 7.Zhou Z, Bandari R, Kong J, et al. Information resonance on Twitter: watching Iran. In: Proceedings of the First Workshop on Social Media Analytics (SOMA ’10). New York: ACM Press, 2010, pp. 123–131.
- 8.Kwak H, Lee C, Park H and Moon S. What is Twitter, a social network or a news media? In: Proceedings of the 19th International Conference on World Wide Web (WWW ’10). New York: ACM Press, 2010, pp. 591–600.
- 9.Wu S, Hofman JM, Mason WA and Watts DJ. Who says what to whom on twitter. In: Proceedings of the 20th international conference on World wide web (WWW ’11). New York: ACM Press, 2011, pp. 705–714.
- 10.Culotta A. Towards detecting influenza epidemics by analyzing Twitter messages. In: Proceedings of the First Workshop on Social Media Analytics (SOMA ’10). New York: ACM Press, 2010, pp. 115–122.
- 11.Signorini A, Segre AM, Polgreen PM. The use of Twitter to track levels of disease activity and public concern in the U.S. during the influenza A H1N1 pandemic. PLoS ONE 2011; 6(5): e19467. [DOI] [PMC free article] [PubMed] [Google Scholar]
- 12.García-Herranz M, Moro E, Cebrián M, et al. Using friends as sensors to detect global-scale contagious outbreaks. PLoS ONE 2014; 9(4): e92413. [DOI] [PMC free article] [PubMed] [Google Scholar]
- 13.Prier KW, Smith MS, Giraud-Carrier C and Hanson CL. Identifying health-related topics on Twitter: an exploration of tobacco-related tweets as a test topic. In: Proceedings of the 4th International Conference on Social Computing, Behavioral–Cultural Modeling and Prediction (SBP’11). Berlin: Springer-Verlag, 2011, pp. 18–25.
- 14.Paul M and Dredze M. You are what you tweet: analyzing Twitter for public health; 2011. Available from: https://www.aaai.org/ocs/index.php/ICWSM/ICWSM11/paper/view/2880.
- 15.Llorente A, Garcia-Herranz M, Cebrian M, Moro E. Social media fingerprints of unemployment. PLoS ONE 2015; 10(5): e0128692. [DOI] [PMC free article] [PubMed] [Google Scholar]
- 16.Scanfeld D, Scanfeld V, Larson EL. Dissemination of health information through social networks: Twitter and antibiotics. Amer J Infect Control 2010; 38: 182–188. [DOI] [PMC free article] [PubMed] [Google Scholar]
- 17.Hawn C. Take two aspirin and tweet me in the morning: how Twitter, Facebook, and other social media are reshaping health care. Health Affairs 2009; 28: 361–368. [DOI] [PubMed] [Google Scholar]
- 18.Heaivilin N, Gerbert B, Page JE, Gibbs JL. Public Health Surveillance of Dental Pain via Twitter. J Dental Res 2011; 90: 1047–1051. [DOI] [PMC free article] [PubMed] [Google Scholar]
- 19.King D, Ramirez-Cano D, Greaves F, et al. Twitter and the health reforms in the English National Health Service. Health Policy 2013; 110: 291–297. [DOI] [PubMed] [Google Scholar]
- 20.Public Health England. Social marketing strategy 2014 to 2017: one year on; 2015. Available from: https://www.gov.uk/government/publications/public-health-england-marketing-strategy-2014-to-2017.
- 21.Public Health England. Marketing strategy: 2014 to 2017; 2015. Available from: https://www.gov.uk/government/publications/public-health-england-marketing-strategy-2014-to-2017.
- 22.Lupton D. M-health and health promotion: The digital cyborg and surveillance society. Social Theory Health 2012; 10: 229–244. [Google Scholar]
- 23.World Health Organization. Fact sheet No. 312: Diabetes. Geneva: WHO Media Centre, 2015.
- 24.Centers for Disease Control and Prevention and others. National diabetes statistics report: estimates of diabetes and its burden in the United States, 2014. US Department of Health and Human Services, 2014. Available from: http://www.cdc.gov/diabetes/data/statistics/2014statisticsreport.html.
- 25.Shaw R, Johnson C. Health Information Seeking and Social Media Use on the Internet among People with Diabetes. Online Journal of Public Health Informatics 2011; 3(1): Available from: http://journals.uic.edu/ojs/index.php/ojphi/article/view/3561. [DOI] [PMC free article] [PubMed] [Google Scholar]
- 26.El-Gayar O, Timsina P, Nawar N, Eid W. Mobile applications for diabetes self-management: status and potential. J Diabetes Sci Technol 2013; 7: 247–262. [DOI] [PMC free article] [PubMed] [Google Scholar]
- 27.Kaufman N. Internet and information technology use in treatment of diabetes. Int J Clin Practice 2010; 64: 41–46. [DOI] [PubMed] [Google Scholar]
- 28.Gough A, McCance D, Alderdice F, et al. Preconception counselling resource for women with diabetes. BMJ Qual Improv Rep 2015; 4: 1. [DOI] [PMC free article] [PubMed] [Google Scholar]
- 29.Harris JK, Mueller NL, Snider D, Haire-Joshu D. Local health department use of Twitter to disseminate diabetes information, United States. Prev Chronic Dis 2013; 10: E70. [DOI] [PMC free article] [PubMed] [Google Scholar]
- 30.Desai T, Shariff A, Shariff A, et al. Tweeting the meeting: an in-depth analysis of Twitter activity at Kidney Week 2011. PLoS One 2012; 7(7): e40253. [DOI] [PMC free article] [PubMed] [Google Scholar]
- 31.Greene JA, Choudhry NK, Kilabuk E, Shrank WH. Online social networking by patients with diabetes: a qualitative evaluation of communication with Facebook. J Gen Intern Med 2011; 26: 287–292. [DOI] [PMC free article] [PubMed] [Google Scholar]
- 32.Kleinberg JM. Authoritative sources in a hyperlinked environment. J ACM 1999; 46: 604–632. [Google Scholar]
- 33.Newman M. Networks: An Introduction, Oxford: Oxford University Press, 2010. [Google Scholar]
- 34.Lancichinetti A, Sirer MI, Wang JX, et al. High-reproducibility and high-accuracy method for automated topic classification. Phys Rev X 2015; 5: 011007. [Google Scholar]
- 35.Manning CD, Raghavan P, Schütze H, et al. Introduction to Information Retrieval 2008; Vol. 1: Cambridge: Cambridge University Press. [Google Scholar]
- 36.Wilson SM, Peterson LC. The anthropology of online communities. Annu Rev Anthropol 2002; 31: 449–467. [Google Scholar]
- 37.Bowen GA. Naturalistic inquiry and the saturation concept: a research note. Qualitat Res 2008; 8: 137–152. [Google Scholar]
- 38.Braun V, Clarke V. Using thematic analysis in psychology. Qualitat Res Psychol 2006; 3(2): 77–101. [Google Scholar]
- 39.Zimmer M, Proferes NJ. A topology of Twitter research: disciplines, methods, and ethics. Aslib J Inform Management 2014; 66: 250–261. [Google Scholar]
- 40.Ding CHQ, Zha H, He X, et al. Link analysis: hubs and authorities on the World Wide Web. SIAM Rev 2004; 46: 256–268. [Google Scholar]
- 41.Porter MF. Snowball: A language for stemming algorithms, 2009. Available from: http://snowball.tartarus.org/texts/introduction.html.
- 42.Delvenne JC, Yaliraki SN, Barahona M. Stability of graph communities across time scales. Proc Nat Acad Sci USA 2010; 107: 12755–12760. [DOI] [PMC free article] [PubMed] [Google Scholar]
- 43.Delvenne JC, Schaub MT, Yaliraki SN, Barahona M. The stability of a graph partition: a dynamics-based framework for community detection. In: Mukherjee A, Choudhury M, Peruani F, Ganguly N, Mitra B. (eds). Dynamics On and Of Complex Networks 2013; Vol. 2: New York: Springer, pp. 221–242. [Google Scholar]
- 44.Lambiotte R, Delvenne J, Barahona M. Random walks, Markov processes and the multiscale modular organization of complex networks. IEEE Trans Network Sci Eng 2014; 1(2): 76–90. [Google Scholar]
- 45.Blei DM, Ng AY, Jordan MI. Latent Dirichlet allocation. J Mach Learn Res 2003; 3: 993–1022. [Google Scholar]
- 46.Amor B, Vuik S, Callahan R, et al. Community detection and role identification in directed networks: understanding the Twitter network of the care-data debate. In: Adams N and Heard N (eds) Dynamic Networks and Cyber-Security, Vol. 1, p. 111. World Scientific.
- 47.Jeremih WL and Mosley N. All The Time, 2013. Def Jam Records. Digital Download.
- 48.Boosie L. I'm Still Happy, 2010. Gone Til December.
- 49.Gleeson JP, O'Sullivan KP, Baños RA and Moreno Y. Effects of network structure, competition and memory time on social spreading phenomena. Physical Review X 6 2016: 021019.
- 50.Simonsen M, Skipper L, Skipper N. Price sensitivity of demand for prescription drugs: exploiting a regression kink design. J Appl Econometrics 2015. DOI: 10.1002/jae.2436. [Google Scholar]
- 51.Wild S, Roglic G, Green A, et al. Global prevalence of diabetes: estimates for the year 2000 and projections for 2030. Diabetes Care 2004; 27: 1047–1053. [DOI] [PubMed] [Google Scholar]
- 52.Polonsky KS. The past 200 years in diabetes. N Engl J Med 2012; 367: 1332–1340. [DOI] [PubMed] [Google Scholar]
- 53.Koppes LLJ, Dekker JM, Hendriks HFJ, et al. Moderate alcohol consumption lowers the risk of type 2 diabetes: a meta-analysis of prospective observational studies. Diabetes Care 2005; 28: 719–725. [DOI] [PubMed] [Google Scholar]
- 54.Sornette D, Deschâtres F, Gilbert T, Ageon Y. Endogenous versus exogenous shocks in complex networks: An empirical test using book sale rankings. Phys Rev Lett 2004; 93(22): 228701. [DOI] [PubMed] [Google Scholar]
- 55.Page L, Brin S, Motwani R abd Winograd T. The PageRank Citation Ranking: Bringing Order to the Web. Report 1999-66. Stanford InfoLab, 1999. Available from: http://ilpubs.stanford.edu:8090/422/.
- 56.Gleich DF. PageRank beyond the Web. SIAM Rev 2015; 57: 321–363. [Google Scholar]
- 57.Porter MA, Onnela JP, Mucha PJ. Communities in networks. Not Amer Math Soc 2009; 56: 1082. [Google Scholar]
- 58.Mitchell A, Barthel M, Shearer E, et al. The Evolving Role of News on Twitter and Facebook. Pew Research Center; 2015. Available from: http://www.journalism.org/2015/07/14/the-evolving-role-of-news-on-twitter-and-facebook/.
- 59.Shiffman DS. Twitter as a tool for conservation education and outreach: what scientific conferences can do to promote live-tweeting. J Environ Stud Sci 2012; 2: 257–262. [Google Scholar]
- 60.Radmanesh A, Duszak R, Fitzgerald RT. Social media and public outreach: a physician primer. Amer J Neuroradiol 2014; 9(11): A4100. [DOI] [PMC free article] [PubMed] [Google Scholar]
- 61.You J. Who are the science stars of Twitter? Science 2014; 345(6203): 1440–1441. [DOI] [PubMed] [Google Scholar]
- 62.Álvarez R, García D, Moreno Y, Schweitzer F. Sentiment cascades in the 15M movement. EPJ Data Science 2015; 4(1): 1–13. [Google Scholar]
- 63.So J, Prestin A, Lee L, et al. What do people like to “share” about obesity? A content analysis of frequent retweets about obesity on Twitter. Health Commun 2015. PMID: 26086083. [DOI] [PubMed]
- 64.McLennan AK, Ulijaszek SJ, Eli K. Social aspects of dietary sugars. Dietary Sugars Health 2014; 1: 1. [Google Scholar]
- 65.McLennan AK and Ulijaszek SJ. Political models of obesity: Set within regulatory frameworks and ideologies. In: 22nd European Congress on Obesity 2015, Prague, 2015.
- 66.Ulijaszek SJ, McLennan AK. Framing obesity in UK policy from the Blair years, 1997–2015: the persistence of individualistic approaches despite overwhelming evidence of societal and economic factors, and the need for collective responsibility. Obesity Rev 2016; 17: 397–411. [DOI] [PubMed] [Google Scholar]
- 67.McLennan AK, Ulijaszek SJ, Beguerisse-Díaz M. Who talks about diabetes on Twitter, what do they say, and why does it matter?In: Schneider T, Eli K, Dolan C, et al. (eds). Digital Food Activism, London: Routledge, In press. [Google Scholar]
- 68.Berg L, Gornitzka Å. The consumer attention deficit syndrome: Consumer choices in complex markets. Acta Sociologica 2012; 55: 159–178. [Google Scholar]
- 69.Gallotti R, Porter MA, Barthelemy M. Lost in transportation: Information measures and cognitive limits in multilayer navigation. Science Advances 2016; 2: 2. [DOI] [PMC free article] [PubMed] [Google Scholar]
- 70.Mariano BD. (2017). Study of dynamic communities on networks – Diabetes tweets. [Data Collection]. Colchester, Essex: UK Data Archive. 10.5255/UKDA-SN-852474. Available from: http://reshare.ukdataservice.ac.uk/852474/.
Associated Data
This section collects any data citations, data availability statements, or supplementary materials included in this article.