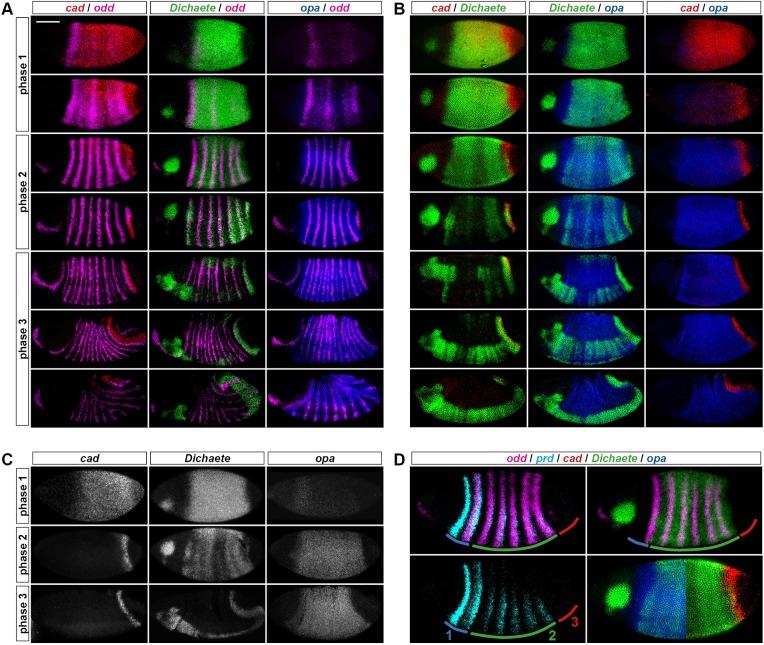
Fig. 2.
Spatiotemporal dynamics of cad, Dichaete and opa during Drosophila segmentation. (A) Expression relative to odd. (B) Expression relative to each other. (C) Summary of the overall temporal sequence. (D) Spatial correlations with segmentation timing differences along the AP axis. Embryos are all at early phase 2; annotations highlight distinct regions of pair-rule gene expression (see text); bottom-right panel combines two embryos from B. opa/odd images in rows 2-4 of A are reproduced, with permission, from Clark and Akam (2016a). Scale bar: 100 µm.

