

Abstract
Antihypertensive medication nonadherence is highly prevalent, leading to uncontrolled blood pressure. Methods that facilitate the targeting and tailoring of adherence interventions in clinical settings are required. Group‐Based Trajectory Modeling (GBTM) is a newer method to evaluate adherence using pharmacy dispensing (refill) data that has advantages over traditional refill adherence metrics (e.g. Proportion of Days Covered) by identifying groups of patients who may benefit from adherence interventions, and identifying patterns of adherence behavior over time that may facilitate tailoring of an adherence intervention. We evaluated adherence to antihypertensive medication in 905 patients over a 12‐month period in a community pharmacy setting using GBTM, identifying three subgroups of adherence patterns: 52.8%, 40.7%, and 6.5% had very high, high, and low adherence, respectively. However, GBTM failed to demonstrate predictive validity with blood pressure at 12 months. Further research on the validity of adherence measures that facilitate interventions in clinical settings is required.
Study Highlights.
WHAT IS THE CURRENT KNOWLEDGE ON THE TOPIC?
☑ Antihypertensive medication nonadherence is a major cause of the failure to achieve blood pressure targets. Numerous adherence interventions exist; however, they would benefit from methods in clinical settings that facilitate the targeting and tailoring of interventions.
WHAT QUESTION DID THIS STUDY ADDRESS?
☑ GBTM, a newer method to evaluate adherence using pharmacy refill data which may facilitate the targeting and tailoring of interventions, was tested for predictive validity with blood pressure in a community pharmacy setting.
WHAT THIS STUDY ADDS TO OUR KNOWLEDGE
☑ Neither GBTM nor traditional pharmacy refill adherence methods demonstrated predictive validity in this clinical setting.
HOW THIS MIGHT CHANGE CLINICAL PHARMACOLOGY OR TRANSLATIONAL SCIENCE
☑ Applications embedded within community pharmacy systems to evaluate patient adherence may facilitate uptake of interventions into practice; however, further research is needed to find valid and reliable methods.
Adherence to medication has often been defined as the extent to which a patient takes their medication as prescribed.1, 2, 3 Medication nonadherence, however, is highly prevalent across chronic illnesses, estimated at ∼34–50%,4 leading the World Health Organization to suggest that increasing medication adherence may have a greater impact on the health of populations than any improvement in specific medical treatments.2 Poor adherence to antihypertensive medication is a key factor in the failure to control hypertension,5 with the prevalence of optimal adherence (more than 80% of doses taken) to antihypertensive medication estimated at 59%, which is associated with a 19% reduced risk of cardiovascular disease and a 29% reduction in risk of all‐cause mortality.6 Numerous effective interventions to improve adherence to antihypertensive medication and reduce blood pressure exist, including simplification of dose regimen, reminders, patient education, motivation, and support.7 Yet few adherence interventions lead to large improvements in adherence and clinical outcomes, and interventions that improve both adherence and clinical outcomes tend to be complex, which limits feasibility in practice.8, 9 However, failure to target interventions to nonadherent patients and to tailor the intervention to individual patient barriers to adherence may have undermined the success of interventions in clinical settings.7, 8 In a recent pragmatic trial of reminder devices, one potential reason for the absence of improvements in adherence was the failure to tailor the intervention to patients who may be forgetful.10 Tailoring of complex interventions may improve effectiveness and also improve feasibility in routine clinical settings.11
Methods to identify patients with poor adherence and to assess specific barriers to adherence in clinical settings are required to facilitate the targeting of complex interventions to appropriate patients. Pharmacy dispensing (refill) data have been used to estimate patient adherence and is considered suitable for use in clinical settings.12, 13 The Medication Possession Ratio (MPR) and the Proportion of Days Covered (PDC) are the most commonly derived indices.14, 15 These reduce complex longitudinal dispensing data to a single easily understood summary estimate of the ratio or percentage of medication available to a patient during a defined period and aid identification of patients who may benefit from adherence interventions. However, this reduction in complexity results in loss of information, particularly the patterns of adherence behavior. Medication adherence can be conceptualized as a dynamic process consisting of three distinct components: initiation, implementation, and persistence.1 The reduction of complexity with PDC limits the ability to distinguish patients with considerable differences in their initiation, implementation, and persistence behaviors, and fails to account for the dynamic nature of adherence.16 For example, a patient who discontinues medication halfway through a treatment period will have an identical PDC to a patient who misses a dose every second day. It has been suggested that patients who discontinue medication require different interventions to those who have issues with remembering to take medication each day, for example, remotivation to adhere vs. reminders to take medication.1
A newer method to measure adherence using pharmacy dispensing records is Group‐Based Trajectory Modeling (GBTM).16 The advancement associated with GBTM over PDC is, first, its ability to identify clusters or groups of patients with similar patterns of pharmacy medication refill behavior, depicting this in an intuitive graphic,16 which may facilitate the targeting of interventions to patients who may benefit from adherence interventions; and, second, for each group it defines a trajectory of medication refill behavior over time, revealing patterns of medication adherence that may facilitate tailoring of interventions.17 Recent studies have found GBTM to be superior to PDC in evaluating adherence.18, 19, 20, 21, 22 Furthermore, differences in modifiable determinants of adherence between adherence trajectory groupings have been observed in patients with coronary heart disease18 and heart failure.20
GBTM appears to be a promising method to identify poor adherence and to tailor adherence interventions in clinical settings such as community pharmacy. However, to date studies characterizing adherence using GBTM have been predominantly retrospective, utilizing claims databases, including only patients covered by the relevant insurance scheme and those initiating medication during the observation period. No published studies exist characterizing antihypertensive medication adherence using GBTM in older adults attending a community pharmacy and the validity of this adherence measure in a clinical setting has not been tested. The objectives of our study were 1) to characterize adherence to antihypertensive medication in a cohort of older community‐dwelling adults with hypertension using dispensing data from the community pharmacy, and 2) to test the predictive validity of GBTM derived from community pharmacy dispensing data against systolic and diastolic blood pressure.
RESULTS
Participants
A total of 2,231 consecutive patients were invited to participate from 106 community pharmacies across the Republic of Ireland, 71% (N = 1,592) consented and completed the baseline telephone interview. Twenty‐eight participants were ineligible as they did not meet the inclusion criteria, leaving a sample of 1,564 at baseline. At 12 months, participants were recontacted, 1,232 (79%) agreeing to the follow‐up interview. Each interview was linked to dispensing records from that pharmacy for the previous 12 months. For those completing follow‐up interview, 138 reported not always attending the pharmacy of recruitment and thus were excluded from adherence assessment, as medication dispensed elsewhere was not captured, while pharmacy dispensing records were not available for a further 189 participants, leaving a final sample of 905 (57.9%) participants (Figure 1).
Figure 1.
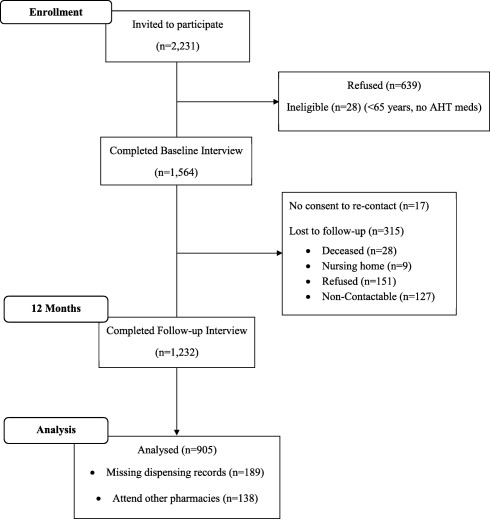
Flowchart of participants through the study.
GBTMs
Four trajectory models were generated ranging from 2–5 adherence trajectory groups (Figure 2). Increasing the number of groups yielded improvements in statistical fit (Bayesian Information Criterion (BIC), Akaike Information Criterion (AIC), and Entropy); however, based on the requirement to have a minimum group size of at least 5%, the three‐group model was considered best fit (Table 1). In this three‐group model, three distinct patterns of medication adherence were apparent during 12‐month follow‐up that may be considered as very high levels of adherence, consistently high levels of adherence, and low levels of adherence, which decreased slightly during follow‐up. Based on each participants highest group membership probability, 52.8%, 40.7%, and 6.5% were assigned to each group, respectively
Figure 2.
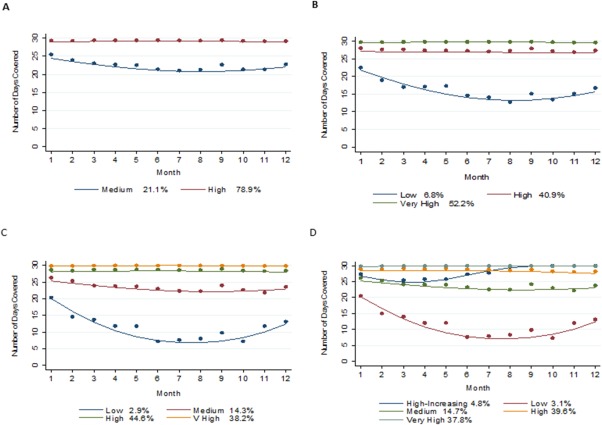
Trajectory Group Models with 2–5 groups. In each plot the solid lines represent the estimated adherence trajectories and the dot symbols represent the group means at each interval. Percentages of estimated group membership probabilities are presented alongside the description of the estimated adherence trajectory. These represent the mean estimated probability of membership to each group. The estimated group percentage differs from the adherence group membership, which is a categorical variable following assignment of participants to their most likely group. The x‐axis represents each 30‐day interval during the follow‐up period, while the y‐axis represents the number of days covered with an antihypertensive medication within each 30‐day interval.
Table 1.
Model fit statistics
| Model | BIC (N = 10586) | BIC (N = 895) | AIC | >5% per group | Entropy |
|---|---|---|---|---|---|
| 2 Groups | –14202.08 | –14192.18 | –14172.95 | Yes | Yes |
| 3 Groups | –13930.57 | –13916.96 | –13890.52 | Yes | Yes |
| 4 Groups | –13829.83 | –13810.02 | –13771.56 | No | Yes |
| 5 Groups | –13778.71 | –13753.96 | –13705.88 | No | Yes |
BIC, Bayesian Information Criterion; AIC, Akaike Information Criterion. Each model yielded improvements in model fit statistics however for models with more than 3 groups the smallest group consisted of less than 5% of study sample.
Relative to the very high adherence group, participants in the low and high adherence groups were less likely to be eligible for the General Medical Services (GMS) scheme, to use fewer regular medications, to have higher concerns about their medication, and lower necessity beliefs (assessed using BMQ) (Table 2). Trajectory groups were also significantly associated with PDC and medication gaps. In multivariate multinomial logistic regression models adjusted for age and gender, GMS eligibility was not associated with trajectory grouping; more regular medication was associated with lower risk of low and high adherence relative to the very high group; while higher medication necessity beliefs were associated with a reduced risk of high adherence relative to the very high group (Table 3).
Table 2.
Baseline characteristics by adherence trajectory grouping
|
Total cohort N = 905 |
Low n = 59 (6.5%) |
High n = 368 (40.7%) |
Very high n = 478 (52.8%) |
P‐value | |
|---|---|---|---|---|---|
| Age | 76.39 | 75.49 | 76.04 | 76.76 | 0.127 |
| Male Gender | 47.1% (426) | 49.2% (29) | 51.4% (189) | 43.5% (208) | 0.073 |
| Education | |||||
| Secondary | 42.8% (369) | 34.6% (19) | 40.4% (140) | 45.6% (210) | |
| Third Level | 27.6% (238) | 34.6% (19) | 30.0% (104) | 25.0% (115) | 0.281 |
| GMS Patient | 74.6% (662) | 63.8% (37) | 71.5% (258) | 78.3% (367 | 0.013 |
| Current Smoker | 7.8% (70) | 12.1% (7) | 7.9% (29) | 7.2% (34) | 0.416 |
| Heart Attack | 14.9% (134) | 11.9% (7) | 14.2% (52) | 15.7% (75) | 0.663 |
| Angina | 14.0% (126) | 8.5% (5) | 15.0% (55) | 13.8% (66) | 0.400 |
| Stroke | 3.8% (34) | 5.1% (3) | 2.7% (10) | 4.4% (21) | 0.388 |
| Comorbidities (mean no.) | 2.41 | 2.24 | 2.34 | 2.49 | 0.289 |
| Time on AHT meds (mean years) | 11.45 | 8.84 | 11.26 | 11.89 | 0.069 |
| Unique medication (mean no.) | 6.52 | 4.16 | 6.32 | 6.97 | <0.001 |
| MDS Repackaging | 11.3% (102) | 8.5% (5) | 11.7% (43) | 11.3% (54) | 0.769 |
| AHT medication (mean no.) | 1.98 | 1.94 | 1.97 | 2.00 | 0.900 |
| Dose Frequency | 1.11 | 1.14 | 1.11 | 1.10 | 0.702 |
| Defined Daily Dose (mean WHO‐DDD) | 2.62 | 2.80 | 2.60 | 2.62 | 0.821 |
| ACEIs/ARBs | 76.6% (684) | 72.4% (42) | 77.1% (280) | 76.7% (362) | 0.731 |
| Alpha‐blockers | 6.5% (58) | 6.9% (4) | 7.2% (26) | 5.9% (28) | 0.768 |
| Beta‐blockers | 50.2% (448) | 48.3% (28) | 48.5% (176) | 51.7% (244) | 0.627 |
| CCBs | 43.9% (392) | 41.4% (24) | 45.2% (164) | 43.2% (204) | 0.787 |
| Diuretics | 29.0% (259) | 27.6% (16) | 27.8% (101) | 30.1% (142) | 0.752 |
| BMQ‐Specific Concerns (mean score) | 2.18 | 2.33 | 2.19 | 2.13 | 0.044 |
| BMQ‐Specific Necessity (mean score) | 3.65 | 3.5 | 3.61 | 3.77 | 0.003 |
| PDC (mean) | 0.94 | 0.69 | 0.92 | 0.98 | <0.001 |
| Medication Gaps (mean no.) | 1.67 | 4.05 | 2.30 | 0.89 | <0.001 |
GMS, General Medical Services; AHT, Antihypertensive; MDS, Multidose Compartment Systems; WHO‐DDD, World Health Organisation Defined Daily Dose; ACEIs, Angiotensin Converting Enzyme Inhibitors; ARBs, Angiotensin Receptor Blockers; CCBs, Calcium Channel Blockers; BMQ, Beliefs about Medication Questionaire; PDC, Proportion of Days Covered. Chi‐square to test categorical variables; Analysis of Variance to test continuous variables. Higher scores on the BMQ‐Concerns indicate greater concerns regarding antihypertensive medication; higher scores on the BMQ‐Necessity indicate stronger beliefs in the necessity of antihypertensive medication.
Table 3.
Multivariate multinomial logistic regression (n = 824)
| RRR | 95% CI | P‐value | |
|---|---|---|---|
| Group 1 ‐ Low | |||
| Age | 0.99 | 0.93‐1.05 | 0.687 |
| Male Gender | 1.26 | 0.72‐2.19 | 0.412 |
| GMS Patient | 0.89 | 0.46‐1.71 | 0.719 |
| No. of unique medication | 0.77 | 0.65‐0.90 | 0.002 |
| BMQ Concerns | 1.66 | 0.97‐2.84 | 0.065 |
| BMQ Necessity | 0.72 | 0.47‐1.08 | 0.114 |
| Group 2 ‐ High | |||
| Age | 0.99 | 0.97‐1.02 | 0.536 |
| Male Gender | 1.23 | 0.89‐1.70 | 0.201 |
| GMS Patient | 0.79 | 0.56‐1.11 | 0.179 |
| No. of unique medication | 0.96 | 0.92‐0.99 | 0.025 |
| BMQ Concerns | 1.27 | 0.97‐1.66 | 0.088 |
| BMQ Necessity | 0.73 | 0.60‐0.89 | 0.002 |
Final model (n = 824) due to missing data; age (5), GMS Patient (17), no. of unique medication (12); BMQ concerns (31), BMQ necessity (21). GMS, General Medical Services; BMQ, Beliefs about Medication Questionnaire. Standard errors adjusted for 87 clusters.
Blood pressure
Of the 905 participants assigned to adherence trajectory groups, 667 attended for blood pressure measurement. Using standard blood pressure (>140/90 mmHg) cutpoints, 39% (n = 261) of participants had uncontrolled blood pressure (mean systolic/diastolic blood pressure 135.25/76.80 mm Hg). In adjusted linear regression analyses, no significant associations between systolic blood pressure nor diastolic blood pressure and trajectory groupings were observed (Table 4). The regular use of dosage forms formulated with high quantities of sodium (e.g., soluble/dispersible tablets) were associated with significantly higher systolic blood pressure and age was inversely associated with diastolic blood pressure. In a sensitivity analysis using PDC and medication gaps, no significant associations with blood pressure were observed (Table 5). Finally, a secondary analysis, limiting the adherence assessment period to the final 3 months of follow‐up did not alter the findings.
Table 4.
Linear regression model of antihypertensive medication adherence trajectory group and systolic/diastolic blood pressure adjusted for covariates
| Systolic blood pressure | Diastolic blood pressure | |||
|---|---|---|---|---|
| β (95% CI) | p | β (95% CI) | P | |
| Trajectory Group | ||||
| Low | −0.93 (−6.60 to 4.75) | 0.746 | 0.62 (−3.13 to 4.36) | 0.743 |
| High | −1.94 (−4.48 to 0.60) | 0.132 | −1.29 (−3.09 to 0.50) | 0.155 |
| Very High | Ref | − | Ref | − |
| Male | 2.08 (−0.82 to 4.99) | 0.157 | −0.20 (−1.97 to 1.56) | 0.820 |
| Age | 0.05 (−0.17 to 0.28) | 0.627 | −0.19 (−0.35 to −0.03) | 0.020 |
| Smoker | 0.22 (−5.14 to 5.60) | 0.934 | −0.70 (−3.78 to 2.43) | 0.669 |
| Private Health Insurance | 1.28 (−2.18 to 4.75) | 0.463 | −0.30 (−2.53 to 1.92) | 0.788 |
| GMS Patient | −2.26 (−5.64 to 1.12) | 0.186 | −1.01 (−3.28 to 1.26) | 0.380 |
| High Sodium Dosage Forms | 9.41 (2.15 to 16.68) | 0.012 | 0.49 (−4.03 to 5.00) | 0.831 |
| Defined Daily Dose (WHO‐DDD) | 0.37 (−0.69 to 1.42) | 0.489 | −0.23 (−1.07 to 0.50) | 0.594 |
| ACEIs/ARBs | 0.04 (−3.20 to 3.28) | 0.979 | −1.78 (−4.06 to 0.50) | 0.124 |
| Alpha‐blocker | 0.43 (−5.89 to 6.74) | 0.893 | 0.06 (−4.90 to 5.00) | 0.982 |
| Beta‐blocker | 2.25 (−0.89 to 5.39) | 0.158 | −0.64 (−2.30 to 1.03) | 0.449 |
| Diuretics | 2.81 (−0.24 to 5.87) | 0.071 | 0.07 (−2.11 to 2.25) | 0.949 |
| CCBs | 3.38 (−0.30 to 7.04) | 0.071 | −0.32 (−2.61 to 1.97) | 0.781 |
| Previous CVE | −1.98 (−5.06 to 1.10) | 0.204 | −0.57 (−2.52 to 1.38) | 0.560 |
| Diabetes | −0.59 (−4.24 to 3.06) | 0.749 | 0.52 (−2.76 to 1.73) | 0.651 |
| Renal Disease | 1.88 (−6.15 to 9.91) | 0.642 | −1.02 (−8.17 to 6.14) | 0.778 |
Final model (n = 644) due to missing data; age (3), smoker (3), private health insurance (7), medical card holder (6), and antihypertensive medication strength (9). GMS, General Medical Services; WHO‐DDD, World Health Organization Defined Daily Dose; ACEIs, Angiotensin Converting Enzyme Inhibitors; ARBs, Angiotensin Receptor Blockers; CCBs, Calcium Channel Blockers; CVE, cardiovascular events. Standard errors adjusted for 73 clusters.
Table 5.
Separate linear regression models of adherence measures (PDC and medication gaps) and systolic/diastolic blood pressure adjusted for covariates
| Systolic blood pressure | Diastolic blood pressure | |||
|---|---|---|---|---|
| β (95% CI) | p | β (95% CI) | P | |
| PDC | 5.81 (−5.44 to 17.05) | 0.307 | 1.47 (−5.86 to 8.80) | 0.690 |
| Medication Gaps | −0.25 (−0.89 to 0.38) | 0.429 | 0.13 (−0.31 to 0.57) | 0.569 |
Final model (n = 644) adjusted for gender, age, smoking status, private health insurance, General Medical Services eligibility, use of high sodium dosage forms, antihypertensive dose, antihypertensive class, previous cardiovascular event, diabetes and kidney disease. PDC, Proportion of Days Covered. Standard errors adjusted for 73 clusters using Sandwich‐Estimator.
DISCUSSION
In this prospective cohort study of older adults with hypertension, a three‐group trajectory model best summarized adherence patterns during 12‐month follow‐up. The patterns revealed three groups with a very high level of adherence, a consistently high level of adherence, and a low level of adherence that decreased over time. Based on individual participant's highest group membership probability, 52.8%, 40.7%, and 6.5% of participants were assigned to the respective groups, which were significantly associated with concurrent PDC and medication gaps. In assessing the effect of adherence on subsequent clinical outcomes, adherence trajectory groups were not associated with blood pressure. In a sensitivity analysis, PDC and medication gaps were also not associated with blood pressure.
Previous studies have utilized GBTM on pharmacy claims data to assess adherence to statins,16, 21, 23 diabetes medication,19 heart failure medication,20 coronary heart disease medication,18 and glaucoma medication.22 The number of distinct trajectory groups identified in these studies ranged from three to seven. For example, Librero et al. identified three distinct patterns of statin adherence posthospitalization for acute coronary syndrome that were labeled always adherent, occasional users, and fast declining.18 In contrast, Lo‐Ciganic et al. identified seven distinct patterns of oral hypoglycemic adherence in new users, which included four groups with consistent levels of adherence ranging from low to perfect and three groups with steep declines in adherence including immediate nonadherence, early discontinuation, and late discontinuation.19 We observed relatively high levels of adherence, with more than 90% of participants classified as having higher than 80% adherence, much higher than the 59% meta‐analytical finding.6 Half the cohort was grouped into a very high adherence trajectory, while a further 40% were grouped separately into a consistently high adherence trajectory. Employing an arbitrary cutoff of 80% would not differentiate the second group, who clinically may represent a group of patients who occasionally miss doses. Finally, a low proportion of the cohort was classified as having low adherence, identifying a target group for adherence interventions.
It is important to note differences in participant characteristics with previous studies; participants in our study consisted largely of prevalent users of antihypertensive medication (mean length of time on antihypertensive medication was 11.5 years) with ∼2.5% (n = 36) of the cohort at recruitment taking antihypertensive medication for fewer than 12 months. In comparison, other studies utilizing GBTM have predominantly studied new‐users of long‐term medication. Previous research has shown ∼50% of patients discontinue antihypertensive medication within the first 12 months of therapy.24, 25 Furthermore, the meta‐analytical findings included an upper 95% confidence interval of 77%, and an upper range of 93%, with adherence rates varying by study design, adherence measure, and medication type, but also factors such as age.6 The high levels of adherence and the absence of steep declining adherence patterns observed in our study is likely attributable to the cohort characteristics, which may represent a population at low risk of poor adherence.
Previous studies assessing associations between baseline characteristics and trajectory groups have identified factors such as age, education, race, and medication copayments to significantly affect adherence trajectory group membership.18, 20, 22 Modifiable determinants of adherence that are significantly associated with low adherence groups could be used to tailor appropriate adherence interventions. We identified that taking more regular medication was associated with the very high adherence group. The effect of the number of medication on adherence is mixed, with observational studies reporting conflicting findings.26 Patients who take more medication may find it difficult to adhere to a complex regimen, while on the other hand these patients may have stronger medication‐taking habits. The contradictory findings may also relate to variations in definitions for polypharmacy, but also it is important to consider methods to evaluate adherence to multiple related medications. In our modeling we utilized a strategy proposed by Choudhury et al.27 We also observed patients with lower necessity beliefs were less likely to be in the very high adherence group, and similarly that higher medication concerns may also be associated with lower adherence groupings. These are consistent with previous findings that stronger necessity beliefs and lower concerns are associated with better adherence.28 However, it must be noted that it is recommended to assess the multidimensional relationship of patient medication concerns and necessity beliefs with adherence using a continuous measure of adherence and to utilize polynomial regression to test the multidimensional relationship.29 Assessing medication beliefs of patients with adherence issues identified by GBTM may further facilitate the tailoring of adherence interventions, e.g., motivational‐based interventions.8, 9 This analysis further highlights important clinical differences between the two high adherence groups; however, it is limited by the low number of participants in the smallest group, precluding the inclusion of all theoretically relevant variables in the final multivariate model.
Adherence trajectory groups have been shown to predict clinical outcomes in users of statins and oral hypoglycaemics19, 21; however, we did not observe significant associations between trajectory groups and blood pressure. In a sensitivity analysis neither PDC nor medication gaps were associated with blood pressure. A number of reasons may explain this observation. First, in cohorts of prevalent antihypertensive medication users with relatively high levels of adherence, other factors influencing blood pressure may be responsible for the variance.30 Previous studies of cohorts with established hypertension recruited from primary‐care settings similarly observed high levels of adherence and the absence of a relationship with subsequent blood pressure.31 For populations with high levels of adherence, factors such as nonresponse to treatment may be responsible for inadequate blood pressure control. In our multivariable models, neither the combined dose of all antihypertensive medication nor class of medication was associated with blood pressure. We did observe, however, that patients who were regularly dispensed high sodium dosage forms (predominantly soluble analgesics) had significantly higher systolic blood pressure. High‐salt intake is associated with higher blood pressure,32 and a previous large‐scale observational study reported that patients receiving high sodium medicines, predominantly effervescent, dispersible, and soluble formulations, had a significantly increased risk of cardiovascular events compared to patients receiving equivalent nonsodium‐containing medication.33 The majority of high sodium dosage forms identified in our cohort have alternative, nonsoluble, low‐sodium formulations that should be supplied preferentially to hypertensive patients.
Another possible explanation for the absence of a relationship between adherence and blood pressure in this study may relate to “white‐coat adherence,” whereby a patient increases adherence in the days prior to a clinic visit or measurement being taken.34, 35 It is possible that following invitation to attend for blood pressure measurement, participants altered their adherence behavior. Similar to the effects of white coat adherence, adherence behavior immediately prior to measuring blood pressure is likely to influence blood pressure to a greater extent. However, a secondary analysis utilizing refill adherence estimates generated for the 3 months immediately prior to BP measurement did not alter the findings.
The findings of this study should be interpreted in the light of its limitations. First, we measured blood pressure at a single timepoint in a clinic setting, which is less reliable than methods such as 24‐hour ambulatory monitoring or measurements taken at home. However, this is a still a valid method employed by large‐scale longitudinal studies36 and recommended by clinical guidelines, e.g., NICE, ESH. Second, a limitation to the construct validity of pharmacy refill measures is the assumption that medication dispensed to a patient is consumed, and that the medication is consumed at a rate equivalent to which it is dispensed.15 It is possible that this assumption has undermined the validity of the pharmacy adherence measurements. Finally, attrition was higher for participants with lower PDC at baseline; however, this was not evident for other adherence measurements at baseline, including trajectory group and medication gaps, and thus is unlikely to have biased the results.
Valid and reliable methods to identify poor adherence and to facilitate tailoring of interventions in clinical settings are needed.12, 13 Applications integrated into pharmacy dispensing systems may aid clinicians to identify subgroups of patients with medication adherence issues. GBTM is a newer method to evaluate adherence using pharmacy‐dispensing data that has been attributed advantages over traditional measures such as PDC16; however, in our study GBTM when applied to pharmacy dispensing records to evaluate antihypertensive medication adherence failed to demonstrate predictive validity with blood pressure. Although concordance was observed with other adherence measures, it is likely that the various adherence measures evaluate different aspects of medication adherence behavior, thus limiting conclusions drawn from concurrent assessments. Further research to identify suitably valid adherence refill measures in a community pharmacy setting is required.
METHODS
Study design and setting
We conducted a prospective cohort study, recruiting participants from 106 community pharmacies across the Republic of Ireland between March and May 2014. Pharmacies were selected on the basis of participating in the National Pharmacy Internship Programme. Consecutive participants were invited to take part if they met the following inclusion criteria: presenting to a participating pharmacy to fill a prescription for at least one medication for hypertension as determined by the pharmacist, aged 65 years or older, community dwelling, able to speak and understand English, and no evidence of cognitive impairment. After obtaining informed consent, participants completed a structured telephone interview conducted by trained pharmacy interns and were recontacted at 12 months to complete a follow‐up structured telephone interview. At follow‐up participants were invited to attend the pharmacy to have their blood pressure measured. Medication adherence during follow‐up was characterized using GBTM and associations between baseline patient characteristics and trajectory groups were assessed in multivariate regression models. The predictive validity of GBTM was tested through significant associations with blood pressure. A sensitivity analysis using traditional adherence refill metrics (PDC and medication gaps) was also undertaken.
Ethical approval for this study was granted by the Research Ethics Committee of the Royal College of Surgeons in Ireland.
Study variables
Group‐based trajectory modeling
GBTM is an application of finite mixture modeling that allows identification of groups of individuals with a similar evolution of an outcome over time, such as medication adherence, through maximum likelihood estimation. For an in‐depth technical discussion of GBTM, please refer to Nagin and Tremblay (2001), and for an overview, refer to Nagin (2014).37, 38 GBTM was applied to pharmacy medication dispensing records for the 12‐month follow‐up period, which included information on the date of the dispensing, the product and quantity dispensed, and directions for use. A medication supply diary was created for each participant divided into 12 30‐day intervals that recorded the number of days within each interval for which antihypertensive medication was theoretically available to the patient based on the date and quantity of consecutive antihypertensive medication refills. For patients taking multiple antihypertensive medications, an average of the days' supplies for all antihypertensive medication was taken. When further medication was dispensed prior to exhausting a previous supply, the new supply was considered to begin after the previous supply was exhausted, to a maximum excess of 180 days of medication. The censored normal distribution was used to analyze the adherence data. Trajectory models with 2–5 groups were generated and for each model the polynomial function of time that best fits the data was selected. The output of GBTM includes estimated probabilities of group membership for each individual and each trajectory group, a categorical variable denoting the assigned group for each individual based on the highest estimated probability and a trajectory curve for each group over time. BIC, AIC, and Entropy were used to guide final model selection. To ensure model adequacy and usefulness, a minimum of 5% of participants were required to be assigned to each trajectory grouping.38, 39
Proportion of days covered
The proportion of days covered (PDC) is a common refill measure,15 and its validity in hypertension has been demonstrated through significant associations with blood pressure control.40, 41, 42 The PDC was calculated by dividing the number of days' covered by the antihypertensive medication from the date of the first prescription during the observation period to the end of the observation period. Oversupplies at the end of the observation period were excluded. For patients receiving multiple antihypertensive medication, an overall PDC was obtained by averaging PDCs across each class of antihypertensive. PDCs exceeding 1, which indicate oversupplies of medication, were recoded to 1.
Medication gaps
A potential weakness associated with GBTM is the inability to account for short periods of nonpersistence that may have significant clinical outcomes. For example, short periods of nonadherence to oral contraceptives or antiretroviral medication may lead to unplanned pregnancy or failure to maintain viral suppression.43 Thus, we also estimated the number of occasions that gaps of 5 days occurred between each medication supply during the 12‐month follow‐up. If further medication was obtained prior to exhausting a previous supply, the new supply was considered to begin after the previous supply was exhausted, to a maximum excess of 180 days of medication.
Blood pressure
Systolic blood pressure and diastolic blood pressure were measured at 12‐month follow‐up. A standardized study protocol was used, based on the The Irish Longitudinal Study of Ageing (TILDA) protocol for BP measurement (two measurements while seated with elbow supported, taken 2 min apart) using study blood pressure monitors (Omron M6 Comfort BP monitor; Hoofddorp, Netherlands).36 Training was provided to pharmacy interns to measure blood pressure, while pharmacists were provided with the study monitor and protocol. The average of two blood pressure readings was calculated.
Covariates
To assess the association between patient characteristics and trajectory groups, factors previously identified to influence adherence including demographics (i.e., age, gender, education, and state‐funded healthcare status), beliefs about medicines, health behaviors (smoking), comorbidities, and medication history were recorded at the baseline interview.2 Eligibility for the Irish General Medical Scheme (GMS) is by means‐testing based on income and is a socioeconomic indicator. The concerns and necessity‐beliefs subscales of the Beliefs about Medicines Questionnaire (BMQ‐Specific) were administered at baseline. According to the Necessity‐Concerns Framework (NCF), patients are more likely to take their medication if they have stronger medication necessity beliefs and fewer medication concerns. The subscales of the BMQ‐Specific consists of five items measuring concerns about medication (e.g., “Having to take medicines worries me”) and five items regarding patients necessity‐beliefs about medication (e.g., “My health, at present, depends on my medicine”), on a 5‐point Likert scale, which was rated with regard to antihypertensive.44 Higher scores on the BMQ‐Concerns indicate greater concerns regarding antihypertensive medication; higher scores on the BMQ‐Necessity indicate stronger beliefs for the necessity of antihypertensive medication. Multimorbidity was measured as a count of self‐reported comorbid conditions.45 History of heart attack, angina, and stroke were considered important covariates, as adherence to treatment of hypertension for secondary prevention may be higher.46 The use of multidose units packaging (MDUs), the number of regular medicines, the class and number of specific antihypertensive medication, and the dosing frequency, which may also influence adherence,47, 48, 49 were determined at baseline from dispensing records.
To control for confounding in linear regression models predicting blood pressure, a number of covariates recorded during the follow‐up interview were considered for inclusion in multivariable models due to theoretical associations with blood pressure including age, gender, smoking status, medical history, and medication use. An additional variable identified from pharmacy records was the regular use of high sodium‐content dosage forms (e.g., soluble analgesics). Soluble dosage forms contain high levels of sodium, which often exceed the recommend daily sodium allowances and may contribute to higher blood pressure.
Statistical analyses
Characteristics of the sample are described overall and by trajectory grouping of the final GBTM model. Associations between participant characteristics and trajectory group were assessed using appropriate tests (e.g., chi‐square). Multivariate multinomial logistic regression was used to assess differences in baseline characteristics across adherence trajectory groups, with the number of variables included limited by the size of the smallest trajectory group. The predictive validity of adherence trajectory groups were assessed by examining associations with systolic and diastolic blood pressure in linear regression models adjusted for covariates. In sensitivity analyses, PDC and medication gaps were also assessed for associations with blood pressure. Furthermore, a secondary analysis using adherence estimates for the final 3‐month period of follow‐up was undertaken, as medication‐taking behavior during a shorter period prior to blood pressure measurement may be more appropriate than medication behavior assessed over a 12‐month period. Standard errors were adjusted in regression models using the Sandwich‐estimator, due to potential for dependency of observations at the pharmacy level. Statistical modeling was performed using Stata v. 13 (StataCorp, College Station, TX) and the user‐written TRAJ procedure for trajectory models (http://www.andrew.cmu.edu/user/bjones).50
CONFLICT OF INTEREST
The authors have no conflicts of interest to declare.
AUTHOR CONTRIBUTIONS
P.D. and G.C. wrote the article; P.D., D.S., S.S., P.G., and G.C. designed the research; P.D. and G.C. performed the research; P.D. analyzed the data.
ACKNOWLEDGMENTS
We thank the Pharmaceutical Society of Ireland (PSI), for whom the Royal College of Surgeons in Ireland (RCSI) manages the National Pharmacy Internship Programme (NPIP). We also thank all pharmacists who contributed to and facilitated the undertaking of this study.
References
- 1. Vrijens, B. et al A new taxonomy for describing and defining adherence to medications. Br. J. Clin. Pharmacol. 73, 691–705 (2012). [DOI] [PMC free article] [PubMed] [Google Scholar]
- 2. Sabate, E. Adherence to Long‐Term Therapies — Evidence for Action. Geneva: World Health Organization; 2003. [Google Scholar]
- 3. Rand, C.S. Measuring adherence with therapy for chronic diseases: implications for the treatment of heterozygous familial hypercholesterolemia. Am. J. Cardiol. 72, 68d–74d (1993). [DOI] [PubMed] [Google Scholar]
- 4. Naderi, S.H. , Bestwick, J.P. & Wald, D.S. Adherence to drugs that prevent cardiovascular disease: meta‐analysis on 376,162 patients. Am. J. Med. 125, 882–887 (2012). [DOI] [PubMed] [Google Scholar]
- 5. Halpern, M.T. et al Recommendations for evaluating compliance and persistence with hypertension therapy using retrospective data. Hypertension. 47, 1039–1048 (2006). [DOI] [PubMed] [Google Scholar]
- 6. Chowdhury, R. et al Adherence to cardiovascular therapy: a meta‐analysis of prevalence and clinical consequences. Eur. Heart J. 34, 2940–2948 (2013). [DOI] [PubMed] [Google Scholar]
- 7. Schroeder, K. , Fahey, T. & Ebrahim, S. Interventions for improving adherence to treatment in patients with high blood pressure in ambulatory settings. Cochrane Database Syst. Rev. 1, Cd004804 (2004). [DOI] [PMC free article] [PubMed] [Google Scholar]
- 8. Nieuwlaat, R. et al Interventions for enhancing medication adherence. Cochrane Database Syst. Rev. 11, Cd000011 (2014). [DOI] [PMC free article] [PubMed] [Google Scholar]
- 9. Costa, E. et al Interventional tools to improve medication adherence: review of literature. Patient Prefer. Adherence. 9, 1303–1314 (2015). [DOI] [PMC free article] [PubMed] [Google Scholar]
- 10. Choudhry, N.K. et al Effect of reminder devices on medication adherence: The remind randomized clinical trial. JAMA Intern. Med. (2017) [Epub ahead of print]. [DOI] [PMC free article] [PubMed] [Google Scholar]
- 11. Nguyen, T.M.U. , La Caze, A. & Cottrell, N. Validated adherence scales used in a measurement‐guided medication management approach to target and tailor a medication adherence intervention: a randomised controlled trial. BMJ Open. 6, 11 (2016). [DOI] [PMC free article] [PubMed] [Google Scholar]
- 12. Giardini, A. et al Toward appropriate criteria in medication adherence assessment in older persons: position paper. Aging Clin. Exp. Res. 1–11 (2015). [DOI] [PubMed] [Google Scholar]
- 13. Marengoni, A. et al Strategies to improve medication adherence in older persons: consensus statement from the Senior Italia Federanziani Advisory Board. Drugs Aging. 33, 629–637 (2016). [DOI] [PubMed] [Google Scholar]
- 14. Steiner, J.F. & Prochazka, A.V. The assessment of refill compliance using pharmacy records: methods, validity, and applications. J. Clin. Epidemiol. 50, 105–116 (1997). [DOI] [PubMed] [Google Scholar]
- 15. Sattler, E.L. , Lee, J.S. & Perri, M, 3rd. Medication (re)fill adherence measures derived from pharmacy claims data in older Americans: a review of the literature. Drugs Aging. 30, 383–399 (2013). [DOI] [PubMed] [Google Scholar]
- 16. Franklin, J.M. et al Group‐based trajectory models: a new approach to classifying and predicting long‐term medication adherence. Med. Care. 51, 789–796 (2013). [DOI] [PubMed] [Google Scholar]
- 17. Fischer, M.A. Capsule commentary on Lo‐Ciganic , et al, Trajectories of diabetes medication adherence and hospitalization risk: a retrospective cohort study in a large state medicaid program. J. Gen. Intern. Med. 31, 1081 (2016). [DOI] [PMC free article] [PubMed] [Google Scholar]
- 18. Librero, J. , Sanfelix‐Gimeno, G. & Peiro, S. Medication adherence patterns after hospitalization for coronary heart disease. A population‐based study using electronic records and group‐based trajectory models. PLoS One. 11, e0161381 (2016). [DOI] [PMC free article] [PubMed] [Google Scholar]
- 19. Lo‐Ciganic, W.H. et al Trajectories of diabetes medication adherence and hospitalization risk: a retrospective cohort study in a large state medicaid program. J. Gen. Intern. Med. 31, 1052–1060 (2016). [DOI] [PMC free article] [PubMed] [Google Scholar]
- 20. Juarez, D.T. et al Factors affecting medication adherence trajectories for patients with heart failure. Am. J. Manag. Care. 21, e197–205 (2015). [PMC free article] [PubMed] [Google Scholar]
- 21. Franklin, J.M. et al Association between trajectories of statin adherence and subsequent cardiovascular events. Pharmacoepidemiol. Drug Saf. 24, 1105–1113 (2015). [DOI] [PubMed] [Google Scholar]
- 22. Newman‐Casey, P.A. et al Patterns of glaucoma medication adherence over four years of follow‐up. Ophthalmology. 122, 2010–2021 (2015). [DOI] [PMC free article] [PubMed] [Google Scholar]
- 23. Franklin, J.M. et al Predicting adherence trajectory using initial patterns of medication filling. Am. J. Manag. Care. 21, e537–544 (2015). [PubMed] [Google Scholar]
- 24. Vrijens, B. , Urquhart, J. & White, D. Electronically monitored dosing histories can be used to develop a medication‐taking habit and manage patient adherence. Expert Rev. Clin. Pharmacol. 7, 633–644 (2014). [DOI] [PubMed] [Google Scholar]
- 25. Jones, J.K. , Gorkin, L. , Lian, J.F. , Staffa, J.A. & Fletcher, A.P. Discontinuation of and changes in treatment after start of new courses of antihypertensive drugs: a study of a United Kingdom population. BMJ. 311, 293–295 (1995). [DOI] [PMC free article] [PubMed] [Google Scholar]
- 26. Gellad, W.F. , Grenard, J.L. & Marcum, Z.A. A systematic review of barriers to medication adherence in the elderly: looking beyond cost and regimen complexity. Am. J. Geriatr. Pharmacother. 9, 11–23 (2011). [DOI] [PMC free article] [PubMed] [Google Scholar]
- 27. Choudhry, N.K. et al Measuring concurrent adherence to multiple related medications. Am. J. Manag. Care. 15, 457–464 (2009). [PMC free article] [PubMed] [Google Scholar]
- 28. Horne, R. et al Understanding patients' adherence‐related beliefs about medicines prescribed for long‐term conditions: a meta‐analytic review of the Necessity‐Concerns Framework. PLoS One. 8, e80633 (2013). [DOI] [PMC free article] [PubMed] [Google Scholar]
- 29. Phillips, L.A. , Diefenbach, M.A. , Kronish, I.M. , Negron, R.M. & Horowitz, C.R. The necessity‐concerns framework: a multidimensional theory benefits from multidimensional analysis. Ann. Behav. Med. 48, 7–16 (2014). [DOI] [PMC free article] [PubMed] [Google Scholar]
- 30. Mant, J. & McManus, R.J. Does it matter whether patients take their antihypertensive medication as prescribed? The complex relationship between adherence and blood pressure control. J. Hum. Hypertens. 20, 551–553 (2006). [DOI] [PubMed] [Google Scholar]
- 31. Schroeder, K. , Fahey, T. , Hay, A.D. , Montgomery, A. & Peters, T.J. Relationship between medication adherence and blood pressure in primary care: prospective study. J. Hum. Hypertens. 20, 625–627 (2006). [DOI] [PubMed] [Google Scholar]
- 32. Intersalt: An international study of electrolyte excretion and blood pressure. Results for 24 hour urinary sodium and potassium excretion. Intersalt Cooperative Research Group . BMJ. 297, 319–328 (1988). [DOI] [PMC free article] [PubMed] [Google Scholar]
- 33. George, J. , Majeed, W. , Mackenzie, I.S. , MacDonald, T.M. & Wei, L. Association between cardiovascular events and sodium‐containing effervescent, dispersible, and soluble drugs: nested case‐control study. BMJ. 347, f6954 (2013). [DOI] [PMC free article] [PubMed] [Google Scholar]
- 34. Cramer, J.A. , Scheyer, R.D. & Mattson, R.H. Compliance declines between clinic visits. Arch. Intern. Med. 150, 1509–1510 (1990). [PubMed] [Google Scholar]
- 35. Osterberg, L. & Blaschke, T. Adherence to medication. N. Engl. J. Med. 353, 487–497 (2005). [DOI] [PubMed] [Google Scholar]
- 36. Murphy, C.M. et al Hypertension prevalence, awareness, treatment and control in the over 50s in Ireland: evidence from The Irish Longitudinal Study on Ageing. J. Public Health (Oxf). (2015) [Epub ahead of print]. [DOI] [PubMed] [Google Scholar]
- 37. Nagin, D.S. & Tremblay, R.E. Analyzing developmental trajectories of distinct but related behaviors: a group‐based method. Psychol. Methods. 6, 18–34 (2001). [DOI] [PubMed] [Google Scholar]
- 38. Nagin, D.S. Group‐based trajectory modeling: an overview. Ann. Nutr. Metab. 65, 205–210 (2014). [DOI] [PubMed] [Google Scholar]
- 39. Nagin, D.S. & Odgers, C.L. Group‐based trajectory modeling in clinical research. Annu. Rev. Clin. Psychol. 6, 109–138 (2010). [DOI] [PubMed] [Google Scholar]
- 40. Bond, C.A. & Monson, R. Sustained improvement in drug documentation, compliance, and disease control. A four‐year analysis of an ambulatory care model. Arch. Intern. Med. 144, 1159–1162 (1984). [PubMed] [Google Scholar]
- 41. Krousel‐Wood, M. et al Differences in cardiovascular disease risk when antihypertensive medication adherence is assessed by pharmacy fill versus self‐report: the Cohort Study of Medication Adherence among Older Adults (CoSMO). J. Hypertens. 33, 412–420 (2015). [DOI] [PMC free article] [PubMed] [Google Scholar]
- 42. Bramley, T.J. , Gerbino, P.P. , Nightengale, B.S. & Frech‐Tamas, F. Relationship of blood pressure control to adherence with antihypertensive monotherapy in 13 managed care organizations. J. Manag. Care Pharm. 12, 239–245 (2006). [DOI] [PMC free article] [PubMed] [Google Scholar]
- 43. Urquhart, J. Defining the margins for errors in patient compliance with prescribed drug regimens. Pharmacoepidemiol. Drug Saf. 9, 565–568 (2000). [DOI] [PubMed] [Google Scholar]
- 44. Horne, R. , Weinman, J. & Hankins, M. The beliefs about medicines questionnaire: The development and evaluation of a new method for assessing the cognitive representation of medication. Psychol. Health. 14, 1–24 (1999). [Google Scholar]
- 45. Huntley, A.L. , Johnson, R. , Purdy, S. , Valderas, J.M. & Salisbury, C. Measures of multimorbidity and morbidity burden for use in primary care and community settings: a systematic review and guide. Ann. Fam. Med. 10, 134–141 (2012). [DOI] [PMC free article] [PubMed] [Google Scholar]
- 46. Chapman, R.H. et al Predictors of adherence with antihypertensive and lipid‐lowering therapy. Arch. Intern. Med. 165, 1147–1152 (2005). [DOI] [PubMed] [Google Scholar]
- 47. Ingersoll, K.S. & Cohen, J. The impact of medication regimen factors on adherence to chronic treatment: a review of literature. J. Behav. Med. 31, 213–224 (2008). [DOI] [PMC free article] [PubMed] [Google Scholar]
- 48. Kronish, I.M. et al Meta‐analysis: impact of drug class on adherence to antihypertensives. Circulation. 123, 1611–1621 (2011). [DOI] [PMC free article] [PubMed] [Google Scholar]
- 49. Zedler, B.K. , Kakad, P. , Colilla, S. , Murrelle, L. & Shah, N.R. Does packaging with a calendar feature improve adherence to self‐administered medication for long‐term use? A systematic review. Clin. Ther. 33, 62–73 (2011). [DOI] [PubMed] [Google Scholar]
- 50. Jones, B.L. & Nagin, D.S. A Note on a Stata Plugin for Estimating Group‐based Trajectory Models. Sociol. Methods Res. 42, 608–613 (2013). [Google Scholar]