

Abstract
Background & Aims
Non‐alcoholic fatty liver disease (NAFLD) and non‐alcoholic steatohepatitis (NASH) are common clinico‐pathological conditions that affect millions of patients worldwide. In this study, the efficacy of saroglitazar, a novel PPARα/γ agonist, was assessed in models of NAFLD/NASH.
Methods & Results
HepG2 cells treated with palmitic acid (PA;0.75 mM) showed decreased expression of various antioxidant biomarkers (SOD1, SOD2, glutathione peroxidase and catalase) and increased expression of inflammatory markers (TNFα, IL1β and IL6). These effects were blocked by saroglitazar, pioglitazone and fenofibrate (all tested at 10μM concentration). Furthermore, these agents reversed PA‐mediated changes in mitochondrial dysfunction, ATP production, NFkB phosphorylation and stellate cell activation in HepG2 and HepG2‐LX2 Coculture studies. In mice with choline‐deficient high‐fat diet‐induced NASH, saroglitazar reduced hepatic steatosis, inflammation, ballooning and prevented development of fibrosis. It also reduced serum alanine aminotransferase, aspartate aminotransferase and expression of inflammatory and fibrosis biomarkers. In this model, the reduction in the overall NAFLD activity score by saroglitazar (3 mg/kg) was significantly more prominent than pioglitazone (25 mg/kg) and fenofibrate (100 mg/kg). Pioglitazone and fenofibrate did not show any improvement in steatosis, but partially improved inflammation and liver function. Antifibrotic effect of saroglitazar (4 mg/kg) was also observed in carbon tetrachloride‐induced fibrosis model.
Conclusions
Saroglitazar, a dual PPARα/γ agonist with predominant PPARα activity, shows an overall improvement in NASH. The effects of saroglitazar appear better than pure PPARα agonist, fenofibrate and PPARγ agonist pioglitazone.
Keywords: Dual‐PPAR agonist, NAFLD, NASH, Saroglitazar
Abbreviations
- CDAHFD
choline‐deficient, L‐amino acid‐defined, high‐fat diet
- DAPI
4′,6‐diamidino‐2‐phenylindole
- DCFDA
Dichlorodihydrofluorescein diacetate
- HSC
hepatic stellate cells
- NAFLD
non‐alcoholic fatty liver disease
- NASH
non‐alcoholic steatohepatitis
- PA
palmitic acid
- PPAR
peroxisome proliferator‐activated receptor
Key Points.
NAFLD & NASH are multifaceted conditions. The ideal drug for managing these conditions is expected to display beneficial effects on insulin resistance, steatosis, inflammation, oxidative stress, mitochondrial dysfunction and fibrosis.
Beneficial roles of PPARα and γ in NAFLD and NASH are not clear.
Saroglitazar, a dual PPARα/γ agonist demonstrated anti‐steatotic, anti‐inflammatory effects along with alleviation of oxidative stress, mitochondrial dysfunction and fibrosis.
Unique modulation of various biochemical mediators may be responsible for overall improvement in NAFLD & NASH by saroglitazar.
1. INTRODUCTION
Non‐alcoholic fatty liver disease (NAFLD) is a progressive liver disease characterized by significant hepatic lipid deposition (steatosis). It affects 33% of the general population and up to 70‐75% of diabetes and obese patients in Western countries.1, 2 According to the “multiple hit” hypothesis, the insulin resistance plays a central role, by causing increased free fatty acid (FFA) flux to the liver, resulting in hepatic steatosis and lipotoxicity.3, 4 The cross talk between dysfunctional adipocytes and liver involves combination of oxidative stress, inflammation, mitochondrial dysfunction and an imbalance of cytokines and adipokines, together with steatosis in development of lipotoxic liver disease, a term that more accurately describes the pathophysiology of non‐alcoholic steatohepatitis (NASH).4, 5 Reactive oxygen species, lipid peroxidation products and inflammation causes activation of hepatic stellate cells, leading to fibrosis and eventually cirrhosis and hepatocellular carcinoma.3, 6 The lipotoxic liver injury hypothesis4, 5 for the pathogenesis of NASH suggests that the ideal drug for NASH should reduce the burden of fatty acids going to the liver or being synthesized in the liver and this can be accomplished either by improving insulin sensitivity at the level of adipose tissue to prevent inappropriate peripheral lipolysis and/or by preventing unnecessary de novo lipogenesis in the liver.4
Peroxisome proliferator‐activated receptors (PPARs) are nuclear receptors that play key roles in the regulation of metabolic homoeostasis, inflammation, cellular growth and differentiation.7 The importance of dual PPARα and PPARγ agonists for the treatment of hypertriglyceridaemia and insulin resistance, respectively, is well established, but their role in the improvement of NAFLD/NASH remains unclear. In the liver, PPARα is expressed at high levels in hepatocytes and plays a major role in regulating fatty acid (FA) transport and β‐oxidation.8 PPARα also modulates inflammatory genes.9 A protective role for PPARα against liver steatosis and inflammation in NASH has been suggested based on increased susceptibility of PPARα‐knock out (KO) mice to NASH.8 PPARγ agonists are strong insulin sensitizers. They regulate glucose and lipid metabolism10 and have prominent anti‐inflammatory activity. They prevent hepatic fibrogenesis in the liver by inhibiting the activation of hepatic stellate cells, which plays a key role in early phase of liver fibrosis.11 Clinical studies with PPARγ in patients with NASH demonstrated improvements in insulin resistance and liver enzymes but showed variable effects on histological NASH features.12, 13
In the light of the established beneficial roles of PPARα and γ in NAFLD and NASH, it is hypothesized that combined effect of PPARα and PPARγ agonism may provide better management of the biological factors responsible for disease. Saroglitazar is a potent dual PPARα/γ agonist with EC50 of 0.65pM and 3 nM for PPARα and PPARγ activation respectively.14 Saroglitazar is a full agonist for PPARα and γ, but analysis of dose‐response curve indicated that at a concentration where it causes full PPARα activation, it may causes only partial PPARγ activation. Perhaps, because of this property, while showing desirable lipid‐lowering and insulin sensitivity effects, saroglitazar was devoid of typical PPARγ‐mediated side effects.14, 15 In the view of its interesting safety and efficacy profile, saroglitazar was evaluated in various in vitro and in vivo models of NAFLD and NASH.
2. MATERIALS AND METHODS
2.1. Chemicals
Saroglitazar (Figure S1), pioglitazone and fenofibrate were synthesized by Cadila Healthcare Limited, Ahmedabad, India.
2.2. Cell lines and treatments
HepG2 cells were maintained in DMEM supplemented with 10% FBS and 100 U/mL penicillin/streptomycin (Invitrogen Carlsbad, CA, USA). Human hepatic stellate LX2 cells were maintained in DMEM with 5% FBS. The cells were maintained at 37°C and 5% CO2. Palmitate (PA, Sigma‐Aldrich) was conjugated to BSA prior to use in serum‐starved cells. For coculture experiments, HepG2 and LX2 were plated on inserts (0.4‐μm pore size, Corning, USA) and on the bottom plate at a ratio of 5:1 respectively. The two different cell populations were cocultured for 72 hours and harvested for downstream experiments. Cells were treated with saroglitazar, fenofibrate, pioglitazone (all treated at 10 μM concentration) and PA (0.75 mM) for 16 hours.
RNA and protein were isolated using the methods described in Supplementary Material Annexure I. The primer pair sequences used for Real‐Time PCR Reactions for in vitro studies are listed in Table S1‐A. The relative gene expression of fibrosis markers was quantified by qPCR from the mRNA obtained from HepG2‐LX2 cells cocultured and 18S rRNA was used as housekeeping gene. Isolated proteins were subjected to immunoblotting with antibodies specific for anti‐pNFkB and total NFkB (Cell Signaling Technology; dilution 1:1000). Densitometric analysis of the bands was performed by ImageJ software.
For Mito stress assay and assessment of reactive oxygen species (ROS), HepG2 cells were plated at a density of 35,000 cells/well in XFe24‐well plates (Seahorse Biosciences). The oxygen consumption rate (OCR) was measured according to the manufacturer's protocol. Oligomycin (2M), FCCP (2M), rotenone (1M) and antimycin A (1M) were used as inhibitors of different mitochondrial respiratory complexes in all wells. For the assessment of ROS generation, HepG2 cells were stained with dichlorodihydrofluorescein diacetate (DCFDA) (5 M) followed by washing in PBS. The harvested cells were suspended in PBS for detection by flow cytometry (BD Biosciences).
For assessment of stellate cell activation, LX2 cells were fixed in 3.7% paraformaldehyde. After PBS washing, cells were stained with phalloidin (1:500) and subsequently stained with DAPI for 45 minutes followed by observation via a Olympus Fluoview Confocal microscopy (Tokyo, Japan).
2.3. Animal experiments
The choline‐deficient, L‐amino acid‐defined, high‐fat diet (CDAHFD) model mimics human NASH by sequentially producing steatohepatitis, liver fibrosis and liver cancer without body weight loss.16 Male C57BL/6 mice were housed in individually ventilated cages and maintained on a standard laboratory rodent diet, and were given CDAHFD (60 kcal% fat, Product #A06071302, from Research Diet, New Brunswick, NJ, USA, detail diet composition given in Table S4,) at 6 weeks of age for 20 weeks.
All animal experiment protocols were approved by Institutional Animal Ethics Committee of Zydus Research Centre. The efficacy of saroglitazar (3 mg/kg) was compared with a pure PPARα agonist, fenofibrate (100 mg/kg) and PPARγ agonist pioglitazone (30 mg/kg) and a vehicle control group (n = 9/gp). The treatment was initiated 8 weeks after initiation of the CDAHFD diet, when liver steatosis and inflammation were established, and fibrosis had begun to develop and treatment was continued for 12 week duration by oral gavage once daily.
To assess the antifibrotic effect of saroglitazar, fibrosis was induced in rats by twice weekly intraperitoneal carbon tetrachloride (CCl4) injections for 2 weeks before treatment and subsequent 4 weeks after treatment initiation. Saroglitazar (0.4 and 4 mg/kg), pioglitazone (10 mg/kg), fenofibrate (100 mg/kg) or vehicle (Tween 80 and 0.5% sodium salt of carboxymethylcellulose at ratio of 0.5:99.5) was orally administered (n = 8/gp).
The tissue distribution of saroglitazar was examined at Tmax and 24 hours post treatments in independent experiments performed in six male and six female Wistar rats after a single oral administration of saroglitazar (30 mg/kg). The levels of saroglitazar were estimated using LCMS‐based method. All interventions occurred during the light cycle and more details are described in Data S1.
2.4. Biochemical analysis
Serum alanine aminotransferase (ALT), aspartate aminotransferase (AST) and triglyceride (TG) levels were determined using commercial kits on a Cobas c311 autoanalyzer (Roche Diagnostics, Germany). The serum levels of monocyte chemoattractant protein1 (MCP1) were measured using a commercial Quantikine ELISA Kit supplied by R&D Systems, Inc., USA. Total liver lipids were extracted, and hepatic TG and total cholesterol (TC) content was quantified using triglyceride and total cholesterol test kits from Agappe Diagnostics, India. The liver TNFα, malondialdehyde (MDA) and collagen content levels were measured in tissue homogenates using BD OptEIA Mouse TNF ELISA kit (BD Biosciences, USA), QuantiChrom TBARS Assay Kit (BioAssays Systems Inc, USA) and total collagen assay kit (QuickZyme Biosciences, The Netherlands) respectively; more details are described in Data S1.
2.5. Histological assessment
Light microscopic examination of liver tissue was performed using standard hematoxylin and eosin (H&E) staining. Hepatic fibrosis was assessed using Masson's trichrome staining. Kupffer cells laden with lipid and/or glycogen droplets and resistant to diastase were visualized in liver with PAS‐diastase stain. Fat deposition was confirmed using Oil red O staining on freshly collected liver. Specimens were scored for the severity of hepatocellular steatosis, ballooning, inflammation and fibrosis according to the scoring method described by Kleiner et al17 and Brunt et al.18 Briefly, hepatocellular steatosis (grade 0: no fat; grade 1: steatosis occupying <33% of the hepatic parenchyma; grade 2: 34%‐66%; grade 3: more than 66%). Inflammatory cell infiltration (grade 0: none; grade 1: 1‐2 foci per 200× field; grade 2: 3‐4 foci per 200× field; grade 3: more than 4 foci per 200× field). Hepatocellular ballooning (grade 0: none; grade 1: few balloon cells; grade 2: many balloon cells). Staging of hepatic fibrosis (stage 0: none; stage 1: mild perisinusoidal or periportal; stage 2: moderate perisinusoidal or periportal; stage 3: bridging fibrosis; stage 4: cirrhosis). Histology analysis was performed by an experienced board certified pathologist (Diplomat of Indian Board of Toxicologic Pathology) and peer reviewed by a senior pathologist, a Diplomat of Indian College of Veterinary Pathologists.
Total NASH score was calculated by summation of all scores for the severity of hepatocellular steatosis, ballooning, inflammation and fibrosis by H&E staining for individual animals and then group mean ± SEM was calculated and effect of treatment was evaluated.
2.6. Gene expression analysis
The expression of various genes was measured using Quantitative PCR (qPCR). The primer pair sequences used for real‐time PCR reactions for in vivo studies are listed in Table S1‐B and detail of procedures followed up for RNA isolation, cDNA synthesis and Quantitative PCR (qPCR) are described in Data S1.
2.7. Statistical analysis
In vitro experiment was performed at least three times in duplicate and data were analysed by one‐way analysis of variance (ANOVA) followed by the post hoc test of Holm Sidak. # P < .05 and ## P < .001 indicates significant difference in comparison to control; *P < .05 and **P < .001 were considered significant in comparison to PA‐group. For in vivo studies also data were analysed by ANOVA followed by the post hoc test of Holm Sidak. # indicates significant difference in control diet (Normal control) group vs Disease control, *P < .05; **P < .01 indicates significant difference vs CDAHFD + Vehicle Control (disease control) in test compound. All data are mean ± SEM. All data analysis was performed using GraphPad Prism software (GraphPad La Jolla California USA).
3. RESULTS
3.1. Saroglitazar treatment improves hepatocyte cell viability and rectifies lipid‐mediated oxidative stress, inflammation and impaired mitochondrial biogenesis
HepG2 cells were treated with saroglitazar, fenofibrate, pioglitazone (10 μM) for 16 hours in the presence of PA. The PA caused decreased cellular viability which was significantly normalized by saroglitazar treatment but not with other drugs (Figure 1A). The PA‐mediated decreased expression of various antioxidant genes along with its transcription factor, NRF1, was restored by saroglitazar treatment (Figure 1B1‐B2). Furthermore, saroglitazar blocked PA‐mediated ROS generation as revealed by DCFDA staining (Figure 1C). Lipid‐induced oxidative stress was reflected by impaired mitochondrial biogenesis revealed by the expression of different genes involved in fission/fusion, the activation of phosphorylation of NFkB and the overexpression of inflammatory markers. These effects were blocked by saroglitazar treatment (Figure 1B3,D). PA‐induced mitochondrial fission led to reduced respiratory potential in mitochondria followed by reduced ATP production. Saroglitazar rescued the mitochondrial basal respiratory potential and improved the ATP production rate (Figure 1E‐F). Interestingly pioglitazone and fenofibrate also were found to prevent toxic effects of PA, but overall beneficial effects of saroglitazar on cell viability, mitochondrial biogenesis makers and anti‐inflammatory genes were significantly better than pioglitazone and was more largely comparable to fenofibrate.
Figure 1.
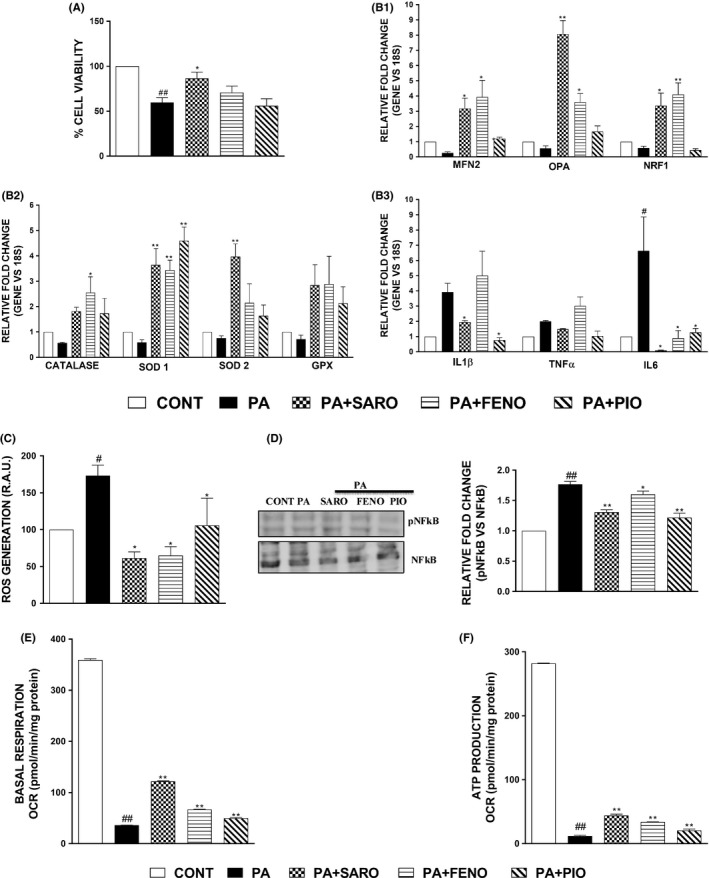
Lipid‐mediated oxidative stress, inflammation and impaired mitochondrial biogenesis can be rectified upon saroglitazar treatment. Results of cell viability in HepG2 cells treated with PA (0.75 mM) and various treatments for 16 h followed by MTT assay (A). The effect on mRNA levels of genes related to inflammation, mitochondrial biogenesis and antioxidants were measured using qPCR (B1, B2, B3). The cells were seeded into 60 mm dishes for flow cytometric analysis using the DCFDA dye specific for ROS generation (C). Immunoblotting was performed using phosphorylated and total NFkB and densitometric analysis was performed using ImageJ software (D). HepG2 cells were treated with PA (0.75 mM) and various treatments followed by measurement of oxygen consumption rate under basal respiratory conditions (E). The data were further used to calculate ATP production rate (F). Data are mean ± SEM. # P < .05 and ## P < .001 in comparison to control, *P < .05 and **P < .001 were considered significant in comparison to PA‐group. CAT, catalase; GPX, glutathione peroxidase; IL, Interleukin; MFN‐2, Mitofusin‐2; NFKB, nuclear factor kappa‐light‐chain‐enhancer of activated B cells; NRF‐1, Nuclear respiratory factor 1; OPA, optic atrophy; SOD1, superoxide dismutase 1; TNFα, tumour necrosis factor α
3.2. Saroglitazar prevents the activation of stellate cells by abrogating the release of inflammatory factors from PA‐treated hepatocytes
PA‐treated HepG2 cells (hepatocytes) were cocultured with LX2 (stellate cells), and the induction of gene expression of different fibrosis markers was measured by qPCR. PA‐mediated induction of fibrotic genes in stellate cells upon coculture with HepG2 cells was rescued upon saroglitazar and other drugs (Figure 2A). Saroglitazar abrogated the formation of stress fibres in activated stellate cells as assessed by actin cytoskeletal reorganization by phalloidin staining more effectively than other drugs (Figure 2B).
Figure 2.
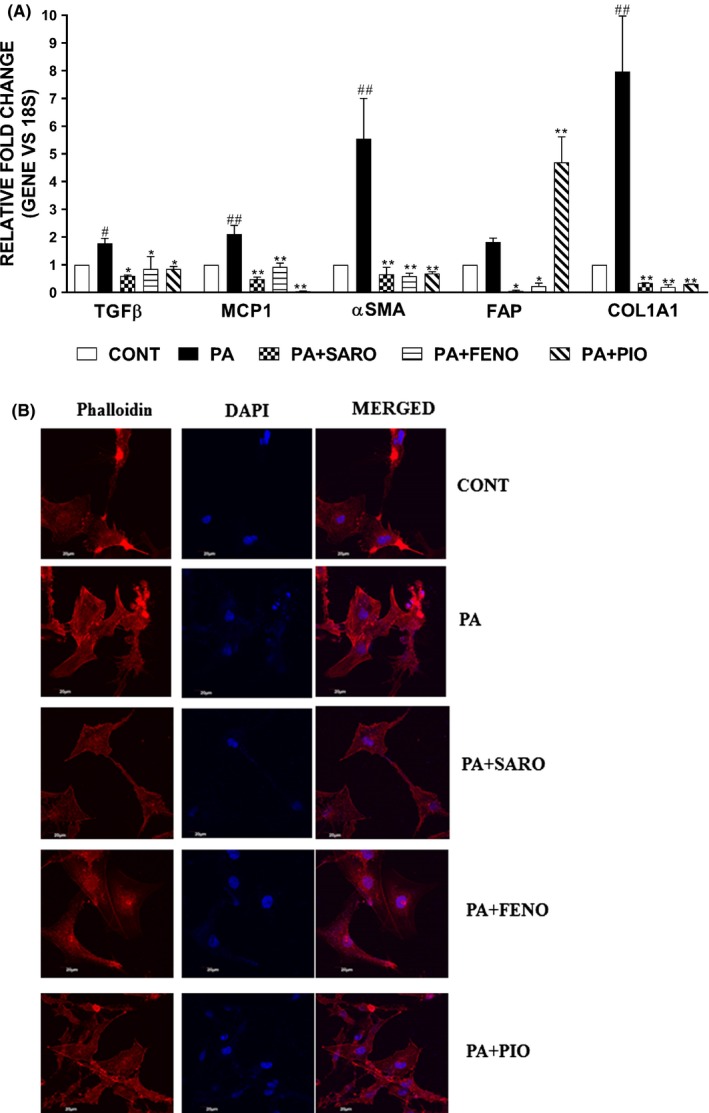
Saroglitazar prevents the activation of hepatic stellate cells induced by the release of soluble factors by PA‐treated hepatocytes. The relative gene expression of fibrosis markers was quantified by qPCR from the mRNA obtained from HepG2‐LX2 cells coculture experiment (A). Phalloidin staining was performed in LX2 cells to assess the reorganization of actin cytoskeletal fibres. The images were observed under confocal microscope (B). Scale bar: 20 μm. Data are mean ± SEM. # P < .05 and ## P < .001 in comparison to control, *P < .05 and **P < .001 were considered significant in comparison to PA‐group
3.3. Saroglitazar displays liver‐selective tissue distribution after oral administration
The tissue distribution of saroglitazar was determined in rats after a single oral administration. Blood and major organs were collected, and drug levels were measured. High concentrations of saroglitazar were measured in the liver at both the Tmax (0.67 hour) and 24‐hour time points (Table S2). At Tmax, the mean liver to plasma ratio was 4.40 for males and 4.99 for females. For the rest of the studied tissues, the ratio (tissue to plasma) was less than 1.0. The 24‐hour samples also revealed drug concentrations with the potential for sustained effects.
3.4. Saroglitazar reverses CDAHFD‐induced NASH in C57BL/6 mice
The C57BL/6 mice that were maintained on CDAHFD for 8 weeks were treated with Saroglitazar (3 mg/kg) or fenofibrate (100 mg/kg) or pioglitazone (30 mg/kg) or vehicle for the 12 following weeks. At the end of 20 weeks, the disease control animals that were fed only CDAHFD exhibited increases in serum ALT, AST and MCP1 levels of 8.7, 3.3 and 3.8‐fold, respectively, compared with those of animals fed a normal control diet (Table 1). These changes were accompanied by two‐ to three‐fold increases in intrahepatic lipid (TG, TC) levels and four‐fold increase in liver collagen content and two‐fold increase in liver malondialdehyde levels (Table 1). The microscopic examination of liver tissue demonstrated hepatocellular steatosis (grade 2‐3), hepatocyte ballooning (grade 1‐2), inflammation (grade 3) and mild‐to‐moderate (stage‐2‐3) perisinusoidal or periportal fibrosis (Figure 3A). These findings were confirmed by Oil red O staining (grade 3 steatosis, Figure 3B), Masson's trichrome staining (stage 1‐2 fibrosis, Figure 3C) and PAS‐diastase staining (grade 3 presence of Kupffer cells, Figure 3D) respectively.
Table 1.
Effect of Saroglitazar on Serum and Hepatic Biochemistry, Liver and Adipose tissue and Body Weights C57BL/6 Mice Following 12 wk of Treatment
| Parameters | Control diet for CDAHFD‐Vehicle | CDAHFD‐Vehicle Control | CDAHFD‐Saroglitazar (3 mg/kg, p.o.) | CDAHFD‐Pioglitazone (30 mg/kg, p.o.) | CDAHFD‐Fenofibrate (100 mg/kg, p.o.) |
|---|---|---|---|---|---|
| Serum | |||||
| Serum ALT (U/L) | 33.0 ± 8.6# | 287.6 ± 24.6 | 115.8 ± 18.2** | 202.9 ± 16.5** | 93.4 ± 7.8** |
| Serum AST (U/L) | 68.9 ± 8.7# | 230.7 ± 16.5 | 132.6 ± 14.4** | 230.0 ± 21.5 | 98.1 ± 7.2** |
| Serum MCP1(pg/mL) | 70.6 ± 6.8# | 273.2 ± 12.4 | 149.5 ± 13.1** | 189.6 ± 19.1** | 130.3 ± 8.0** |
| Serum TG (mg/dL) | 85.6 ± 7.0# | 60.2 ± 2.8 | 31.4 ± 4.2** | 66.0 ± 8.4 | 36.6 ± 3.9** |
| Liver | |||||
| Liver TG (mg/gm of tissue) | 32.4 ± 4.9# | 65.4 ± 9.0 | 13.7 ± 1.3** | 58.9 ± 11.0 | 59.3 ± 11.1 |
| Liver TC (mg/gm of tissue) | 5.0 ± 1.1# | 13.1 ± 2.3 | 2.9 ± 0 .8** | 8.2 ± 1.9 | 8.9 ± 1.6 |
| Liver total collagen (μg/gm of tissue) | 347.5 ± 32.7# | 1343.0 ± 118.8 | 787.0 ± 100.3** | 1105.7 ± 87.5 | 727.5 ± 67.9** |
| Liver MDA (μM/gm of tissue) | 42.7 ± 1.1# | 86.7 ± 8.6 | 26.5 ± 1.7** | 42.3 ± 3.4** | 28.4 ± 1.3** |
| Liver TNFα (pg/gm of tissue) | 37658.3 ± 2956.7# | 64589.8 ± 3214.0 | 41884.9 ± 4149.5* | 46563.0 ± 6074.4* | 54802.1 ± 7544.3 |
| Relative wt. of liver | 0.037 ± 0.005# | 0.060 ± 0.001 | 0.074 ± 0.002* | 0.051 ± 0.001 | 0.080 ± .007* |
| Relative wt. of epididymal fat | 0.016 ± 0.003# | 0.008 ± .0001 | 0.011 ± 0.001 | 0.011 ± 0.001 | 0.008 ± 0.001 |
| Body weight (gm) | 34.6 ± 0.8# | 25.1 ± 0.6 | 22.7 ± 0.5 | 25.4 ± 0.5 | 22.4 ± 1.2* |
In this study, NASH was produced by feeding a CDAHF diet for 8 wk followed by the administration of a CDAHF diet for an additional 12 wk together with saroglitazar (3 mg/kg), pioglitazone (30 mg/kg. p.o.), fenofibrate (100 mg/kg) or vehicle treatment. Values are expressed as the means ± SEM of serum levels of various NASH biomarkers (n = 9).
*P < .05; **P < .01 vs CDAHFD + Vehicle Control (disease control).
#indicates control diet (Normal control) significance vs Disease control, P < .05.
Figure 3.
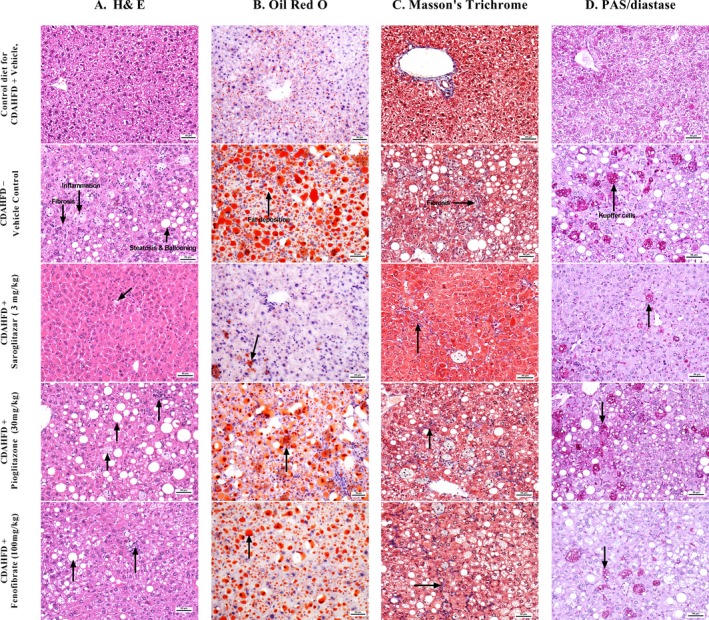
Effect of saroglitazar, fenofibrate and pioglitazone on liver histology in a CDAHFD‐induced NASH model. Representative liver sections e stained with hematoxylin‐eosin (A), Oil red O (B), Masson's trichrome (C) and PAS‐diastase (D)
The mice treated with saroglitazar (3 mg/kg) for 12 weeks after 8 weeks of CDAHFD feeding exhibited significant reductions in serum markers of liver damage and inflammation, serum ALT (60%), AST (43%) and MCP1 (45%) levels compared with those of the untreated (CDAHFD‐fed) disease control animals (Table 1). Liver lipid (TG) accumulation and collagen content were also significantly (79% and 41% respectively) attenuated by saroglitazar treatment (Table 1). Saroglitazar also showed the reduction in liver TNFα levels. Fenofibrate treatment (100 mg/kg) also showed reductions in serum ALT, AST and MCP1, liver collagen content and MDA levels but there was no effect on TNFα levels of liver, whereas pioglitazone treatment showed reductions in serum ALT, MCP1 levels and liver MDA and TNFα levels but there was no effect on collagen content of liver; however, the elevated liver lipids were not affected by either pioglitazone or fenofibrate treatment.
Saroglitazar has predominant PPARα activity, which explains the well‐known and rodent‐specific increase in liver weight observed in saroglitazar‐ and fenofibrate‐treated mice but not in pioglitazone‐treated animals. On the other hand, the epididymal fat mass increase, which is a PPARγ‐mediated effect, was observed in saroglitazar‐ and pioglitazone‐treated mice but not in fenofibrate‐treated animals.
Microscopic examination of the liver sections after H&E staining revealed that saroglitazar (3 mg/kg) induced reversal of hepatic steatosis, reduced or no vacuolation and ballooning and there was significant reduction in the severity of inflammation (Figure 3A). Special stains for fat (Oil Red O, Figure 3B), fibrosis (Masson's trichrome, Figure 3C) and Kupffer cell accumulation (PAS‐diastase, Figure 3D) also indicated that saroglitazar causes reversal of fat accumulation and significant reduction in inflammation as shown by reduction in the number of macrophages (Kupffer cells) in the liver and there was trend of reversal of fibrosis. Fenofibrate and pioglitazone treatment also showed significant reduction in inflammation but there was no effect on liver lipid accumulations and fibrosis scores. Overall saroglitazar showed 78% reduction in total NASH score, whereas pioglitazone and fenofibrate showed 22 and 54% reduction in total NASH scores respectively (Table 2).
Table 2.
Effect of 8 wk of Treatment with Saroglitazar on the Severity of Hepatic Steatosis, Ballooning, Inflammation and Fibrosis in CDAHF‐fed C57BL/6 Mice Maintained on this Diet for 8 wk Prior to the Initiation of Treatment
| Parameters | Control diet for CDAHFD‐Vehicle | CDAHFD‐Vehicle Control | CDAHFD‐Saroglitazar (3 mg/kg, p.o.) | CDAHFD‐Pioglitazone (30 mg/kg, p.o.) | CDAHFD‐Fenofibrate (100 mg/kg, p.o.) |
|---|---|---|---|---|---|
| Steatosis | 0.0 ± 0.0# | 2.6 ± 0.2 | 0.0 ± 0.0** | 2.1 ± 0.4 | 1.3 ± 0.3** |
| Ballooning | 0.0 ± 0.0# | 1.4 ± 0.2 | 0.0 ± 0.0** | 0.8 ± 0.3* | 0.1 ± 0.1** |
| Inflammation | 0.0 ± 0.0# | 3.0 ± 0.0 | 1.1 ± 0.1** | 2.3 ± 0.2** | 1.2 ± 0.1** |
| Fibrosis | 0.0 ± 0.0# | 1.0 ± 0.0 | 0.7 ± 0.2 | 1.0 ± 0.0 | 1.0 ± 0.0 |
| Masson's trichrome staining (CT) | 0.0 ± 0.0# | 1.2 ± 0.1 | 1.0 ± 0.0 | 1.1 ± 0.1 | 1.0 ± 0.0 |
| Diastase‐PAS (Kupffer cell proliferation) | 0.0 ± 0.0# | 3.0 ± 0.0 | 1.1 ± 0.1** | 2.3 ± 0.2** | 1.2 ± 0.1** |
| Oil Red O (Fat) | 0.3 ± 0.2# | 2.8 ± 0.4 | 0.8 ± 0.1** | 2.2 ± 0.3 | 3.0 ± 0.4 |
| Total NASH Score | 0.0 ± 0.0# | 8.0 ± 0.29 | 1.8 ± 0.2** | 6.2 ± 0.7** | 3.7 ± 0.5** |
Liver histology slides were scored following the method described by Kleiner et al 17 and Brunt et al18 as detailed in the Materials and Methods. Scoring for steatosis, ballooning, inflammation and fibrosis was performed after H&E staining. Liver fibrosis, fat accumulation and Kupffer cell proliferation were evaluated using Masson's Trichrome, Oil Red O and PAS‐Diastase staining respectively. Values are expressed as the means ± SEM of the histological evaluation scores (n = 9).
*P < .05; **P < .01 vs CDAHFD + Vehicle Control (Disease control) group.
#indicates control diet (Normal control) significance vs Disease control, P < .05.
The gene expression analysis revealed that CDAHFD up‐regulated the hepatic expression of pro‐inflammatory genes, such as TNFα, MCP1 and fibrogenic genes, such as COL1A1, MMP9, TIMP1 and αSMA (Figure 4). The overexpression of these pro‐inflammatory and fibrogenic genes was reversed by saroglitazar (3 mg/kg/d) treatment (Figure 4). Furthermore, the hepatic mRNA levels of connective tissue growth factor (CTFG), which promotes fibrosis by stimulating fibroblast proliferation and the expression of extracellular matrix components, was increased after CDAHFD feeding. Importantly, saroglitazar also caused reversal of CTGF mRNA levels (Figure 4). Fenofibrate also showed reversal of mRNA expression similar to saroglitazar but pioglitazone did not show any reversal in fibrogenic genes like COL1A1 and CTGF. Together, these results provide evidence that saroglitazar reverses CDAHFD‐induced NASH in mouse model.
Figure 4.
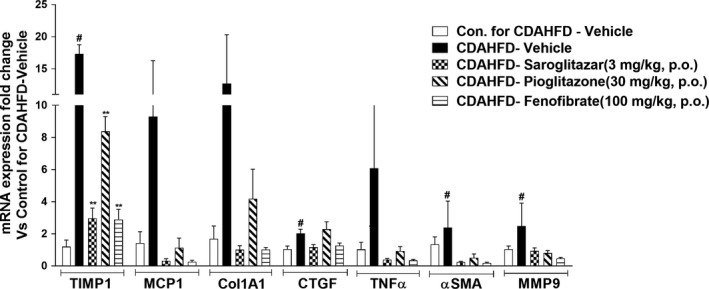
Effect of saroglitazar, fenofibrate and pioglitazone on hepatic mRNA levels in CDAHFD‐induced NASH model. Hepatic mRNA levels were determined using SYBR Green quantitative real‐time polymerase chain reaction and normalized to β‐actin mRNA expression. The data are expressed as the fold change vs the Control diet for CDAHFD‐Vehicle. Values are expressed as the means ± SEM (n = 6). # P < .05 vs control diet‐vehicle‐treated group, *P < .05 and **P < .01 vs CDAHFD vehicle‐treated group. Col1α1, collagen type I, alpha 1; CTGF, connective tissue growth factor; MCP‐1, monocyte chemotactic protein‐1; MMP9, matrix metallopeptidase 9; TIMP, tissue inhibitor of metalloproteinase; TNFα, tumour necrosis factor α; αSMA, alpha smooth muscle actin
3.5. Saroglitazar reverses CCl4‐induced liver fibrosis in Sprague‐Dawley rats
The haemotoxylin & Eosin and Masson's Trichrome‐stained liver tissues of saroglitazar‐treated animals (Figure 5) revealed that saroglitazar protected Sprague‐Dawley rats from CCl4‐induced fibrosis after 4 weeks of treatment and exhibited a dose‐dependent reversal of CCl4‐induced liver fibrosis (Table S3) (Figure 5), which was not shown by fenofibrate and pioglitazone treatment.
Figure 5.
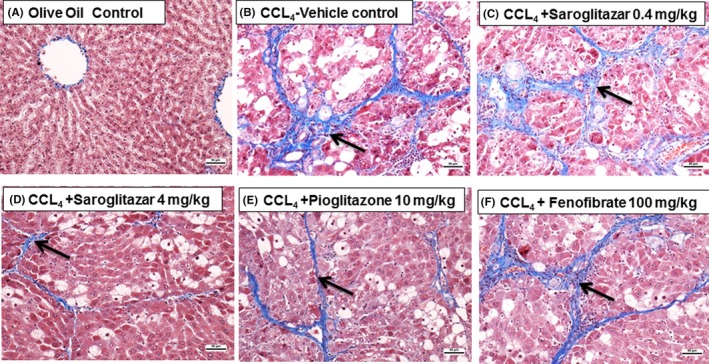
Effect of saroglitazar, pioglitazone and fenofibrate on CCl4‐induced liver fibrosis in Sprague‐Dawley rats as revealed by Masson's trichrome staining. The Masson's trichrome‐stained liver sections of animals treated with olive oil alone showed normal liver architecture (A). SD rats administered CCl4 for 6 wk exhibited grade 2‐3 fibrosis (B). Saroglitazar (4 mg/kg)‐treated animals revealed a complete reversal of fibrosis (D). Pioglitazone (10 mg/kg, E) and the lower dose of saroglitazar (0.4 mg/kg, C) exhibited a lesser degree of improved fibrosis. Fenofibrate at 100 mg/kg (F) was found to be ineffective. Arrow indicates the areas of fibrosis
4. DISCUSSION
Since NAFLD and NASH are multifaceted conditions, the ideal drug for managing these conditions is expected to display beneficial effects on insulin resistance, steatosis, inflammation, oxidative stress, mitochondrial dysfunction and fibrosis. Since, PPARα and PPARγ receptors are involved in regulation of all these attributes it is not surprising that saroglitazar, a dual PPAR agonist showed an overall improvement in NASH Score in CDAHFD‐induced NASH model and results are correlated with in vitro observations.
The major biochemical event in NAFLD is the accumulation of triglycerides in hepatocytes.6 PPARs are key regulators of lipid homoeostasis.5 PPARα expression in the liver is primarily observed in hepatocytes, where its activation is expected to prevent steatosis and steatohepatitis by inhibiting intrahepatic lipid and lipoperoxide accumulation.8, 9 On the other hand, PPARγ is predominantly observed in adipocytes, where its activation increases insulin sensitivity,19 and thereby decreasing FA flux to the liver.19 As revealed by Oil Red O staining and liver lipid levels, dual PPARα and PPARγ agonism by saroglitazar caused a very strong antisteatotic effect, which was reflected by disappearance of lipid droplets in liver tissue. This effect was not seen with fenofibrate, a PPARα agonist, or pioglitazone, a PPARγ agonist, treatment, indicating that both PPARα and PPARγ activation may be necessary for a strong antisteatotic effect of saroglitazar. A recent report revealed that saroglitazar caused a significant lowering of ingested lipids in the circulation accompanied by increased flux of lipids in adipocytes in Zucker fa/fa rats.20 In this study, fenofibrate was found to cause increased levels of ingested lipids, suggesting that saroglitazar differentially regulates lipid metabolism in insulin‐resistant Zucker fatty rats.
Several lines of evidence suggest that impaired mitochondrial function is a central abnormality responsible for the progression from simple steatosis to steatohepatitis in NAFLD.21 The results of in vitro study in HepG2 cells indicated that saroglitazar could recover the mitochondrial bioenergetics potential at both basal and stressed conditions and improved the ATP production rate. It is well known that excessive ROS generation can induce phosphorylation of NFkB, which in turn migrates to the nucleus to increase the transcription of pro‐inflammatory cytokines. These pro‐inflammatory cytokines in turn can activate hepatic stellate cells, causing the increased collagen deposition that initiates fibrogenesis.21 Saroglitazar treatment improved hepatocyte cell viability, rectified lipid‐mediated oxidative stress, reduced inflammation and prevented the activation of stellate cells by abrogating the release of inflammatory factors. Furthermore, in vitro results revealed that saroglitazar reduces the expression of pro‐inflammatory (TNFα, IL1β and IL6) and profibrogenic (MCP1, TGFβ, COL1A1 and αSMA) genes in HSC. As revealed by phalloidin staining, saroglitazar prevented the activation of HSC from quiescent to highly proliferative and fibrogenic cells. Anti‐inflammatory and antifibrotic effects of saroglitazar were also observed in the in vivo studies, where the levels of TNFα, MMP9, MCP1, TIMP1, COL1A1, CTFG and αSMA were significantly reduced. These changes were accompanied by improvements in histology scores in both the CDAHFD and CCl4 models. Importantly, the dual agonist saroglitazar demonstrated marked improvement in CDAHFD‐induced NAFLD/NASH and the effects are more pronounced as compared to a pure PPARα agonist, fenofibrate or pure PPARγ agonist pioglitazone.
In vitro studies revealed that saroglitazar, pioglitazone and fenofibrate also showed anti‐inflammatory and antifibrotic effect, however, in animal model saroglitazar showed significantly higher reduction in NASH score and reversal of fibrosis. In animal model, pioglitazone and fenofibrate treatments caused improvements in some of the biochemical parameters of NASH; there was no significant effect of these agents on steatosis. In the light of the absence of an overall benefit of either pioglitazone or fenofibrate, saroglitazar’ s efficacy in NAFLD/NASH could be because of a combination of PPARα‐ and PPARγ‐mediated actions. It is likely that saroglitazar, which has high distribution in liver, may cause strong liver‐mediated effects.
While PPARα agonists are known to play a key role in lipid homoeostasis, they also decrease the expression of fibrotic markers and reduce the number of stellate cells.9 Support for the involvement of PPARα in NASH comes from the demonstration of increased susceptibility of PPARα−/− mice to NASH.8 Furthermore, PPARα activation reduces inflammation10, 22 by several mechanisms that may contribute to saroglitazar‐induced recovery from steatohepatitis. Additional PPARγ‐mediated effects of saroglitazar on hepatic lipid accumulation and FA uptake potentially resulted in robust and significantly better effects on hepatic steatosis biomarkers compared to pioglitazone. PPARγ is expressed in macrophages, such as Kupffer cells, where it displays anti‐inflammatory effects.23
It is not surprising that pioglitazone and fenofibrate demonstrated only minimal improvements in NASH in our experiments because both PPARα and PPARγ modulate certain components of NASH pathophysiology. In contrast, saroglitazar improved all biomarkers as well as liver histology either because of combined PPARα‐ and PPARγ‐mediated effects or because of distinct regulation of transcription factors and target genes by unique engagement of PPAR co‐activators and corepressors.24 In the tissue distribution study, saroglitazar was found to be preferentially distributed in the liver, which may further explain the robust effect of saroglitazar on the liver. Our findings are also supported by telmisartan studies, an angiotensin receptor blocker which has shown a partial PPARγ activation and a PPARα agonistic activity in liver, improves non‐alcoholic steatohepatitis in medaka NASH model.25
Studies performed with marketed PPARα agonists have demonstrated inconsistent effects on NAFLD/NASH. The PPARα agonist gemfibrozil has a favourable effect on liver enzymes, but fenofibrate showed variable results in several clinical trials.26 The potential of PPARδ in NAFLD/NASH is also not clear. It is reported that adenovirus‐mediated hepatic PPARδ overexpression has been shown to activate de novo lipogenesis and subsequent lipid deposition.27 Similarly, the PPARδ agonist GW501516, enhanced the fibrotic response.28
Since saroglitazar showed overall beneficial effects in the management of NAFLD and NASH in this study, it is likely that dual PPARα/γ agonism may be required for the treatment of NASH. It has been reported that saroglitazar has shown significant decrease in ALT levels in subjects with NAFLD and biopsy‐proven NASH.29 This study provides evidence in favour of saroglitazar as a candidate molecule for the management of NAFLD/NASH as it was found to improve all of the components that are responsible for these conditions.
CONFLICT OF INTEREST
Authors, MRJ, SRG, BB, CT, AR, RR, SK, HP, PS and PRP are employees of Cadila Healthcare Limited, India. Authors SSR, EK and ND from Indian Institute of Chemical Biology and WW from NTU, Singapore have no conflicts of interest.
Supporting information
Jain MR, Giri SR, Bhoi B, et al. Dual PPARα/γ agonist saroglitazar improves liver histopathology and biochemistry in experimental NASH models. Liver Int. 2018;38:1084‐1094. https://doi.org/10.1111/liv.13634
Funding information
This work was financially supported by the Cadila Healthcare Limited, Ahmedabad, India
Handling Editor: Isabelle Leclercq
REFERENCES
- 1. Williamson RM, Price JF, Glancy S, et al. Prevalence of and risk factors for hepatic steatosis and nonalcoholic fatty liver disease in people with type 2 diabetes: the Edinburgh Type 2 Diabetes Study. Diabetes Care. 2011;34:1139‐1144. [DOI] [PMC free article] [PubMed] [Google Scholar]
- 2. Hazlehurst JM, Woods C, Marjot T, et al. Non‐alcoholic fatty liver disease and diabetes. Metabolism. 2016;65:1096‐1108. [DOI] [PMC free article] [PubMed] [Google Scholar]
- 3. Takaki A, Kawai D, Yamamoto K. Multiple hits, including oxidative stress, as pathogenesis and treatment target in non‐alcoholic steatohepatitis (NASH). Int J Mol Sci. 2013;14:20704‐20728. [DOI] [PMC free article] [PubMed] [Google Scholar]
- 4. Neuschwander‐Tetri BA. Hepatic Lipotoxicity and the Pathogenesis of Nonalcoholic Steatohepatitis: the Central Role of Nontriglyceride Fatty Acid Metabolites. Hepatology. 2010;52:774. [DOI] [PubMed] [Google Scholar]
- 5. Kusi K. Reviews in Basic and Clinical Gastroenterology and Hepatology. Gastroenterology. 2012;142:711‐725.22326434 [Google Scholar]
- 6. Nassir F, Ibdah JA. Role of Mitochondria in Nonalcoholic Fatty Liver Disease. Int J Mol Sci. 2014;15:8713‐8742. [DOI] [PMC free article] [PubMed] [Google Scholar]
- 7. Desvergne B, Wahli W. Peroxisome proliferator‐activated receptors: nuclear control of metabolism. Endocr Rev. 1999;20:649‐688. [DOI] [PubMed] [Google Scholar]
- 8. Montagner A, Polizzi A, Fouché E, et al. Liver PPARalpha is crucial for whole‐body fatty acid homeostasis and is protective against NAFLD. Gut. 2016;65:1202‐1214. [DOI] [PMC free article] [PubMed] [Google Scholar]
- 9. Pawlak M, Lefebvre P, Staels B. Molecular mechanism of PPARα action and its impact on lipid metabolism, inflammation and fibrosis in non‐alcoholic fatty liver disease. J Hepatol. 2015;62:J720‐J733. [DOI] [PubMed] [Google Scholar]
- 10. Ahmadian M, Suh JM, Hah N, et al. PPARγ signaling and metabolism: the good, the bad and the future. Nat Med. 2013;99:557‐566. [DOI] [PMC free article] [PubMed] [Google Scholar]
- 11. Galli A, Crabb DW, Ceni E, et al. Antidiabetic thiazolidinediones inhibit collagen synthesis and hepatic stellate cell activation in vivo and in vitro. Gastroenterology. 2002;122:1924‐1940. [DOI] [PubMed] [Google Scholar]
- 12. Ratziu V, Giral P, Jacqueminet S, et al. Rosiglitazone for nonalcoholic steatohepatitis: one‐year results of the randomized placebo‐controlled Fatty Liver Improvement with Rosiglitazone Therapy (FLIRT) Trial. Gastroenterology. 2008;135:100‐110. [DOI] [PubMed] [Google Scholar]
- 13. Ratziu V, Charlotte F, Bernhardt C, et al. Long‐term efficacy of rosiglitazone in nonalcoholic steatohepatitis:results of the fatty liver improvement by rosiglitazone therapy (FLIRT 2) extension trial. Hepatology. 2010;51:445‐453. [DOI] [PubMed] [Google Scholar]
- 14. Jain MR, Giri SR, Trivedi C, et al. Saroglitazar, a novel PPARα/γ agonist with predominant PPARα activity, shows lipid‐lowering and insulin‐sensitizing effects in preclinical models. Pharmacol Res Pers. 2015;3:1‐14. [DOI] [PMC free article] [PubMed] [Google Scholar]
- 15. Joshi SR. Saroglitazar for the treatment of dyslipidemia in diabetic patients. Expert Opin Pharmacother. 2015;16:597‐606. [DOI] [PubMed] [Google Scholar]
- 16. Matsumoto M, Hada N, Sakamaki Y, et al. An improved mouse model that rapidly develops fibrosis in non‐alcoholic steatohepatitis. Int J Exp Path. 2013;94:93‐103. [DOI] [PMC free article] [PubMed] [Google Scholar]
- 17. Kleiner DE, Brunt EM, Van Natta M, et al. Design and validation of a histological scoring system for nonalcoholic fatty liver disease. Hepatology. 2005;41:1313‐1321. [DOI] [PubMed] [Google Scholar]
- 18. Brunt EM, Janney CG, Di Bisceglie AM, Neuschwander‐Tetri BA, Bacon BR. Nonalcoholic steatohepatitis: a proposal for grading and staging the histological lesions. Am J Gastroenterol. 1999;24:2467‐2474. [DOI] [PubMed] [Google Scholar]
- 19. Frayn KN. Adipose tissue as a buffer for daily lipid flux. Diabetologia. 2002;45:1201‐1210. [DOI] [PubMed] [Google Scholar]
- 20. Elazzouny M, Qi N, Schmitt ML, et al. Effect of saroglitazar on fatty acid metabolism in zucker fa/fa rats. Diabetes. 2015;64:A306‐A307. [Google Scholar]
- 21. Wobser H, Dorn C, Weiss TS, et al. Lipid accumulation in hepatocytes induces fibrogenic activation of hepatic stellate cells. Cell Res. 2009;19:996‐1005. [DOI] [PubMed] [Google Scholar]
- 22. Ip E, Farrell GC, Robertson G, Hall P, Kirsch R, Leclercq I. Central role of PPAR‐α‐dependent hepatic lipid turnover in dietary steatohepatitis in mice. Hepatology. 2003;38:123‐132. [DOI] [PubMed] [Google Scholar]
- 23. Luo W, Xu Q, Wang Q, Wu H, Hua J. Effect of modulation of PPAR‐γ activity on Kupffer cells M1/M2 polarization in the development of non‐alcoholic fatty liver disease. Sci Rep. 2017;7:44612. [DOI] [PMC free article] [PubMed] [Google Scholar]
- 24. Jones D. Potential remains for PPAR‐targeted drugs. Nat Rev Drug Discov. 2010;9:668‐669. [DOI] [PubMed] [Google Scholar]
- 25. Kuwashiro S, Terai S, Oishi T, et al. Telmisartan improves nonalcoholic steatohepatitis in medaka (Oryzias latipes) by reducing macrophage infiltration and fat accumulation. Cell Tissue Res. 2011;344:125‐134. [DOI] [PMC free article] [PubMed] [Google Scholar]
- 26. Charbonnel B. PPAR‐α and PPAR‐γ agonists for type 2 diabetes. Lancet. 2009;374:96‐97. [DOI] [PubMed] [Google Scholar]
- 27. Liu S, Hatano B, Zhao M, et al. Role of peroxisome proliferator‐activated receptor delta}/{beta in hepatic metabolic regulation. J Biol Chem. 2011;286:1237‐1247. [DOI] [PMC free article] [PubMed] [Google Scholar]
- 28. Kostadinova R, Montagner A, Gouranton E, et al. GW501516‐activated PPARβ/δ promotes liver fibrosis via p38‐JNK MAPK‐induced hepatic stellate cell proliferation. Cell Biosci. 2012;2:34. [DOI] [PMC free article] [PubMed] [Google Scholar]
- 29. Oseini AM, Sanyal AJ. Therapies in non‐alcoholicsteatohepatitis (NASH). Liv Int. 2017;37(Suppl. 1):97‐103. [DOI] [PMC free article] [PubMed] [Google Scholar]
Associated Data
This section collects any data citations, data availability statements, or supplementary materials included in this article.
Supplementary Materials