

Abstract
The number of small proteins (SPs) encoded in the Escherichia coli genome is unknown, as current bioinformatics and biochemical techniques make short gene and small protein identification challenging. One method of small protein identification involves adding an epitope tag to the 3′ end of a short open reading frame (sORF) on the chromosome, with synthesis confirmed by immunoblot assays. In this study, this strategy was used to identify new E. coli small proteins, tagging 80 sORFs in the E. coli genome, and assayed for protein synthesis. The selected sORFs represent diverse sequence characteristics, including degrees of sORF conservation, predicted transmembrane domains, sORF direction with respect to flanking genes, ribosome binding site (RBS) prediction, and ribosome profiling results. Of 80 sORFs, 36 resulted in encoded synthesized proteins—a 45% success rate. Modeling of detected versus non‐detected small proteins analysis showed predictions based on RBS prediction, transcription data, and ribosome profiling had statistically‐significant correlation with protein synthesis; however, there was no correlation between current sORF annotation and protein synthesis. These results suggest substantial numbers of small proteins remain undiscovered in E. coli, and existing bioinformatics techniques must continue to improve to facilitate identification.
Keywords: small proteins, SPA‐tagging
1. Introduction
Small proteins (SPs), defined in this study as those containing 75 or fewer amino acids and encoded in a short open reading frame (sORF), are challenging to identify. Short genes are difficult to reliably identify using traditional bioinformatics due to both the lack of sequence information that can be used for conservation analysis and the sheer number of potential sORFs present in genomes.1 In addition, common biochemical techniques used for protein identification, such as mass spectroscopy and gel electrophoresis, can be difficult to use for SPs that are too small to resolve on acrylamide gels or have limited fragmentation after protein hydrolysis.2 Due to these and other technical challenges inherent in SP identification, the number of SPs encoded in a genome is not known for any organism.
There is increasing evidence, however, that SPs play important roles in cell biology. In prokaryotes, SPs have been found to be involved in regulating cell development,3, 4 cell division,5, 6, 7 regulating transporter function,8, 9 and serving as essential components of membrane‐bound protein complexes.10, 11 In eukaryotes, short ORF‐encoded SPs have been found to play roles in regulating heart muscle contraction,12 leg development,13 and cell‐to‐cell communication.14 Altogether, it is clear that SPs represent an important area of proteomics that remains to be fully elucidated.
Given these discoveries, there is growing interest in developing robust, accurate methods for identifying new SPs.15, 16, 17 In 2008, we published a paper describing the identification of 18 new SPs in the bacteria Escherichia coli.18 sORFs were identified using an information theory–based approach,19 and then testing for synthesis of the SP. A number of studies have since been published that further increase the SP proteome. They have focused on developing improved bioinformatic prediction methods for identifying true short genes,20, 21, 22, 23 as well as developing proteomic assays with increased sensitivity that can identify SPs.16, 24 In recent years, the genomic technique of ribosome profiling has been found to be effective in identifying short genes that are transcribed and then bound by ribosomes.25, 26, 27, 28 Information on SPs identified by ribosomal profiling can be found at http://www.sORFs.org, a database of predicted, identified, and characterized SPs.29
Significance Statement
The a priori identification of short genes using bioinformatics continues to be a challenge. We tested 80 short open reading frames (sORF) that could encode a protein of 75 or fewer amino acids in the bacterium Escherichia coli, and detected synthesis of 36 small proteins. Considering that we were testing sORFs with a range of characteristics, a 45% success rate is surprisingly high. In addition, analysis of this data set shows little correlation between protein synthesis and sORF annotation, conservation, and biochemical properties of the predicted protein. Altogether, these data show that there may be many more small proteins synthesized in E. coli that remain to be discovered, but predicting them using bioinformatics will continue to be a challenge.
Altogether, it is clear that we are making progress in developing tools capable of accurately identifying short genes and SPs, and also that more work remains to be done. One study examining the essentiality of genes in Mycoplasma found evidence that prokaryotic genomes may be enriched in essential SPs.30 Other studies have also yielded data suggesting that there are hundreds to thousands of SPs encoded in both prokaryotic and eukaryotic genomes.31, 32 Even in E. coli, one of the best studied model organisms, there is evidence that more SPs remain to be identified. In our original study, we identified over 2000 sORFs encoded downstream of a potential ribosome binding site (RBS).18 Although it is unlikely that all of these are short genes, even if 10% of them encode SPs, this would increase the E. coli proteome by more than 200 proteins. In addition, in the many sequenced E. coli genomes, there are a large number of other sORFs annotated as “predicted,” “hypothetical,” and “putative” genes. It is unknown how many of these annotated genes encode proteins, thus making short gene curation an important addition to the challenge of SP identification.
In this report, we describe the testing of 80 sORFs for protein synthesis, and the identification of 36 new SPs in E. coli. Analysis of detected and undetected SPs shows correlation of SP detection with RBS prediction and ribosome profiling data. In contrast, we observe little correlation with sORF conservation and other genomic and biochemical characteristics. There is also little correlation between SP detection and the annotation state of the sORF. These results show that E. coli likely contains many more SPs, and that RBS evaluation and ribosome profiling data will be useful for their accurate identification.
2. Experimental Section
Construction of the SPA‐tagged strains: Sequence peptide affinity (SPA)‐tagged strains were constructed as described previously.18 After strain construction, the DNA sequence of the sORF and SPA tag sequences of all strains were confirmed by sequencing.
Immunoblot Assays: Immunoblot assays to determine SP expression were conducted as described previously with minor modification.18 Except where noted, all strains used in these experiments were grown aerobically in LB media at 37°C. In addition, membranes blotted with whole cell extracts were probed with anti‐3xFLAG M2‐HRP monoclonal antibody (Sigma‐Aldrich), and signals were visualized using the SuperSignal West Pico chemiluminescent substrate (Thermo Fisher). All data shown was reproduced in multiple immunoblot experiments. Equal loading of lanes in the gel was confirmed by examining the relative intensity of background bands in the test samples as compared to the untagged, wild‐type control samples. An example immunoblot showing unique SP bands and equal levels of background bands is shown in File 8, Supporting Information.
Bioinformatic Analysis of the sORFs and SPs: Information on gene sequences, gene orientation, and proximal promoters were obtained from EcoCyc.33 RBS values for sORFs were obtained from a previous sORF identification study.18 The presence of transmembrane domains in predicted SPs were identified using the program TMHMM.34 Conservation of the sORF was determined using the NCBI tblastn program similar to what has been described.35
Ribo‐seq and mRNA‐seq data from the Genome Wide Information on Protein Synthesis (GWIPS, http://gwips.ucc.ie/ 36) database were used to characterize coverage of the sORFs. The coverage data for E. coli K12 originated from an aggregate of published studies.36 The GWIPS “global” genome browser tracks provide the total coverage across all experiments from each publication. The analysis tested whether the depth of coverage at a gene of interest is significantly higher than the background level of coverage. Background levels were estimated from the coverage values at nucleotide positions that are at least 60 bp away from annotated functional sequences in the E. coli K12 genome (based on annotation of GenBank accession NC_000913). These background nucleotide positions were randomized and partitioned into chunks of l nucleotides, where l is the length of the gene of interest.37 For each of these chunks (i.e., randomization replicates), the RPKM value was estimated (File 2, Supporting Information), and the 95% confidence interval for the RPKM was estimated across replicates. When the RPKM of the gene of interest was higher than the background 95% CI, the gene was coded as “pass” or “1,” and if it fell inside or below the 95% CI, it was coded as “fail” or “0.” This process was carried out for the ribosome elongation, ribo‐seq coverage, and mRNA‐seq coverage data sets from GWIPS.
Statistical Analyses: A Fisher's exact test analysis of independence was used as one test for correlation between bioinformatic characteristics of the sORFs tested and the detection of SP synthesis. The Fisher's exact test calculator (http://www.socscistatistics.com/tests/fisher/Default2.aspx) was used for this analysis. In order to perform a Fisher's exact test on RBS bits, a ranged variable, these values were binned into two groups. For RBS bits, values of ten or more were grouped together, with those of less than ten being grouped. For conservation determination, sORFs were considered “conserved” if they were found in at least three genera outside of Escherichia and Shigella.
As a second method of determining what factors might predict the presence of SPs, we used logistic regression with a model‐fitting and averaging approach. The presence/absence of the SP was treated as a binomial, dependent factor. A global general linear model was constructed with RBS, presence of at least one flanking region, presence of a transmembrane protein, whether the sequence is annotated, its direction and if it is conserved as potential predictors. For RBS, although this can be treated as a continuous trait, we treat it as a categorical splitting them into regions with more than ten and regions with less than ten (results are similar when RBS is treated as a continuous trait, not shown). We then used a model selection approach, using the “dredge” function in the MuMIn package for R,38 based on the global model. This method sequentially adds and removes predictor variables and calculates the Akaike information criterion for small sample sizes (AICc) for each model.39 This approach allowed us to determine the best‐fit model, and assess which predictors may be important in the presence of SP detection. Best‐fit models were considered if their AICc was less than two, that is, models whose AICc did not differ by more than two compared to the model with the lowest AICc.39 Because this approach produced several top fit models, we then used a model‐averaging approach to determine if a predictor had a significant affect on the detection of SPs. Therefore, the parameters and subsequent p‐values for each predictor is an average among the top fitting models. This was done using the model.avg function in the MuMIn package for R.38 We also include the proportion of models each predictor is in, which also demonstrates its importance in the detection of SPs. Last, we obtained the predicted probabilities of detecting SPs based on the model averaged coefficients and plot the predicted probabilities against any potential predictors.
3. Results and Discussion
3.1. Selecting Short ORFs to Test for Protein Synthesis
In our previous study, over 2000 sORFs were identified in the genome that are encoded downstream of a sequence that has the potential to function as an RBS. To identify new SPs, candidate sORFs were selected based on sORF and protein characteristics that have been suggested to have predictive value when identifying true short genes. These characteristics include the orientation of the sORF compared to flanking genes, the level of sORF conservation throughout related species of bacteria, and the presence of a potential transmembrane or other protein domain in the predicted translation product. To evaluate different factors for their efficacy in predicting true short genes, we also selected sORFs that showed no conservation outside of E. coli and closely related bacteria, did not have a predicted transmembrane or other protein domain, and had relatively low RBS values. In total, 80 sORFs were selected for testing for protein synthesis (Figure 1A and File 3, Supporting Information).
Figure 1.
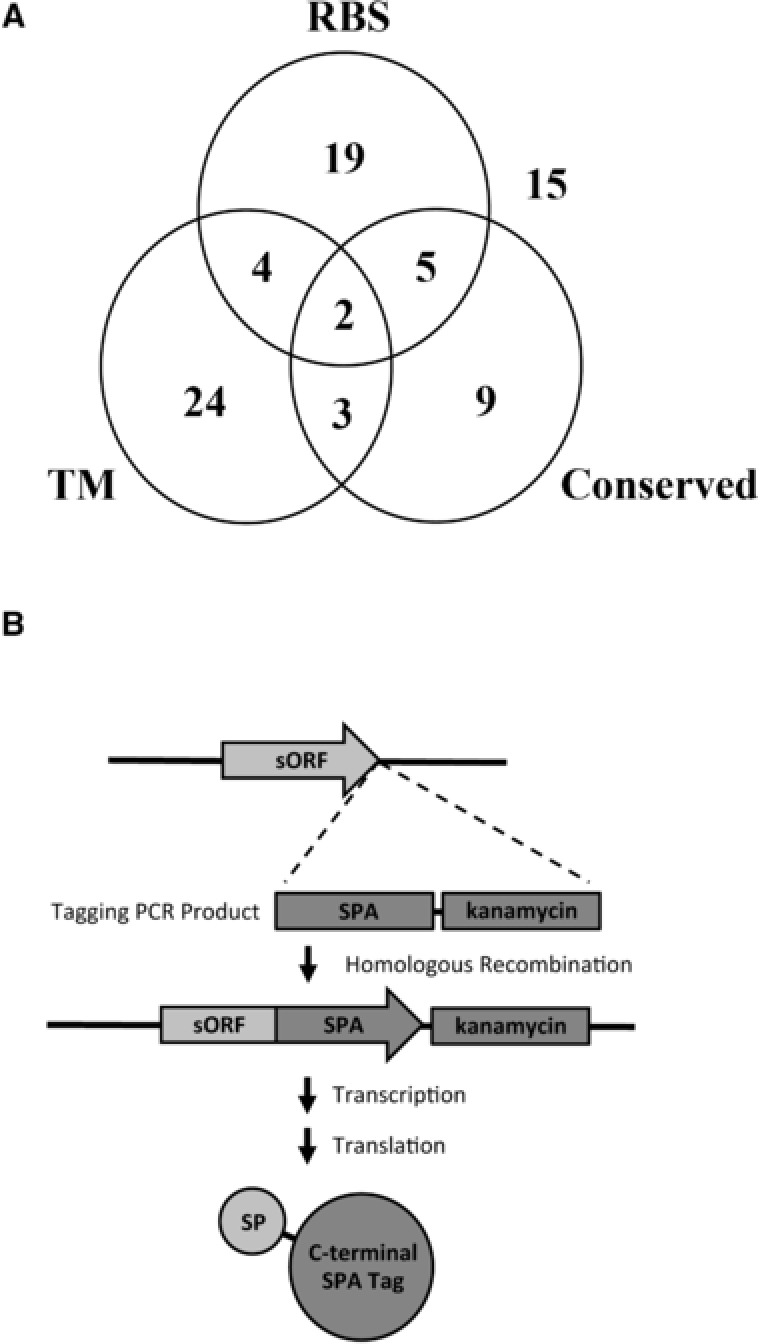
Testing sORFs for SP synthesis. A) sORFs selected for experimentation grouped according to bioinformatic characteristics. The numbers represent the sORFs selected with an RBS bits of >10 (“RBS”), conservation in at least three genera outside Escherichia and Shigella (“Conserved”), and/or a predicted transmembrane domain in the putative protein (“TM”). B) Strategy used to SPA‐tag sORFs for detection of SP synthesis. A PCR product containing the SPA tag and a kanamycin resistance cassette was amplified with flanking DNA homologous to the sORF and its downstream region. The PCR product was transformed into a recombinase‐positive strain, and recombinants were identified by kanamycin resistance and PCR screening using primers flanking the sORF. Sequencing of the sORF and the tag was performed to confirm that the SPA tag was inserted at the 3′ end of the sORF immediately upstream of the stop codon. SPs were detected by immunoblot analysis using an antibody that recognizes the C‐terminal SPA tag introduced at the 3′ end of the sORF.
3.2. Identifying New SPs
To determine if a sORF encoded a synthesized protein, homologous recombination was used to insert an SPA epitope tag at the 3′ end of each sORF on the chromosome (Figure 1B). Presence of a novel band in the SPA‐tagged strand as compared to a wild‐type control sample was considered evidence of SP synthesis. We tested for protein synthesis in cultures grown in rich media, and harvested samples during exponential and stationary phases of growth. Of the 80 sORFs tested, unique bands were detected for 36 of the strains containing an SPA‐tagged sORF, consistent with transcription of the sORF and translation of the SP (Figure 2). All experiments and immunoblots were conducted multiple times to ensure reproducibility of the results. Of the detected proteins, seven showed increased levels in exponential phase than stationary phase, 17 showed higher protein abundance in stationary phase, and 12 showed relatively similar levels of protein abundance in exponential and stationary phase cultures (Figure 2A–D). All growth phase–dependent changes in SP protein abundance were detected in multiple experiments. Seven of these SPs were observed at low levels in all experiments (Figure 2D). Although these proteins are present at low levels in cells grown in rich media, it is possible that they could be expressed at higher levels under different growth conditions. Consistent with this possibility, one protein, YnfR, is encoded by a sORF adjacent to a known cold‐shock protein (File 3, Supporting Information), and although very low levels of the SP was detected under normal conditions, abundance of YnfR‐SPA strongly increased after cold shock, suggesting that this protein is also under similar cold shock‐induced regulation (Figure 2E). In contrast to those that were detected, 44 of the sORFs tested showed no detectable levels of SPA‐tagged protein under exponential or stationary phase growth in rich media (File 1, Supporting Information), suggesting that these sORFs are either not translated during exponential and stationary phase growth in rich media, or that they are present at levels too low to be detected using our methods.
Figure 2.
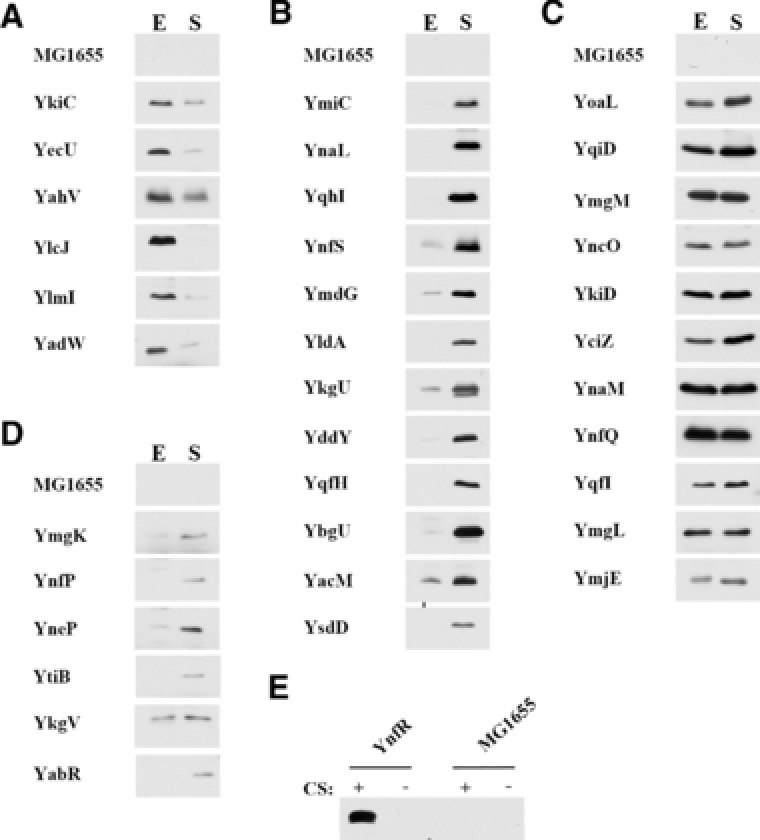
SPs detected in cells grown in rich media. Immunoblot analysis using anti‐3xFLAG, horseradish peroxidase‐conjugated antibodies was performed with whole‐cell extracts from MG1655 cultures. A) Cultures were grown to Exponential (E) and Stationary (S) phases in LB media. MG1655 control samples were run in each blot, with representative MG1655 lanes shown. Bands shown for the SPA‐tagged sORF strains are unique bands that were not observed in the control lanes. B) sORF strains where the novel SPA‐tagged band resolves close to cross‐reacting bands seen in the control lanes. SPA‐tagged SP bands are labeled with a (*). C) Evidence of the yrbN_PAIR_0 SP accumulating to detectable levels in cold‐shocked cultures. In all cases, a fraction equivalent to the cells in OD600 = 0.057 was loaded in each lane. Exposure times were optimized for each panel for visualization, thus band intensities in different blots do not reflect relative abundance of each SP.
We were interested in comparing our results to other recent E. coli proteogenomic screens. We found that 13 of the SPs identified in our study (YadW, YbgU, YciZ, YliM, YmdG, YmiC, YmjE, YnaL, YnaM, YnfQ, YnfS, YqfI, and YqiD) were present as unidentified positives in a tetracycline‐inhibited ribosome profiling–based screen of the E. coli genome.26 Interestingly, most of these SPs were present at high levels in our experiments, consistent with the likelihood that they would be translated frequently and give significant results in a ribosome‐profiling experiment. In contrast, a recent mass spectroscopy‐based proteomic analysis of E. coli yielded no peptide fragments corresponding to any of the SPs identified in our study.40 Together, these results suggest that directly measuring for protein synthesis using immunoblot assays is still one of the most sensitive methods for identifying new SPs.
The SPs detected in this study range in genomic and biochemical characteristics. Of the detected SPs, 13 are predicted to encode transmembrane domains, consistent with previous evidence that transmembrane SPs may be an important subset of the SP proteome. Eleven are conserved in species outside of E. coli and closely related species (File 2, Supporting Information), consistent with the possibility that they have import functions in the cell that would be conserved over time. Ten of the detected SPs are encoded by sORFs overlapping a known gene, and in total at least 12 may be encoded in operons (File 3, Supporting Information) including yliM, adjacent to the well‐studied ompX gene, ymjE, located immediately upstream of the putrescine catabolic gene puuP, and ynaL, located adjacent to the DEAD‐box helicase‐encoding dbp A. Since bacteria often encode genes of similar function within operons, it is possible that these SPs may have a function related to the function of the adjacent genes. Finally, two of the SPs returned a significant match to known protein domains using the NCBI Web Cd‐Search Tool (http://www.ncbi.nlm.nih.gov/Structure/bwrpsb/bwrpsb.cgi). YkgV returned a significant match to the DNA‐binding helix‐turn‐helix domain HTH_17 (pfam12728), and YqhI gave a significant match to the glycosyltransferase_GTB_type domain (cl10013). It will be interesting to see if these domain similarities reflect the function of each of the two small proteins.
With a 46% success rate, the level of SP identification for this study was unexpectedly high. Considering that we tried to select sORFs with a range of bioinformatic characteristics, together with the fact that there are over 2000 sORFs in the pool that these sORFs were selected from, this suggests that there may be hundreds of SPs expressed in E. coli that are yet to be discovered.
3.3. Correlating Bioinformatic and Experimental Results with SP Detection
A priori identification of true short genes out of the very large number of sORFs in a genome remains a significant challenge; however, as more screens for SPs are conducted, both positive and negative protein identification can be used to improve our bioinformatic screening techniques. With this goal in mind, we evaluated the distribution of sORF and SP characteristics between detected and undetected SPs from this study to determine if any properties show correlation with SP synthesis. Genomic properties included the overall genomic orientation of the sORF, its orientation relative to flanking genes, and the strength of the predicted RBS. Conservation of the sORF outside of E. coli and closely related bacteria was also evaluated, as was the prediction that a sORF would encode a transmembrane SP. Altogether, five genomic and biochemical properties were compared to SP detection. In addition to these characteristics, we also evaluated the potential correlation between SP detection and the aggregated results of published E. coli genome‐wide transcription and ribosome‐binding experiments.36 The data sets were accessed through the GWIPS database (gwips.ucc.ie), and represent the results of more than 30 individual studies. Given that these are publicly available data, and are from studies not originally designed to identify SPs, we were interested in evaluating their efficacy for predicting the SPs identified in our study. The results of three experimental sets of data, RNAseq, ribosome profiling of intiating ribosomes, and ribosome profiling of elongating ribosomes, were analyzed for correlation with SP detection.
A Fisher's exact test looking for independent correlation between SP detection and each of these characteristics showed significance for only one bioinformatic measurement: whether or not a sORF has an RBS value of ten or greater (Fisher's exact test statistic 0.004942, significant at p < 0.01). Unexpectedly, no significant correlation existed in our data between SP detection and the presence of a predicted transmembrane domain in the putative SP (Fisher's exact test statistic 0.323157, not significant at p < 0.05), or whether or not the sORF was conserved beyond E. coli and related species (Fisher's exact test statistic 0.290902, not significant at p < 0.05), both of which we had predicted in our previous paper, may be important methods for screening for new SPs.18 In contrast, all three of the experimental methods showed significant correlation between predicted short genes and detection of SPs (data not shown), consistent with their use in past studies to identify new SPs.23, 25, 26
As a more comprehensive method to determine what factors might best predict true short genes, we also used logistic regression with a model‐fitting and averaging approach to look at the same factors in relation to SP detection. This approach allowed us to determine the best‐fit model, and assess which predictors may be important in the presence of SP detection. Because this approach produced several top fit models, we then used a model‐averaging approach to determine if a predictor had a significant effect on the detection of SPs. Therefore, the parameters and subsequent p‐values for each predictor is an average across the top fitting models. We also include the proportion of models each predictor is in, which also demonstrates its importance in the detection of SPs. Last, we obtained the predicted probabilities of detecting SPs based on the model averaged coefficients and plot the predicted probabilities against any potential predictors (Figure 3). Of the factors included in this analysis, the RBS value for the sORF was the only characteristic that had a significant role in determining if an SP was translated (Table 2). It was present in all 12 of the top models found to explain our results (File 6, Supporting Information). However, the second most important factor was Elongation.Pass, or the detection of elongating ribosomes using the RiboSeq technique (File 2, Supporting Information). This factor was present in the four top models, suggesting that it also has a role in determining if a sORF encodes a detectable protein. Altogether, both the Fisher's exact test and the model‐fitting approach agree that RBS value is a valuable characteristic for predicting SPs, with ribosome profiling also being a useful predictive method.
Figure 3.
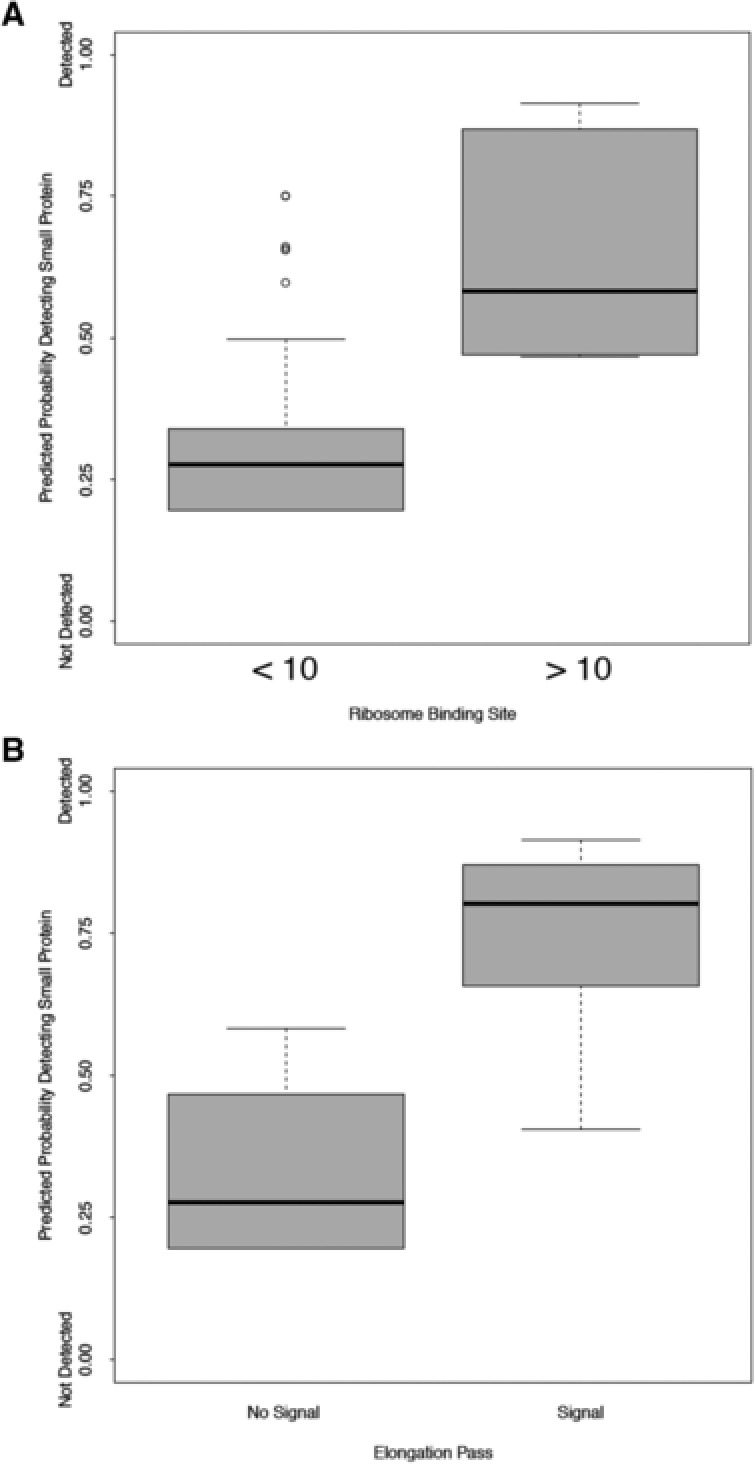
Correlation of ribosome binding site (RBS) model and ribosome profiling data with SP synthesis. A) Predicted probability of detecting an SP based on RBS data. The x‐axis is divided into those sORFs with an RBS bits of less than 10 (“<10”) and greater than 10 (“>10”). B) Predicted probability of detecting an SP based on ribosome profiling results. The x‐axis is dividing into those sORFs with a positive evaluation for ribosome binding compared to flanking genes (“+”) and those with a negative evaluation for ribosome binding compared to flanking genes (“−”). Evaluations of ribosome binding compared to flanking genes were performed as described in Materials and Methods. The y‐axis of both graphs shows the relative predicted probability of detecting an SP encoded in a given sORF, with 0.0 being 0%, up to 1.00, being 100%.
Table 2.
Model averaged trait estimates for factors associated with correct short gene predication
| Predictor | Estimate | z‐Value | p‐Value | Importance |
|---|---|---|---|---|
| Intercept | −0.9675 | 2.207 | 0.0273 | — |
| RBS | 1.2930 | 2.293 | 0.0218 | 1.00 |
| Elongation Pass | 1.5716 | 2.129 | 0.0333 | 0.63 |
| Direction | −0.8109 | 1.491 | 0.1360 | 0.57 |
| mRNA Pass | 1.3294 | 1.647 | 0.0996 | 0.51 |
| Cover Pass | 1.3115 | 1.459 | 0.1445 | 0.30 |
| Conserved | 0.3417 | 0.552 | 0.5811 | 0.05 |
Model averaged trait estimates and significance based only on models that included the predictor from the above table. Importance is the proportion of top models (AICc Δ < 2) that contain the predictor. Predictors in bold have a significant effect on the detection of small proteins.
3.4. The State of sORF Annotation
The challenges inherent in accurately identifying short genes, combined with the paucity of information known about how many SPs are encoded in any genome, make accurate annotation of short genes a challenge.1 Initial genome annotation efforts often excluded sORFs,41 ultimately underestimating the number of SPs encoded in a genome. In contrast, current gene annotation efforts are often partially regressive, relying on gene annotations from past genomes to identify genes in any newly‐sequenced genome. Thus, annotation of a sORF as a “hypothetical gene” in one genome will often result in the same gene annotation in newly sequenced genomes. Ultimately, this annotation method, combined with the difficulty in reliably identifying true short genes in the first place, may act to inflate the number of short genes annotated in a genome.
Although our study focused only on SPs expressed in rich media, we were interested in comparing our experimental results with the annotation state of the sORFs tested in this study. To do this, for each sORF we searched for an annotated gene corresponding to the DNA sequence in the E. coli MG1655 K12 genome, the genomes of other E. coli strains, and those of closely related bacteria, such as Shigella. We found that 68 of the sORFs tested in this study had been annotated in at least one genome (Table 1). In almost all cases, the sORFs were annotated as “hypothetical proteins,” “predicted protein,” or “computational prediction”. In two cases, the sORFs were annotated as an expressed protein. Of those 68 sORFs that were annotated, 32 (47%) were detected in our study, whereas 36 (52%) were not. The essentially equal distribution of annotation between detected and undetected SPs suggests that there is little correlation between annotation and SP detection in our experiments. Statistical analysis of the relationship between SP detection and sORF annotation confirmed the lack of correlation between these factors (Table 2). Although it is impossible to eliminate the possibility that SPs that we did not detect are expressed under specific conditions, overall these data suggest that short gene annotation in E. coli and related species needs to be curated, and that the current state of annotation should be viewed with substantially more caution than for larger genes.
Table 1.
SPs detected in this study
| Gene | Flanking Genes a | Strand b | Coordinates c | Length | Amino acid Sequence |
|---|---|---|---|---|---|
| yddY | dosC / yddW | < < < | 1567178, 1567219 | 13 | MVQLVDLARCVSF |
| ymgK | iraM / ycgX | < < < | 1212260, 1212304 | 14 | MFSKLAQSSIKAMF |
| yacM | coaE / guaC | < > > | 113244, 113288 | 14 | MIIKTLKMSARKRN |
| yabR | leuO / ilvI | > < > | 85467, 85511 | 14 | VKRNDKILHYRGLN |
| yadW | clcA / erpA | > > > | 176552, 176617 | 21 | MAIIIGLEFAQLPMSFGAKYE |
| yliM | rhtA / ompX | < > > | 850332, 850397 | 21 | METFCYMKWPVRHHKSRRVSH |
| ynfR | ynfN / cspI | < < < | 1638188, 1638253 | 21 | MKAPSGAFLLGVYSMDTHILR |
| yqfH | uacT / idi | > < > | 3032939, 3033010 | 23 | MINQVSVYRQPPVLSGCRQVKTI |
| yahV | betT / pdeL | > > > | 331802, 331876 | 24 | VCDILLNVLNIVFIGIAIILVIIC |
| ysdD | dnaA / rpmH | < > > | 3884026, 3884106 | 26 | MTIDKNWLNRSNKDPGRSLRFTHQPV |
| yqfI | gcvT / ubiI | < > < | 3050958, 3051041 | 27 | MSKNTKSKNNGIRKYNAKTEVKLVYFK |
| ykiD | ykiA / rdgC | > > < | 408947, 409030 | 27 | MTQRPWSKLQRKTHNIAALKIIARRSE |
| yldA | ybdR / rnk | > < < | 643330, 643419 | 29 | MAEAFYILIGFLIMAAIIVMAVLYLENHS |
| ynfS | cspF / ydfT | > > < | 1642122, 1642211 | 29 | MNNPVCLDDWLIGFKSLCCTLAVIALLII |
| ymiC | yciX / acnA | > > > | 1335572, 1335667 | 31 | MINTNMKYWSWMGAFSLSMLFWAELLWIITH |
| ytiB | yjiC / iraD | < > > | 4556574, 4556675 | 33 | MPVNGIFDVFDMLSIYIIYKLIVSNNTWLIMRK |
| ybgU | gltA / sdhC | < < > | 754674, 754781 | 35 | MRKSYEVGISPKINLCNSVEVLTNSFGTVISGRQV |
| ymgL | iraM / ycgX | < < < | 1212540, 1212650 | 36 | MEIKVQRLSLWMINTVFLLSPINNHQTNTINLIFEM |
| ynfP | ynfP / rspB | > < < | 1652728, 1652838 | 36 | MTIEKHERSTKDLVKAAVSGWLGTALEFMDFKSHAC |
| ynaM | ynaE / ttcC | < > < | 1434406, 1434293 | 37 | MNSILIITSLLIIFSIFSHALIKLGIGISNNPDKTDV |
| ynfQ | ydfJ / ydfK | < > > | 1632890, 1633003 | 37 | MNSILIITSLLIIFSIFSHALIKLGIGISNNPDKTDV |
| ykiC | yaiP / yaiS | < > < | 383960, 384079 | 39 | MNYKAFTQIAIDLLSAKLCNCTQAIMTHIIASFLAFMFF |
| ymdG | putA / putP | < > > | 1079024, 1079146 | 40 | MTGIKKITQTFSLRQLTFLKGATAKNVRECNLMKNSVAEH |
| yneP | yddA / ydeM | < > < | 1579545, 1579667 | 40 | MTKHPTGIYVGCLVKVIRRRLRMELKESVINYSPFVLQHP |
| ykgU | argF / insB1‐3 | < > < | 290510, 290638 | 42 | MRMIGLLYDFKDYASKMAENMARLAALLHYFSGDGGDISVTG |
| yqhI | yghX_2 / gpr | < < > | 3147597, 3147740 | 47 | MPRLTAKDFPQELLDYYDYYAHGKISKREFLNLAAKCGRRDDGISVV |
| ylcJ | emrE / ybcK | > > > | 568695, 568844 | 49 | MSLVLCFLLMSLFFMYSFVLSRLWRKKIAIRLLLYIQDNVTLIVFLNKK |
| ymjE | puuP / puuA | < < < | 1359177, 1359341 | 54 | MPMIKSPHGEGGCVCAPPATDWTPPPLLPLLNRFDFRSTRPQTLLRRGGSNYGY |
| yqiD | zupT / rib | > < < | 3183381, 3183551 | 56 | MFIAWYWIVLIALVVVGYFLHLKRYCRAFRQDRDALLEARNKYLNSTREETAEKVE |
| yciZ | yciT / pdeR | < < < | 1344436, 1344609 | 57 | MSEFDAQRVAERIDIVLDILVAGDYHSAIHNLEILKAELLRQVAESTPDIPKAPWEI |
| ynaL | fnrS / dbpA | > > > | 1409308, 1409481 | 57 | MTTLIYLQIPVPEPIPGDPVPVPDPIPRPQPMPDPPPDEEPIKLSHRERRSARIRAC |
| yecU | uvrY / yecF | < > > | 1995655, 1995831 | 58 | MIKIFIGHYINVFYSTADITLKKQPLLFLAKLMVYSAALTFFTANFHCNMTRKINEYA |
| yncO | ydcD / yncI | > < > | 1530319, 1530504 | 61 | VIYITIFMILPCPVPCSHVFLYVFYIFLFLVLFIMTIYQSSQKLHFSNCYHNNQHHNSLHN |
| ymgM | dadX / cvrA | > > < | 1240260, 1240463 | 67 | MDDKQLQAQAAFSKASQPAIDASLNLRFSFLFSHPYANLQHFIIFFLGHRPDHPGKLYLVTDNRCRA |
| yoaL | yoaE / manX | < < > | 1901573, 1901782 | 69 | MFNSRLTTMEYRAVARSMDRHRRHFSIRPFNACLSGTLCRTFRLHFVVTPALFLASNSYSLSRSLSWNS |
| ykgV | yagM / yagN | < < < | 294918, 295142 | 74 | MSAFKLPDTSQSQLISTAELAKIISYKSQTIRKWLCQDKLPEGLPRPKQINGRHYWLRKDVLDFIDTFSVRESL |
3.5. Identifying SPs in an Authentic Research‐Based Laboratory Class
The 80 short ORFs tested in this study were originally selected, tagged, and tested by undergraduate students taking part in an authentic research‐based Molecular Biology Laboratory class at Towson University. This study represents multiple years of work by more than 200 students, with each pair of students selecting, tagging, and testing one short ORF during their semester class. Although researchers in the lab subsequently repeated all results multiple times, as well as conducted the data analysis, the core of the project was carried out by the students. This project represents an opportunity for students to play a unique role in research. In an educational environment, students can gain laboratory skills regardless of the accuracy of their prediction, and mentors can gain valuable strains, reagents, and preliminary data from the work done by students in the class. Altogether, we found this an ideal type of project for educating students in laboratory techniques and methodology, for allowing large numbers of students to participate in research, and for making a valuable contribution to our knowledge of the prevalence of SPs in bacteria. This is an on‐going study, and each semester students at Towson University are continuing to test other sORFs identified in the E. coli genome. In addition to identifying new SPs, it is our hope that this growing list of detected and undetected SPs will be a resource for developing and evaluating SP predictive methods in the future.
4. Concluding Remarks
In this study, 80 sORFs were tested to determine if they encode a protein and, of these, protein synthesis was detected for 36 SPs. Considering that these short ORFs represented a range of genomic and biochemical characteristics, this is a surprisingly high success rate, and it suggests that many more SPs synthesized in E. coli may remain to be discovered. Our results also show that our current annotations of short genes in E. coli and related species have a low degree of accuracy, but suggest that using bioinformatic searches based on the predicted RBS of a sORF, as well as experimental data from ribosome profiling experiments, will allow us to improve our predictive capabilities.
Conflict of Interest
The authors declare no conflict of interest.
Supporting information
Supporting information.
Supporting information.
Supporting information.
Supporting information.
Supporting information.
Supporting information.
Supporting information.
Supporting information.
Acknowledgements
This research was supported by a CAREER grant (1R15AI094548‐01) from the National Science Foundation. It was also supported by funds to the Jess and Mildred Fisher Endowed Chair of Biological Sciences at Towson University (M.R.H.). Students were supported by Undergraduate Research Grants from the Fisher College of Science and Mathematics and from Towson University. The authors would like to thank all of the other students from Towson University that participated in any capacity in this study (File 7, Supporting Information). The authors would like to thank Dr. Gisela Storz for her insightful comments during this study and about the manuscript. The authors would also like to thank Andrew Stone for his assistance with the manuscript, and Jacqueline Thompson for her substantial logistical help throughout the project.
VanOrsdel C. E., Kelly J. P., Burke B. N., Lein C. D., Oufiero C. E., Sanchez J. F., Wimmers L. E., Hearn D. J., Abuikhdair F. J., Barnhart K. R., Duley M. L., Ernst S. E. G., Kenerson B. A., Serafin A. J., Hemm M. R., Proteomics 2018, 18, 1700064 https://doi.org/10.1002/pmic.201700064
References
- 1. Storz G., Wolf Y., Ramamurthi K., Annu. Rev. Biochem. 2014, 83, 753. [DOI] [PMC free article] [PubMed] [Google Scholar]
- 2. Garbis S., Lubec G., Fountoulakis M., J. Chromatogr. A 2005, 1077, 1. [DOI] [PubMed] [Google Scholar]
- 3. Levin P., Fan N., Ricca E., Driks A., Losick R., Cutting S., Mol. Microbiol. 1993, 9, 761. [DOI] [PubMed] [Google Scholar]
- 4. Galperin M., Mekhedov S., Puigbo P., Smirnov S., Wolf Y., Rigden D., Environ. Microbiol. 2012, 14, 2870. [DOI] [PMC free article] [PubMed] [Google Scholar]
- 5. Handler A., Lim J., Losick R., Mol. Microbiol. 2008, 68, 588. [DOI] [PMC free article] [PubMed] [Google Scholar]
- 6. Modell J., Hopkins A., Laub M., Genes and Dev. 2011, 25, 1328. [DOI] [PMC free article] [PubMed] [Google Scholar]
- 7. Karimova G., Davi M., Ladant D., J. Bacteriol. 2012, 194, 5576. [DOI] [PMC free article] [PubMed] [Google Scholar]
- 8. Hobbs E., Yin X., Paul B., Astarita J., Storz G., Proc. Natl. Acad. Sci. USA 2012, 109, 16696. [DOI] [PMC free article] [PubMed] [Google Scholar]
- 9. Lloyd C., Park S., Fei J., Vanderpool C., J. Bacteriol. 2017, 199, e00869. [DOI] [PMC free article] [PubMed] [Google Scholar]
- 10. Gassel M., Mollenkamp T., Puppe W., Altendof K., J. Biol. Chem. 1999, 274, 37901. [DOI] [PubMed] [Google Scholar]
- 11. VanOrsdel C., Bhatt S., Allen R., Brenner E., Hobson J., Jamil A., Haynes B., Genson A., Hemm M., J. Bacteriol. 2013, 195, 3640. [DOI] [PMC free article] [PubMed] [Google Scholar]
- 12. Magny E., Pueyo J., Pearl F., Cespedes M., Niven J., Bishop S., J. Cuoso Science 2013, 341, 1116. [DOI] [PubMed] [Google Scholar]
- 13. Pueyo J., Couso J., Dev. Biol. 2008, 324, 192. [DOI] [PubMed] [Google Scholar]
- 14. Pauli A., Norris M., Valen E., Chew G., Gagnon J., Zimmerman S., Mitchell A., Dubrulle J., Reyon D., Tsai S., Joung J., Saghatelian A., Schier A., Science 2014, 14, 1248636. [DOI] [PMC free article] [PubMed] [Google Scholar]
- 15. Cheng H., Chan W., Li Z., Wang D., Liu S., Zhou Y., Curr. Protein Pept. Sci. 2011, 12, 503. [DOI] [PMC free article] [PubMed] [Google Scholar]
- 16. Slavoff S., Mitchell A., Schwaid A., Cabili M., Ma J., Levin J., Karger A., Budnik B., Rinn J., Saghatelian A., Nat. Chem. Biol. 2013, 9, 59. [DOI] [PMC free article] [PubMed] [Google Scholar]
- 17. Crappé J., Criekinge V., Trooskens G., Hayakawa E., Luyten W., Baggerman G., Menschaert G., BMC Genomics 2013, 14, 648. [DOI] [PMC free article] [PubMed] [Google Scholar]
- 18. Hemm M., Paul B., Schneider T., Storz G., Rudd G. K., Mol. Microbiol. 2008, 70, 1487. [DOI] [PMC free article] [PubMed] [Google Scholar]
- 19. Schneider T., Nano. Commun. Netw. 2010, 1, 173. [DOI] [PMC free article] [PubMed] [Google Scholar]
- 20. Samayoa J., Yildiz F., Karplus K., Bioinformatics 2011, 27, 1765. [DOI] [PMC free article] [PubMed] [Google Scholar]
- 21. Goli B., Nair A., Biochem. Biophys. Res. Commun. 2012, 25, 422, 36. [DOI] [PubMed] [Google Scholar]
- 22. Ma J., Diedrich J., Jungreis I., Donaldson C., Vaughan J., Kellis M., Yates J., Saghatelian A., Anal. Chem. 2016, 88, 3967. [DOI] [PMC free article] [PubMed] [Google Scholar]
- 23. Nday E., Jonckheere V., Giess A., Valen E., Menschaert G., Van Damme P. Nucleic Acids Res. 2017, 45, e168. [DOI] [PMC free article] [PubMed] [Google Scholar]
- 24. Kim W., Silby M., Purvine S., Nicoll J., Hixson K., Monroe M., Nicora C., Lipton M., Levi S., PloS One 2009, 4, e8455. [DOI] [PMC free article] [PubMed] [Google Scholar]
- 25. Aspden J., Eyre‐Walker Y., Phillips R., Amin U., Mumtaz M., Brocard M., J. Cuoso Elife 2014, 3, e03528. [DOI] [PMC free article] [PubMed] [Google Scholar]
- 26. Nakahigashi K., Takai Y., Kimura M., Abe N., Nakayashiki T., Shiwa Y., Yoshikawa H., Wanner B., Ishihama Y., Mori H., DNA Res. 2016, 23, 193. [DOI] [PMC free article] [PubMed] [Google Scholar]
- 27. Neuhaus K., Landstorfer R., Fellner L., Simon S., Schafferhans A., Goldberg T., Marx H., Ozoline O., Rost B., Kuster B., Keim D., Scherer S., BMC Genomics 2016, 17, 133. [DOI] [PMC free article] [PubMed] [Google Scholar]
- 28. Baek J., Lee J., Yoon K., Lee H. G3 (Bethesda) 2017, 7, 983. [DOI] [PMC free article] [PubMed] [Google Scholar]
- 29. Olexiouk V., Criekinge W., Menschaert G., Nucleic Acids Res. 2018, 46, D497. [DOI] [PMC free article] [PubMed] [Google Scholar]
- 30. Lluch‐Senar M., Delgado J., Chen W., Lloréns‐Rico V., O'Reilly F., Wodke J., Unai E., Yus E., Martínez S., Nichols R., Ferrar T., Vivancos A., Schmeisky A., Stülke J., van Noort V., Gavin A., Bork P., Serrano L., Mol. Syst. Biol. 2015, 11, 780. [DOI] [PMC free article] [PubMed] [Google Scholar]
- 31. Ladoukakis E., Pereira V., Magny E., Eyre‐Walker A., Couso J., Genome Biol. 2011, 25, R118. [DOI] [PMC free article] [PubMed] [Google Scholar]
- 32. Bazzini A., Johnstone T., Christiano R., Mackowiak S., Obermayer B., Fleming E., Vejnar C., Lee M., Rajewsky N., Walther T., EMBO J. 2014, 33, 981. [DOI] [PMC free article] [PubMed] [Google Scholar]
- 33. Keseler I., Mackie A., Peralta‐Gil M., Santos‐Zavaleta A., Gama‐Castro S., Bonavides‐Martinez C., Fulcher C., Huerta A., Kothari A., Krummenacker M., Latendresse M., Muñiz‐Rascado L, Ong Q., Paley S., Schröder J., Shearer A., Subhraveti P., Travers M., Weerasinghe D., Weiss V., Collado‐Vides J., Gunsalus R., Paulsen I., Karp P., Nucleic Acids Res. 2013, 41, D605. [DOI] [PMC free article] [PubMed] [Google Scholar]
- 34. Cole C., Barber J., Barton G., Nucleic Acids Res. 2008, 36, W197. [DOI] [PMC free article] [PubMed] [Google Scholar]
- 35. Allen R., Brenner E., VanOrsdel C., Hobson J., Hearn D., Hemm M., BMC Genomics 2014, 15, 946. [DOI] [PMC free article] [PubMed] [Google Scholar]
- 36. Michel A., Fox G., Kiran A., De Bo C., O'Connor P., Heaphy S., Mullan J., Donohue C., Higgins D., Baranov P., Nucleic Acids Res. 2014, 42D1 D859. [DOI] [PMC free article] [PubMed] [Google Scholar]
- 37. Langmead B., Salzberg S., Nat. Methods 2012, 9, 357. [DOI] [PMC free article] [PubMed] [Google Scholar]
- 38. K. Bartoń, R package version 1.15.6., 2016. (Computer software).
- 39. Burnham K., Anderson D., Model Selection and Multimodel Inference: A Practical Information‐Theoretic Approach, Springer Science & Business Media, New York: 2003. [Google Scholar]
- 40. Wisniewski J., Rakus D., Data Brief 2014, 1, 7. [DOI] [PMC free article] [PubMed] [Google Scholar]
- 41. Blattner F., Plunkett G., Bloch C., Perna N., Burland V., Riley M., Collado‐Vides J., Glasner J., Rode C., Mayhew G., Gregor J., Davis N., Kirkpatrick H., Goeden M., Rose D., Mau B., Shao Y., Science 1997, 277, 1453. [DOI] [PubMed] [Google Scholar]
Associated Data
This section collects any data citations, data availability statements, or supplementary materials included in this article.
Supplementary Materials
Supporting information.
Supporting information.
Supporting information.
Supporting information.
Supporting information.
Supporting information.
Supporting information.
Supporting information.