

Summary
Background
Sirtuin 1 (Sirt1) is suppressed in non‐alcoholic fatty liver disease (NAFLD), while its’ stimulation or overexpression results in reduced disease severity in pre‐clinical NAFLD models. Leucine allosterically activates Sirt1 and synergise with other Sirt/AMPK/NO pathway activators. We developed a triple combination of leucine, metformin and sildenafil (NS‐0200), which was effective in a mouse model of non‐alcoholic steatohepatitis (NASH).
Aim
To report the results from a Phase 2, randomised clinical trial of of NS‐0200 in 91 subjects with NAFLD (liver fat ≥15% by magnetic resonance imaging‐proton‐density fat fraction (MRI‐PDFF)).
Methods
Subjects were randomised to placebo, low‐dose (1.1 g leucine/0.5 g metformin/0.5 mg sildenafil) or high‐dose NS‐0200 (1.1 g leucine/0.5 g metformin/1.0 mg sildenafil) b.d. for 16 weeks; change in hepatic fat was assessed via MRI‐PDFF, and lipid metabolism was assessed via changes in the lipidomic signature. Seventy subjects completed the trial and met a priori compliance criteria. Analyses were conducted on the full cohort and on those with alanine aminotransferase (ALT) values above median (50 U/L; n = 35).
Results
In the full cohort, active treatments did not separate from placebo. High dose NS‐0200 reduced hepatic fat by 15.7% (relative change from baseline) in the high ALT group (P < 0.005) while low dose NS‐0200 and placebo did not significantly change hepatic fat. Lipidomic analysis showed dose‐responsive treatment effects in both overall and high ALT cohorts, with significant decreases in metabolically active lipids and up‐regulation of fatty acid oxidation.
Conclusion
These data support further evaluation of high‐dose NS‐0200 for treating NASH, especially in those with elevated ALT (NCT 02546609).
1. INTRODUCTION
Non‐alcoholic fatty liver disease (NAFLD) is a spectrum of disorders characterised by hepatic lipid accumulation and cellular degeneration, in the absence of significant alcohol consumption or secondary causes of hepatic steatosis.1 NAFLD includes those with non‐alcoholic steatohepatitis (NASH), who are most likely to develop progressive fibrosis, cirrhosis and hepatocellular carcinoma. The prevalence of NAFLD is 10%‐25% in the general population, and increases to ~ 75% in patients with obesity and diabetes.1, 2, 3 Currently, the most widely accepted view of the pathogenesis of NAFLD is based on a “two‐hit,” or a “multiple‐hit” model, with insulin resistance leading to hepatic lipid accumulation, representing the first hit. Successive activation of multiple pathways resulting in oxidative and inflammatory stress are thought to represent additional hit(s) which mediate progression of disease and fibrosis;4, 5 among individuals with NAFLD, 23.8% are reported to have ≥F2 fibrosis and 2.3%‐9.7% exhibit ≥F3 fibrosis.6 However, despite the pivotal role of insulin resistance in the pathogenesis of NAFLD, improving insulin sensitivity with metformin has only a minimal independent effect on liver histology and therefore is not clinically recommended.1, 7 There is some evidence that pioglitazone improves NASH;8, 9 however, that primary outcome measure was not achieved in a large clinical trial.8 Furthermore, effects reported with pioglitazone do not appear to be a thiazolidinedione‐class effect, as rosiglitazone has not been effective in multiple clinical trials.9, 10 There are presently no FDA‐approved therapeutic agents for treatment of NASH, although weight loss exceeding 5%, whether via hypocaloric diet, exercise or both improve hepatic steatosis, and more substantial weight loss (~10%) may improve necroinflammation (sustained inflammation leading to necrosis and fibrosis) as well.1, 11
The 5′ adenosine monophosphate‐activated protein kinase (AMPK)/Sirtuin 1 (Sirt1) pathway is a key regulator of mitochondrial biogenesis, energy and lipid metabolism, including hepatic lipid metabolism.12, 13, 14, 15, 16, 17 Activation of this pathway via either enzyme prevents or reverses excess hepatic lipid accumulation and inflammation,18, 19, 20, 21, 22 thus representing possible therapeutic targets for NASH. We have demonstrated that L‐leucine has a unique role as an activator of the Sirt1/AMPK pathway,14, 23, 24 serving as a partial mimetic of caloric restriction in pre‐clinical models, and thereby modulates lipid and energy metabolism and increases insulin sensitivity.
Consequently, adding L‐leucine to metformin results in a novel, synergistic interaction that enabled a 65%‐80% metformin dose reduction with no loss of anti‐diabetic efficacy in diabetic rodent models25, 26 and a 40% metformin dose reduction in a recent clinical trial.27 Moreover, this combination of leucine with low‐dose metformin reversed hepatic steatosis in pre‐clinical studies in murine models of type 2 diabetes and NASH despite the lack of observed effect of full‐dose metformin in the absence of L‐leucine,28 and adding low‐dose sildenafil synergistically enhances this effect by stimulating endothelial nitric oxide synthase (eNOS) activity leading to further stimulation of Sirt1, and thus further attenuating inflammation and fibrosis.15, 29 Accordingly, this exploratory phase 2 study was conducted to evaluate the efficacy of NS‐0200, a leucine‐metformin‐sildenafil fixed‐dose combination, in reducing hepatic steatosis and improving related metabolic parameters in a placebo‐controlled multicentre 16‐week clinical trial.
2. METHODS
2.1. Study design
This was a randomised, placebo‐controlled, phase 2, double‐blind study designed to evaluate the effects on hepatic steatosis of 2 fixed‐dose combinations of leucine, metformin and sildenafil (NS‐0200) administered twice daily for 16 weeks, compared to placebo (NCT 02546609). Active treatments consisted of capsules containing 1100 mg leucine, 500 mg metformin and either 0.5 or 1.0 mg sildenafil administered twice daily orally (Table 1).
Table 1.
Treatment arms
| Treatment arm | Subjects (N) randomised | Dosing regimen | Study Medication Dosed Twice/Daya | ||
|---|---|---|---|---|---|
| Leucine | Metformin | Sildenafil | |||
| A | 24 | Placebo | N/A | N/A | N/A |
| B | 35 | NS‐0200 | 1100 mg | 500 mg | 0.5 mg |
| C | 32 | NS‐0200 | 1100 mg | 500 mg | 1.0 mg |
Administration was twice daily (b.d.); therefore, the total daily dose of NS‐0200 is twice that listed for each component.
Subjects were screened at clinical sites for basic eligibility criteria with a detailed medical history and physical examination and blood analysis 14 days prior to initiating the study. Those subjects who met eligibility criteria returned for a screening magnetic resonance imaging (MRI) exam to estimate hepatic fat fraction by proton‐density fat fraction (PDFF) within 7 days prior to study initiation. Participants with hepatic fat fraction ≥15% by MRI‐PDFF were enrolled in the study. Participants who qualified by MRI‐PDFF returned to the clinic on study day 1 for baseline laboratories and first dose of study medication, followed by visits on days 7, 28, 56, 84 and 112 (end of study). Subjects were also contacted by telephone on days 14, 42, 70 and 98 to enhance compliance. Study visits included routine blood tests, body weight and assessment of compliance via pill counts, and the final study visit included the endpoint MRI to assess PDFF change.
This study was approved by the Institutional Review Boards at each participating centre, and written informed consent was obtained from all participants prior to study enrolment and initiation of study‐specific procedures.
2.2. Eligibility
The key inclusion criteria were age 18‐75 years at study entry, MRI‐PDFF ≥15%, ALT ≥ 30 U/L for men and ≥ 19 U/L for women, body mass index between 25 and 40 kg/m2 and clinical and laboratory criteria consistent with NAFLD. Subjects with evidence of other chronic liver disease or with history of significant alcohol consumption, defined as >7 drinks/wk for both males and females for the prior 6 months were excluded from the trial.
2.3. Randomisation and blinding
A computer‐generated randomised block schedule was prepared by a third party, and treatment allocation was performed centrally for all sites, with randomization numbers assigned in chronological order. Study medication was provided to study centres in a blinded manner, and sponsor personnel, study staff, MRI analysis staff and subjects were blinded to treatment assignment.
2.4. Primary and secondary outcomes
The primary outcome was 16‐week change in hepatic fat fraction, estimated by MRI‐PDFF. Secondary endpoints were 16‐week changes in liver enzymes (ALT, AST, GGT); cytokeratin 18 (K18, M30 epitope); HbA1c, fasting glucose, insulin and insulin sensitivity; blood lipids (cholesterol, LDL, HDL and triglycerides); hsCRP; and serum metabolomic profile.
2.4.1. MRI acquisition
An MRI of the liver was performed using a torso‐array surface coil centred over the upper abdomen using one or both types of breath‐hold, noncontrast, gradient‐recalled‐echo, axial 2D sequence: a multiple‐echo (ME) 6‐echo sequence, and a double‐double‐echo (DDE) sequence. MRI‐PDFF results from these2 types of sequence have been shown to be nearly identical.30 Target MRI scanning parameters were selected to avoid or correct for possible confounding factors (eg, T1 bias, T2* decay, multi‐frequency interference) that could introduce error in fat quantification.31, 32, 33, 34, 35, 36 Images in Digital Imaging and Communications in Medicine (DICOM) format were transferred from clinical trial sites to a central Radiology Coordinating Center (University of California at San Diego) for quality control (QC) inspection, and analysis.
2.4.2. MRI QC and analysis
After intake QC inspection of images and DICOM‐header parameter information, 3 circular, 1‐cm radius regions of interest (ROIs) were placed in the right lobe of liver, preferentially on fifth‐echo liver images for the ME sequence, and on the first‐echo liver images of the first DDE sequence, avoiding major vessels and ducts, lesions, artefact, other organs and liver edges. Those ROIs were propagated to images for the other echoes. ROI signal intensities from those images were analysed with the MATLAB software analysis package (MathWorks, Natick, MA) using a custom fitting algorithm that assumed exponential T2* signal decay, and applied a multi‐peak spectral model to account for fat‐fat and fat‐water multi‐frequency interference effects, based on the work of Hamilton et al.37 MRI‐PDFF and effective transverse relaxation time (T2*) were calculated for each ROI location. Values of MRI‐PDFF, T2* and r 2 (where ‘r’ is the Pearson‐r fitting coefficient for the custom fitting algorithm) were recorded for each ROI, and mean values of the 3 ROI‐location PDFF values were recorded for each acquired sequence. To exclude poorly fitted results, PDFF values for an ROI were excluded if the r 2 fitting parameter was <.97.38
2.5. Metabolomic assessment
Serum metabolomic profiles were semi‐quantified by ultra‐high performance liquid chromatography coupled to mass spectrometry (UHPLC‐MS) as previously described.39 Briefly, 2 separate UHPLC‐Time of Flight‐MS based platforms analysing methanol and chloroform/methanol serum extracts were combined with a UHPLC‐single quadrupole‐MS based platform used to analyse amino acids. A specific metabolite extraction procedure was performed for each platform. Identified ion features in the methanol extract platform included fatty acids, acyl carnitines, bile acids, monoacylglycerophospholipids, monoetherglycerophospholipids, free sphingoid bases, N‐acyl ethanolamines and oxidised fatty acids. The chloroform/methanol extract platform provided coverage over glycerolipids, cholesterol esters, sphingolipids, diacylglycerophospholipids and acyl‐ether‐glycerophospholipids. Lipid nomenclature and classification follows the LIPID MAPS convention, http://www.lipidmaps.org. Metabolite extraction procedures, chromatographic separation conditions and mass spectrometric detection conditions are also detailed in.39 Metabolomics data were pre‐processed using the TargetLynx application manager for MassLynx 4.1 (Waters Corp., Milford, MA). Intra‐batch (multiple internal standard response corrections) and inter‐batch (variable specific interbatch single point external calibration using repeat extracts of a commercial serum sample) data normalisation is described in.40
2.6. Safety evaluation
Safety assessment included physical examination with vital signs, 12‐lead electrocardiogram, clinical chemistry, haematology and urinalysis. Adverse events were categorised by severity, outcome and relationship to study drug.
2.7. Statistics
The primary analysis population was per protocol (PP) for efficacy endpoints and intention to treat (ITT) for safety endpoints. The PP population consisted of all ITT subjects who completed all study visits, had a valid MRI measured at the endpoint and who adequately complied with the study protocol without major protocol deviations and received ≥ 80% of provided study medication via pill counts. A post‐hoc subgroup analysis consisting of participants with ALT levels greater than median value (>50 U/L) was also conducted.
A mixed‐model of analysis of covariance (ANCOVA) was used to analyse changes in MRI‐PDFF from baseline to week 16, with baseline MRI‐PDFF adjusted as a covariate. The least squares (LS) means, standard errors (SEs) and the corresponding 95% confidence intervals (CIs) for the changes from baseline to week 16 were derived from the model for each treatment. Each of the fixed‐dose combinations of leucine, metformin and sildenafil treatment groups (low dose, treatment group B; and high dose, treatment group C) were compared to placebo group (treatment group A), and the LS means for the treatment difference (treatment B or C minus treatment A), the SEs, the associated 95% CIs and the P‐values computed accordingly; unless otherwise noted, all changes in MRI‐PDFF are reported as relative change, expressed as % change from baseline. Secondary efficacy endpoints were similarly analysed via mixed effects model, with baseline value used as covariate and with logarithmic transformation as necessary to ensure data normality.
Univariate analyses were performed on normalised metabolomic data. These analyses consisted in several binary comparisons over different defined subgroups of interest: paired comparisons between study endpoint and baseline and unpaired comparisons between treatment arms at baseline. For each metabolite, changes between subgroups were calculated as the base 2 logarithm of fold‐change (mean of subgroup 1 divided by mean of subgroup 2). These values were accompanied by a significance level based on P‐values from Student's t‐test. Three levels of increasing significance were considered: P < 0.05, P < 0.01 and P < 0.001. All calculations were performed using statistical software package r v. 3.4.1 (R Core Team, 2017; https://www.R-project.org/). In order to visually compare results, base 2 logarithm fold‐changes and significances were used to create detailed heatmaps, grouping metabolites by families.
Sample size requirements for the trial were initially estimated as 17/group based on 80% power to detect a mean treatment difference in MRI‐PDFF, assuming a common standard deviation of 20%. This sample size was increased by approximately 35%, to 23/treatment group (69 total), to provide a larger sample size for assessment of secondary endpoints. This value was then adjusted for a predicted dropout rate of 24% to yield a final enrolment goal of 30/treatment arm (90 total).
3. RESULTS
Two hundred and fifteen subjects were screened for participation. 124 of these did not meet enrolment criteria, primarily due to hepatic fat fraction <15%. The remaining 91 subjects were randomised, 24 to placebo (treatment group A), 35 to the 1100 mg leucine/500 mg metformin/0.5 mg sildenafil group (treatment group B) and 32 to the 1100 mg leucine/500 mg metformin/1.0 mg sildenafil group (treatment group C). Of these, 90 participants received at least one dose of medication and constituted the ITT analysis group. Twenty of the enrolled (22.0%) participants discontinued study treatment early; 2 from placebo (treatment group A, 8.3%), 11 (31.4%) from treatment group B and 7 (21.9%) from treatment group C. Of the 71/91 (78.0%) participants completing the trial, 1 was excluded from the PP analysis group due to non‐adherence with a priori study medication compliance criteria. Thus, a total of 70 participants were analysed for this study for the PP group. Participants’ baseline characteristics are shown in Table2.
Table 2.
Selected demographical and baseline characteristics by treatmenta
| Per protocol population (n = 70) | |||
|---|---|---|---|
| Placebo treatment Ab (n = 22) | NS‐0200 treatment Bb (n = 24) | NS‐0200 treatment Cb (n = 24) | |
| Sex, n (%) | |||
| Male | 11 (50.0) | 8 (33.3) | 12 (50.0) |
| Female | 11 (50.0) | 16 (66.7) | 12 (50.0) |
| Age (y)c | |||
| Mean (SD) | 46.7 (10.59) | 45.7 (11.77) | 46.0 (13.55) |
| Race, n (%) | |||
| American Indian or Alaska Native | 0 (0.0) | 0 (0.0) | 1 (4.2) |
| Black or African American | 2 (9.1) | 1 (4.2) | 0 (0.0) |
| White | 19 (86.4) | 22 (91.7) | 22 (91.7) |
| White/Asian | 1 (4.2) | 1 (2.9) | 0 (0.0) |
| Not Reported | 0 (0.0) | 1 (4.2) | 1 (4.2) |
| Ethnicity, n (%) | |||
| Hispanic or Latino | 5 (22.7) | 7 (29.2) | 7 (29.2) |
| Not Hispanic or Latino | 17 (77.3) | 17 (70.8) | 17 (70.8) |
| Weight (kg) | |||
| Mean (SD) | 98.16 (14.98) | 94.21 (14.01) | 96.70(17.84) |
| Height (cm) | |||
| Mean (SD) | 170.5 (9.8) | 169.8 (9.4) | 168.6 (10.9) |
| Body Mass Index (BMI) (kg/m2) | |||
| Mean (SD) | 33.82 (4.60) | 32.62 (3.39) | 33.62 (3.84) |
| Fasting Plasma Glucose (mg/dL) | |||
| Mean (SD) | 109.1 (16.9) | 103.0 (14.6) | 112.1 (24.8) |
| HbA1c (%) | |||
| Mean (SD) | 5.62 (0.45) | 5.62 (0.57) | 5.74 (0.71) |
| PDFF (%) | |||
| Mean (SD) | 23.8 (4.7) | 24.2 (7.0) | 26.3 (6.0) |
| ALT (U/L) | |||
| Mean (SD) | 64.0 (27.6) | 56.5 (35.5) | 55.5 (28.5) |
| AST (U/L) | |||
| Mean (SD) | 37.4 (19.0) | 33.1 (17.7) | 34.1 (14.7) |
| GGT (U/L) | |||
| Mean (SD) | 49.5 (29.3) | 55.0 (44.4) | 58.3 (33.7) |
SD, Standard deviation; PDFF, Proton‐density fat fraction; AST, Aspartate aminotransferase; ALT, Alanine aminotransferase.
No statistically significant differences among treatment groups.
Treatment A, Placebo; Treatment B, 1100 mg leucine + 500 mg metformin + 0.5 mg sildenafil; Treatment C, 1100 mg leucine + 500 mg metformin + 1.0 mg sildenafil.
Age at consent.
The relative change in MRI‐PDFF between baseline and end of treatment was −10 ± 17.5% in the placebo treated patients, whereas it was 3.08 ± 25.5% in low‐dose NS‐0200‐treated patients (P = 0.057 compared to placebo) and −4.01 ± 24.6% in high‐dose NS‐0200‐treated patients (P = 0.377 compared to placebo) (Figure 1). There were no significant changes in ALT, AST, GGT or K18 in any of the treatment groups. Body weight did not significantly change in the placebo group (−0.4 + 0.4 kg) or the low‐dose NS‐0200 group (−1.4 ± 0.6 kg, not significant vs placebo); there was a significant decrease in weight in the high‐dose NS‐0200 group (−2.4 ± 0.5 kg, P = 0.025).
Figure 1.
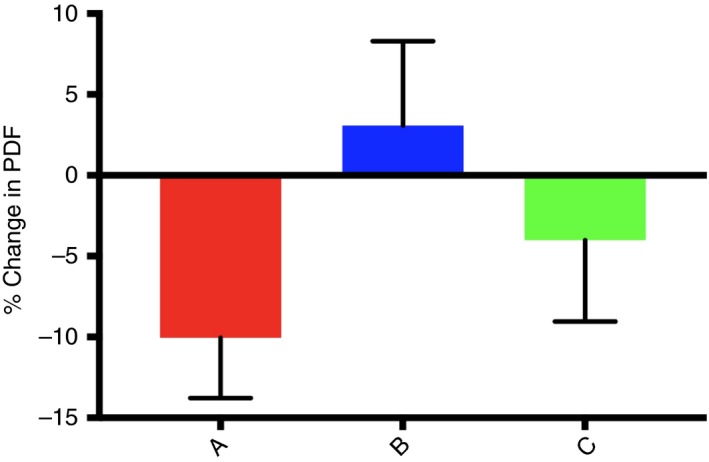
Effects of treatments on PDFF in the full per protocol cohort. A, Placebo; B, 1100 mg leucine/500 mg metformin/0.5 mg sildenafil b.d.; C, 1100 mg leucine/500 mg metformin/1.0 mg sildenafil b.d. PDFF changes are expressed as relative change from baseline ([16 wk HFF‐Baseline HFF]/Baseline HFF] X 100)
In a subgroup analysis, we examined the effects of high and low‐dose NS‐0200 in participants with baseline ALT values above the median (> 50 U/L; n = 35). In addition to elevated ALT levels (by definition), this subgroup also had elevated K18, AST and GGT (Figure S1), as well as differential metabolomic profiling, as described below. There was 15.7% relative reduction in MRI‐PDFF in the high‐dose NS‐0200 group in this high‐ALT subgroup cohort (P = 0.0032), while there was no significant change in either the lower dose or placebo groups (Figure 2). In contrast, subjects with ALT below the median value of 50 U/L exhibited a decrease in MRI‐PDFF only in the placebo group (−20.5 ± 5.7% relative decrease, P < 0.05 vs active treatments), while those in the active treatment group exhibited no significant change from baseline (low dose, 9.5 ± 9.1%; high dose, 4.3 ± 6.1%),. Subjects with high baseline ALT exhibited nonsignificant trends towards decreasing ALT and AST in the high‐dose NS‐0200 group and significant reductions in GGT in both NS‐0200 treatment groups vs placebo (Figure S2).
Figure 2.
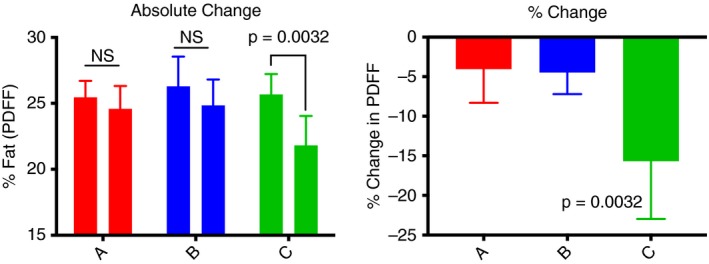
Effects of treatments on PDFF in subjects with elevated ALT (n = 35). A, Placebo (n = 14); B, 1100 mg leucine/500 mg metformin/0.5 mg sildenafil b.d. (n = 11); C, 1100 mg leucine/500 mg metformin/1.0 mg sildenafil b.d. (n = 10). Left panel shows absolute change and right panel shows relative % change ([16 wk HFF‐Baseline HFF]/Baseline HFF] X 100)
Although the study population was nondiabetic, both low‐ and high‐dose treatment arms achieved statistically significant reductions in HbA1c (placebo adjusted decreases of 0.21% [P = 0.002] and 0.17% [P = 0.016] for low‐ and high‐dose, respectively), but there was no significant treatment effect on fasting glucose, insulin or HOMA‐IR.
Metabolomic profiling demonstrated reductions in metabolically active lipids, including diglycerides (DG), triglycerides (TG), ceramides and multiple phospholipid and sphingomyelins and glycerophospholipid species in treatment vs placebo groups in the full per protocol cohort at study endpoint vs baseline (Figure 3), and pathway analysis of these data also demonstrate an increase in fat oxidation in the active treatment groups. However, a comparison between participants with baseline ALT > 50 U/L and those with < 50 U/L ALT demonstrated that only the high‐ALT group exhibited treatment effects on metabolically active lipids, as the low‐ALT group exhibited only minor increases in fatty acid species, but no treatment effect on DG, TG, ceramides or other lipid species of interest (Figure 4). Furthermore, the baseline lipidomic signature between the high‐ and low‐ALT groups was different, with high‐ALT subgroup exhibiting more metabolically active lipid species indicative of greater baseline disease.
Figure 3.
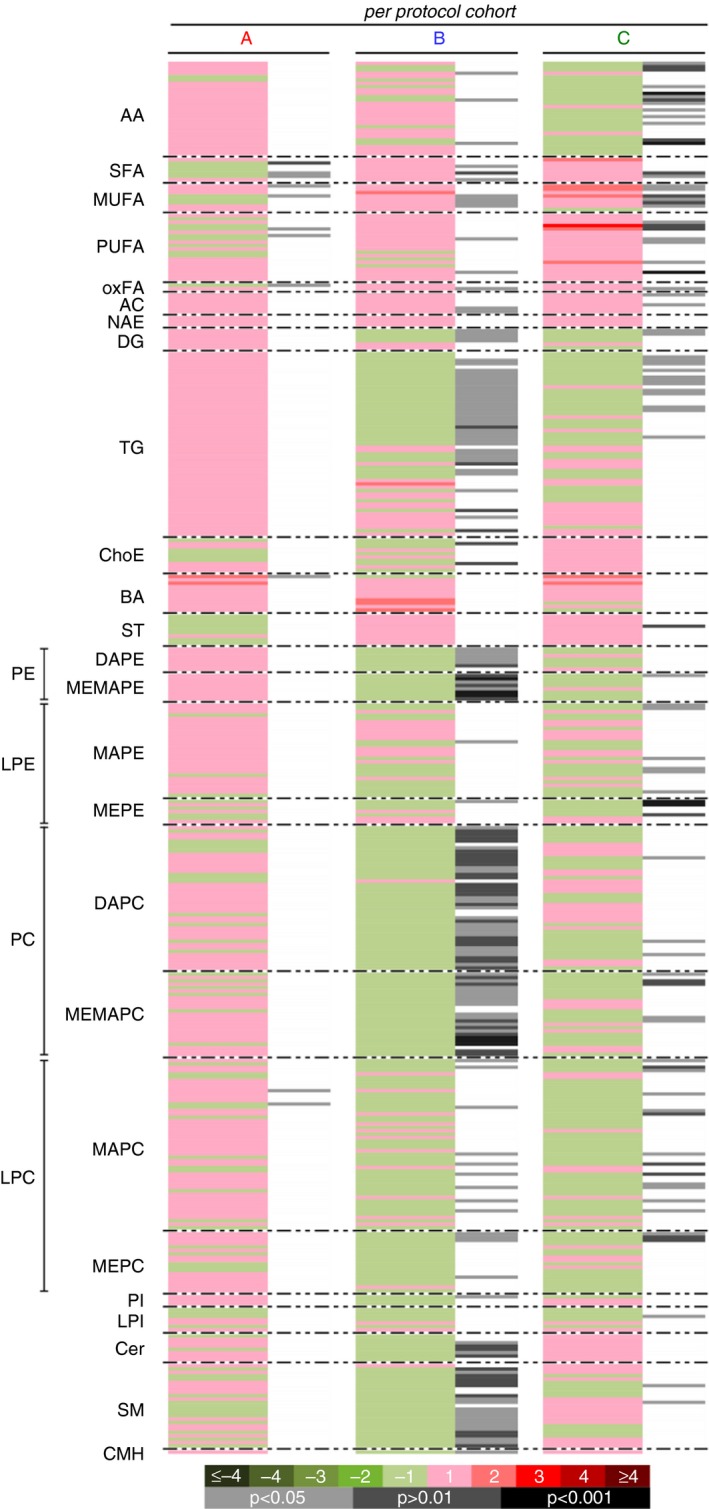
Effects of NS‐0200 on serum metabolomic changes in the per protocol cohort (n = 70). A, Placebo; B, 1100 mg leucine/500 mg metformin/0.5 mg sildenafil b.i.d; C, 1100 mg leucine/500 mg metformin/1.0 mg sildenafil b.d. Comparisons are week 16 vs baseline. Green sections of the heat map denote metabolites that were reduced (negative log2 fold‐changes) and red sections denote metabolites that were increased (positive log2 fold‐changes); grey/black bars indicate significant changes with treatment (light grey, P < 0.05; dark grey, P < 0.01; black, P < 0.001)
Figure 4.
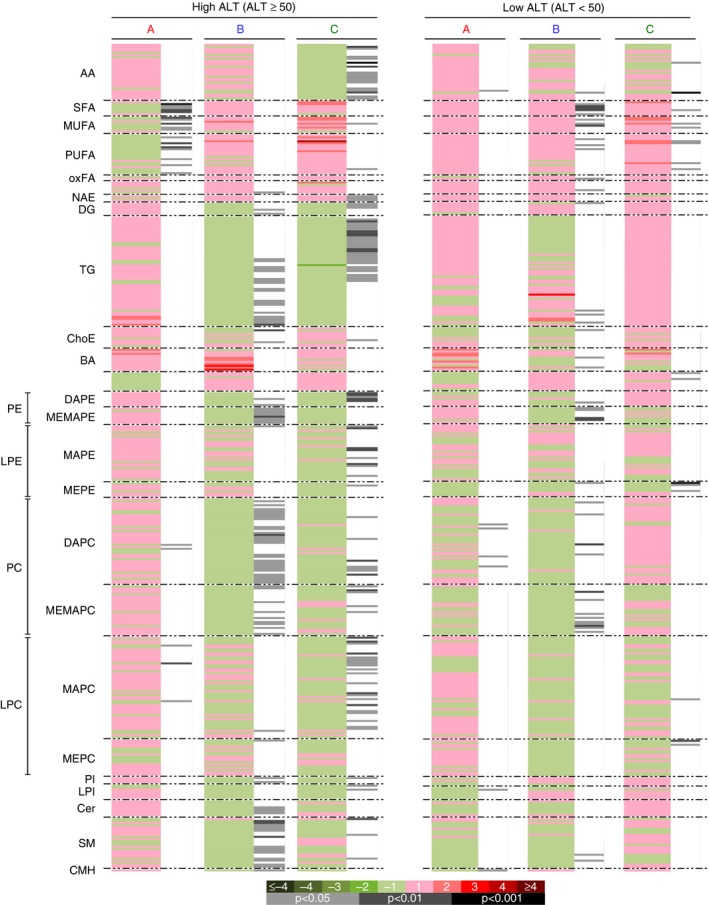
Effects of NS‐0200 on serum metabolomic changes in subjects with ALT > 50 U/L (“High ALT,” n = 35, left panel) vs those with ALT< 50 U/L (“Low ALT,” n = 35, right panel). A, Placebo; B , 1100 mg leucine/500 mg metformin/0.5 mg sildenafil b.d.; C, 1100 mg leucine/500 mg metformin/1.0 mg sildenafil b.d. Comparisons in each panel are week 16 vs baseline. Green sections of the heat map denote metabolites that were reduced (negative log2 fold‐changes) and red sections denote metabolites that were increased (positive log2 fold‐changes); grey/black bars indicate significant changes with treatment (light grey, P < 0.05; dark grey, P < 0.01; black, P < 0.001)
Consistent with the improvements in lipidomic profile, there was a corresponding improvement in TG which was most pronounced among those with hypertriglyceridemia (≥ 200 mg/dL) at baseline (n = 22; Figure S3).
Treatment‐emergent adverse events (TEAEs) are summarised in Table 3. Overall, the frequency of TEAEs was similar between placebo (75% of subjects) and pooled treatment groups (77% of subjects). Similarly, comparable fractions of placebo (50%) and active treatment (54.5%) subjects reported TEAEs that were considered related to study treatment (Table 3). However, subjects in the active treatment groups did report a greater number of mild‐to‐moderate gastrointestinal events than the placebo group, including diarrhoea (40.9 vs 8.3%), nausea (16.7 vs 12.5%) and vomiting (4.2 vs 0.6%), consistent with the presence of metformin. There were no (0.0%) serious TEAEs that were related to study treatment in any of the treatment groups (placebo or NS‐0200).
Table 3.
Summary of treatment‐emergent adverse events, by treatment group
| Intent‐to‐treat population (n = 90) | B and C Pooled (n = 66) | Significance (P value) | |||
|---|---|---|---|---|---|
| Placebo treatment Aa (n = 24) | NS‐0200 treatment Ba (n = 34) | NS‐0200 treatment Ca (n = 32) | |||
| All TEAEsb | 0.741 | ||||
| Number of subjects, n (%) | 18 (75.0) | 25 (73.5) | 26 (81.3) | 51 (77.3) | |
| Number of events | 49 | 91 | 90 | 181 | |
| All Serious TEAEs | 0.435 | ||||
| Number of subjects, n (%) | 0 (0.0) | 1 (2.9) | 0 (0.0) | 1 (1.5) | |
| Number of events | 0 | 3 | 0 | 3 | |
| All drug‐related TEAEs | 0.718 | ||||
| Number of subjects, n (%) | 12 (50.0) | 20 (58.8) | 16 (50.0) | 36 (54.5) | |
| Number of events | 20 | 54 | 39 | 93 | |
| All drug‐related, serious TEAEs | 1.000 | ||||
| Number of subjects, n (%) | 0 (0.0) | 0 (0.0) | 0 (0.0) | 0 (0.0) | |
| Number of events | 0 | 0 | 0 | 0 | |
| All TEAEs leading to study discontinuation | 0.053 | ||||
| Number of subjects, n (%) | 0 (0.0) | 5 (14.7) | 1 (3.1) | 6 (9.1) | |
| Number of events | 0 | 5 | 1 | 6 | |
Treatment A, Placebo; Treatment B, 1100 mg leucine + 500 mg metformin + 0.5 mg sildenafil; Treatment C, 1100 mg leucine + 500 mg metformin + 1.0 mg sildenafil.
Treatment‐emergent adverse event (TEAE) is defined as an adverse event occurring on or after the first dose of randomised study medication, or existing prior to the time of and worsening after the time of the first dose of randomised study medication.
Subjects discontinued participation in the trial for the following reasons: noncompliance/protocol violation(s), n = 5; withdrawal of consent, n = 3; lost to follow‐up, n = 5; and TEAEs, n = 7. TEAEs leading to discontinuation are summarised in Table 4.
Table 4.
Treatment‐emergent adverse events leading to discontinuation by system organ class, preferred term and treatment
| System organ class preferred term n (%) | Intent‐to‐treat population (N = 90) | B and C pooled (n = 66) | Significance (P value) | ||
|---|---|---|---|---|---|
| Placebo treatment A n = 24 | NS‐0200 treatment Ba n = 34 | NS‐0200 treatment Ca n = 32 | |||
| All TEAEsb leading to discontinuation | 0 (0.0) | 6 (17.6) | 1 (3.1) | 7 (10.6) | 0.0526 |
| Eye disorders | 0 (0.0) | 2 (5.9) | 0 (0.0) | 2 (3.0) | 0.186 |
| Vision blurred | 0 (0.0) | 2 (5.9) | 0 (0.0) | 2 (3.0) | 0.186 |
| Gastrointestinal disorders | 0 (0.0) | 4 (11.8) | 1 (3.1) | 5 (7.6) | 0.118 |
| Diarrhoea | 0 (0.0) | 1 (2.9) | 0 (0.0) | 1 (1.5) | 0.435 |
| Gastritis erosive | 0 (0.0) | 1 (2.9) | 0 (0.0) | 1 (1.5) | 0.435 |
| Gastrointestinal disorder | 0 (0.0) | 1 (2.9) | 0 (0.0) | 1 (1.5) | 0.435 |
| Nausea | 0 (0.0) | 1 (2.9) | 1 (3.1) | 1 (1.5) | 0.689 |
Treatment A, Placebo; Treatment B, 1100 mg Leucine + 500 mg Metformin + 0.5 mg Sildenafil; Treatment C, 1100 mg Leucine + 500 mg Metformin + 1.0 mg Sildenafil.
Treatment‐emergent adverse event (TEAE) is defined as an adverse event occurring on or after the first dose of randomised study medication, or existing prior to the time of and worsening after the time of the first dose of randomised study medication.
4. DISCUSSION
Data from this exploratory randomised, placebo‐controlled, phase 2, double‐blind clinical trial provide evidence supporting efficacy of NS‐0200 in a subset of subjects with NAFLD. Although the primary endpoint of reduced MRI‐PDFF was not achieved in the pre‐defined per protocol cohort, a post‐hoc analysis indicates significant improvements in MRI‐PDFF in a cohort exhibiting more advanced disease (P < 0.0032). The high‐ALT cohort was defined as subjects with baseline ALT above the median value of 50 U/L; although the higher ALT levels in this cohort are not predictive of NASH per se, higher ALT levels are nonetheless associated with both NASH and fibrosis.41, 42 At baseline, this group had a 2‐fold elevation in ALT vs the low‐ALT group, with corresponding elevations in other hepatic markers (AST, GGT and K18; Figure S1; P < 0.001). Further, this high‐ALT group exhibited a baseline metabolomic signature characteristic of more pronounced disease 39 and exhibited decreases in multiple metabolically active lipid species with treatment, while the low‐ALT group did not. These data are consistent with other reports demonstrating minimal efficacy of experimental NASH therapeutics in individuals with mild disease vs greater efficacy in NASH resolution in those with more advanced disease.43
The per protocol placebo group exhibited an unexpectedly high placebo response which may have resulted from MRI‐PDFF volatility in less diseased individuals. Previous studies have demonstrated similar volatility in hepatic fat, measured either via MRI‐PDFF or magnetic resonance spectroscopy (MRS), and corresponding decreases in liver fat in study placebo groups the absence of biopsy‐confirmed NASH. For example, Cui et al44 reported a 13.9% relative reduction in MRI‐PDFF in the placebo group of a 24‐week study of sitagliptin vs placebo in subjects with NAFLD. Similarly, in a shorter‐term (12‐week) study of the effects of liraglutide and sitagliptin on hepatic fat as measured by MRS in subjects with NAFLD, the placebo group exhibited a 9.5% relative reduction from baseline in hepatic fat as measured by MRS,45 consistent with the placebo group in the present study. However, placebo‐treated subjects with more advanced disease, as evidenced by biopsy‐confirmed NASH, exhibited only 4%‐5% relative changes in MRI‐PDFF,46, 47 consistent with the observed change in high‐ALT cohort placebo group in the present study.
Two doses of NS‐0200 were evaluated, both containing 1.11 g leucine and 500 mg metformin, and differing from each other only in the quantity of sildenafil present (0.5 vs 1.0 mg). These sildenafil doses were extrapolated from rodent data,15 accounting for species differences in bioavailability. The lower dose produced little effect on most variables, although it did result in improvements in the metabolomics profile, while the higher dose produced improvement in multiple variables. Thus, these data do not permit a conclusion with respect to optimal sildenafil dose, and higher doses may be warranted in follow‐up studies. However, rodent studies (unpublished data) indicates that > 4 mg sildenafil (human equivalent dose) does not confer further benefit, and may in fact attenuate the efficacy of this combination. The other components of NS‐0200 have been established at fixed levels, as follows. Pre‐clinical data indicate that optimal activation of Sirt1 occurs with a plasma leucine concentration range of 0.38‐0.50 mM,14, 23, 24, 25 and dose‐ranging studies with oral leucine administration in adults demonstrate a linear dose relationship, with doses of 1.0‐1.5 g resulting in peak plasma leucine levels of 0.4‐0.5 mM.48 Further increases in leucine administration result in a slower increase, plateauing at ~ 0.8 mM,48 but this higher level is associated with potential mTOR activation, while 0.5 mM leucine is not.25 The metformin dose in NS‐0200 is based on a previous assessment of leucine‐metformin synergy in improving glycemic control in patients with type 2 diabetes.27
The combination of leucine, metformin and sildenafil in NS‐0200 targets a synergistic interaction among elements of the Sirt1‐AMPK‐eNOS network.15 This network is a key regulator of integral factors required for progression or regression of NASH, namely hepatic lipid metabolism, oxidative stress and inflammation. Downregulation of this system promotes NASH progression, while activation improves hepatic steatosis, inflammation and fibrosis,19, 35, 36, 37 and the combination of leucine, metformin and sildenafil correspondingly regressed hepatic steatosis, inflammation, ballooning and fibrosis in a mouse model of NASH.15 Synergy among the 3 components is evidenced by the observation that the individual components in this combination exert little or no independent effect in experimental systems or clinical studies. For example, the effects of metformin on liver fat content, liver enzymes and/or histology have been evaluated in several studies with little or no effect demonstrated.38, 39, 40, 41, 42 Further, a recent systematic review57 of the effects of metformin on NASH outcomes in 11 papers with pre‐ and post‐treatment biopsies found no histological improvement of NASH in nondiabetic adults (5 studies), in mixed populations of diabetic and nondiabetic adults (5 studies) or in adults with type 2 diabetes (1 study). Similarly, data from children to adolescents also indicate little to no independent effect of metformin; metformin exerted no effect on reducing ALT, hepatic steatosis, lobular inflammation, NAFLD activity score or resolution of NASH in the 96‐week multicentre randomised trial (TONIC Trial) of 173 patients aged 8‐17 years, although there was an improvement in ballooning degeneration score.58
Similarly, although sildenafil has not been well‐studied in NASH, extensive pre‐clinical and clinical studies do not demonstrate effects of sildenafil on hepatic function in the approved therapeutic dose range for labelled indications,59 and pre‐clinical toxicology studies demonstrate increases in absolute and relative liver weight in both rats and dogs. Furthermore, El‐Mahmoudy et al60 reported that administration of sildenafil failed to protect against high fat diet‐induced impairment in hepatic biomarkers in hyperlipidemic rats. Thus, any therapeutic benefit seen when sildenafil is administered as a component of NS‐0200 likely occurs as a result of synergy with leucine.
Although leucine has not been well‐studied in NASH, pre‐clinical data demonstrate little or no independent effect of leucine on either histology or relevant biomarkers in mouse models of NAFLD/NASH.15, 29 Similarly, pre‐clinical data demonstrate greater efficacy of the leucine‐metformin‐sildenafil combination compared to combinations of any two of these agents (leucine‐metformin, leucine‐sildenafil, metformin‐sildenafil) in regressing hepatic steatosis, inflammation and fibrosis in a mouse model of NASH.15 Thus, the efficacy of this combination appears to be dependent upon synergistic interaction among leucine, metformin and sildenafil.
Overall, NS‐0200 was well‐tolerated in this trial, with no difference in TEAEs in treatment vs placebo groups, although subjects in the active treatment groups reported a greater number of mild‐to‐moderate gastrointestinal events than the placebo group, consistent with the metformin component of NS‐0200.
This study has several limitations. Since the study was an exploratory proof‐of‐concept study of relatively short duration, liver biopsies could not be justified and therefore fibrosis and other histological outcomes cannot be assessed. Additionally, since subjects were selected on the basis of MRI‐PDFF (a quantitative biomarker of hepatic steatosis) rather than biopsy‐proven NASH, our study probably included individuals with mild NAFLD unlikely to respond to intervention. Additionally, the metabolomics data indicate heterogeneity in the extent of disease, with the placebo group presenting a metabolic signature demonstrating lower levels of relevant metabolically active lipids (DG, TG, cholesterol esters, glycerophospholipids, ceramides and sphingomyelins) than the 2 active treatment groups (Figure 5), suggesting less advanced disease and possibly contributing to greater volatility in MRI‐PDFF in the placebo vs active treatment groups in the full cohort (per protocol) placebo group.
Figure 5.
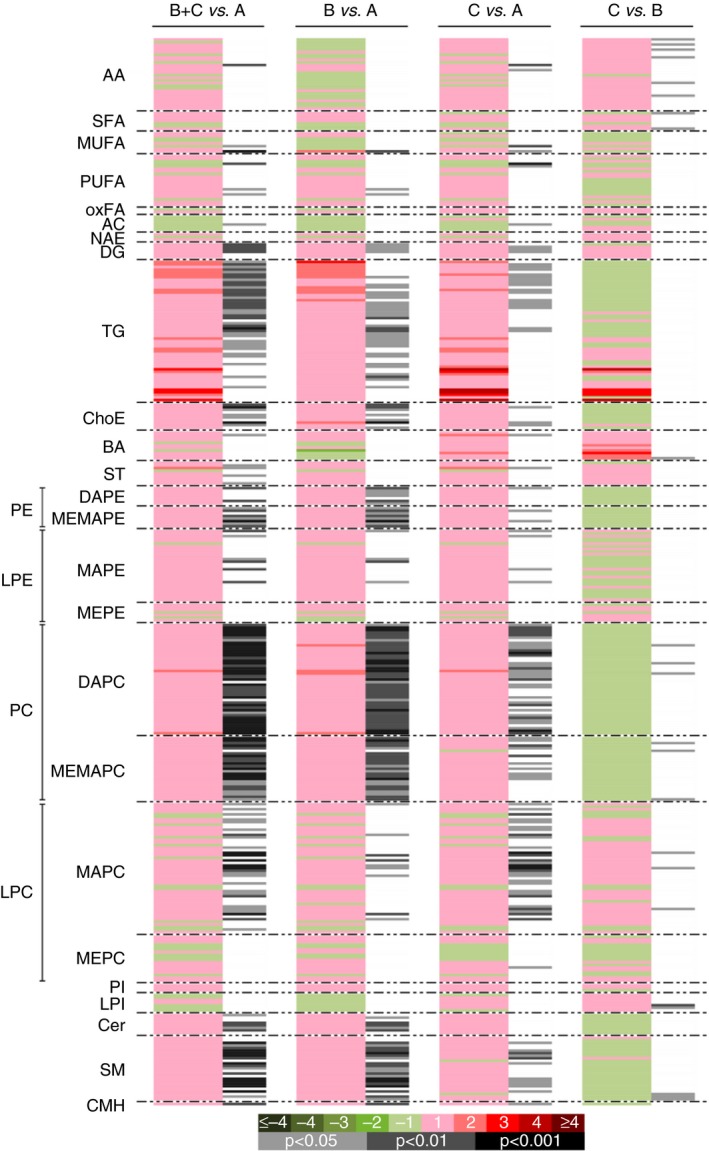
Metabolomic assessment of baseline differences among treatment arms. A, Placebo; B, 1100 mg leucine/500 mg metformin/0.5 mg sildenafil b.d.; C, 1100 mg leucine/500 mg metformin/1.0 mg sildenafil b.d. Comparisons shown are baseline of groups B+C vs A; B vs A; C vs A; and C vs B. Green sections of the heat map denote metabolites that were reduced (negative log2 fold‐changes) and red sections denote metabolites that were increased (positive log2 fold‐changes); grey/black bars indicate significant changes with treatment (light grey, P < 0.05; dark grey, P < 0.01; black, P < 0.001)
In conclusion, high‐dose NS‐0200 significantly reduced hepatic fat in NAFLD patients with elevated ALT, and correspondingly improved the NAFLD‐associated metabolomic signature. NS‐0200, either in high or low dose, did not improve hepatic fat in the ITT population, but the placebo‐treated participants exhibited an unusually high response rate. These data support further development of NS‐0200, especially high‐dose NS‐0200 in NAFLD patients with elevated ALT.
AUTHORSHIP
Guarantor of the article: Dr. N Chalasani.
Author contributions: Naga Chalasani, Mary Rinella, Michael Middleton, Claude Sirlin, Raj Vuppalanchi, Orville Kolterman, Omar Flores and Michael Zemel, study design, conduct, interpretation and manuscript preparation; Cristina Alonso, Marta Iruarrizaga‐Lejarreta and Rubén Gil‐Redondo, sample analysis, interpretation and manuscript preparation; Dr. Siddiqui and Dr Barritt, Study conduct, interpretation and manuscript preparation. All authors approved the final version of the manuscript.
Supporting information
ACKNOWLEDGEMENTS
NS‐0200 Investigator Group: Naga Chalasani, Indiana University, Indianapolis, IN, USA; Raj Vuppalanchi, Indiana University, Indianapolis, IN, USA; Mary Rinella, Northwestern University, Chicago, IL, USA; Mohammad S. Siddiqui, Virginia Commonwealth University, Richmond, VA, USA; A. Sidney Barritt IV, University of North Carolina, Chapel Hill, NC, USA; Giriprasadarao Korivi, Premier Medical Group, Clarksville, TN, USA; Rohit Loomba, University of California, San Diego, CA, USA; Aasim Sheikh, Gastrointestinal Specialists of Georgia, Marietta, GA, USA; Mia K. Moon, Catalina Research Institute, Chino, CA, USA; Ziad Younes, Gastro One, Germantown, TN, USA; Robert Herring, Quality Medical Research, Nashville, TN, USA; Norman Gitlin, Atlanta Gastroenterology Associates, Atlanta, GA, USA; Matthew Wenker, Sterling Research Group, Cincinnati, OH, USA; John S. Goff, Rocky Mountain Clinical Research, Wheat Ridge, CO, USA. The authors thank Ms. Emily R. Smith for her secretarial assistance with the manuscript.
Declaration of personal interests: Dr. Chalasani received consulting fees from NuSirt Biopharma to advise on its NASH development program. Dr. Rinella received consulting fees from NuSirt Biopharma to advise on its NASH development program. Omar Flores, and Michael Zemel are employees of NuSirt Biopharma. Cristina Alonso, Marta Iruarrizaga‐Lejarreta and Rubén Gil‐Redondo are employees of OWL Metabolomics.
Declaration of funding interests: This study is funded by NuSirt Biopharma.
Chalasani N, Vuppalanchi R, Rinella M, et al. Randomised clinical trial: a leucine‐metformin‐sildenafil combination (NS‐0200) vs placebo in patients with non‐alcoholic fatty liver disease. Aliment Pharmacol Ther. 2018;47:1639–1651. https://doi.org/10.1111/apt.14674
The Handling Editor for this article was Professor Stephen Harrison, and it was accepted for publication after full peer‐review.
N. Chalasani and M. B. Zemel are the Co‐corresponding authors for this article.
Contributor Information
N. Chalasani, Email: nchalasa@iu.edu.
M. B. Zemel, Email: mzemel@nusirt.com.
REFERENCES
- 1. Chalasani N, Younossi Z, Lavine JE, et al. The diagnosis and management of nonalcoholic fatty liver disease: practice guidance from the American Association for the Study of Liver Diseases. Hepatology. 2017;67:328‐357. [DOI] [PubMed] [Google Scholar]
- 2. Younossi ZM, Koenig AB, Abdelatif D, Fazel Y, Henry L, Wymer M. Global epidemiology of nonalcoholic fatty liver disease – Meta‐analytic assessment of prevalence, incidence, and outcomes. Hepatology. 2016;64:73‐84. [DOI] [PubMed] [Google Scholar]
- 3. Vernon G, Baranova A, Younossi ZM. Systematic review: the epidemiology and natural history of non‐alcoholic fatty liver disease and non‐alcoholic steatohepatitis in adults. Aliment Pharmacol Ther. 2011;34:274‐285. [DOI] [PubMed] [Google Scholar]
- 4. Buzzetti E, Pinzani M, Tsochatzis EA. The multiple‐hit pathogenesis of non‐alcoholic fatty liver disease (NAFLD). Metabolism. 2016;65:1038‐1048. [DOI] [PubMed] [Google Scholar]
- 5. Albano E, Mottaran E, Occhino G, Reale E, Vidali M. Review article: role of oxidative stress in the progression of non‐alcoholic steatosis. Aliment Pharmacol Ther. 2005;22:71‐73. [DOI] [PubMed] [Google Scholar]
- 6. Wong RJ, Liu B, Bhuket T. Significant burden of nonalcoholic fatty liver disease with advanced fibrosis in the US: a cross‐sectional analysis of 2011‐2014 National Health and Nutrition Examination Survey. Aliment Pharmacol Ther. 2017;46:974‐980. [DOI] [PubMed] [Google Scholar]
- 7. Ozturk ZA, Kadayifci A. Insulin sensitizers for the treatment of non‐alcoholic fatty liver disease. World J Hepatol. 2014;6:199‐206. [DOI] [PMC free article] [PubMed] [Google Scholar]
- 8. Sanyal AJ, Chalasani N, Kowdley KV, et al. Pioglitazone, vitamin E, or placebo for nonalcoholic steatohepatitis. N Engl J Med. 2010;362:1675‐1685. [DOI] [PMC free article] [PubMed] [Google Scholar]
- 9. Van Wagner LB, Rinella ME. The role of insulin‐sensitizing agents in the treatment of nonalcoholic steatohepatitis. Therap Adv Gastroenterol. 2011;4:249‐263. [DOI] [PMC free article] [PubMed] [Google Scholar]
- 10. Ratziu V, Giral P, Jacqueminet S, et al. Rosiglitazone for nonalcoholic steatohepatitis: one‐year results of the randomized placebo‐controlled fatty liver improvement with rosiglitazone therapy (FLIRT) trial. Gastroenterology. 2008;135:100‐110. [DOI] [PubMed] [Google Scholar]
- 11. Rinella ME, Sanyal AJ. Management of NAFLD: a stage‐based approach. Nat Rev Gastroenterol Hepatol. 2016;13:196‐205. [DOI] [PubMed] [Google Scholar]
- 12. Hou X, Xu S, Maitland‐Toolan K, et al. SIRT1 regulates hepatocyte lipid metabolism through activating AMP‐activated protein kinase. J Biol Chem. 2008;283:20015‐20026. [DOI] [PMC free article] [PubMed] [Google Scholar]
- 13. Pfluger PT, Herranz D, Velasco‐miguel S, Serrano M, Tscho MH. Sirt1 protects against high‐fat diet‐induced. PNAS. 2008;105:9793‐9798. [DOI] [PMC free article] [PubMed] [Google Scholar]
- 14. Banerjee J, Bruckbauer A, Zemel MB. Activation of the AMPK/Sirt1 pathway by a leucine–metformin combination increases insulin sensitivity in skeletal muscle, and stimulates glucose and lipid metabolism and increases life span in Caenorhabditis elegans. Metabolism. 2016;65:1‐13. [DOI] [PubMed] [Google Scholar]
- 15. Bruckbauer A, Banerjee J, Fu L, et al. A combination of leucine, metformin, and sildenafil treats nonalcoholic fatty liver disease and steatohepatitis in Mice. Int J Hepatol. 2016;2016:9185987. [DOI] [PMC free article] [PubMed] [Google Scholar]
- 16. Fu L, Bruckbauer A, Li F, et al. Interaction between metformin and leucine in reducing hyperlipidemia and hepatic lipid accumulation in diet‐induced obese mice. Metabolism. 2015;64:1426‐1434. [DOI] [PubMed] [Google Scholar]
- 17. Cantó C, Gerhart‐Hines Z, Feige JN, et al. AMPK regulates energy expenditure by modulating NAD+ metabolism and SIRT1 activity. Nature. 2009;458:1056‐1060. https://doi.org/10.1038/nature07813 [DOI] [PMC free article] [PubMed] [Google Scholar]
- 18. Chalkiadaki A, Guarente L. High‐fat diet triggers inflammation‐induced cleavage of SIRT1 in adipose tissue to promote metabolic dysfunction. Cell Metab. 2012;16:180‐188. [DOI] [PMC free article] [PubMed] [Google Scholar]
- 19. Xu F, Gao Z, Zhang J, et al. Lack of SIRT1 (Mammalian Sirtuin 1) activity leads to liver steatosis in the SIRT1 + /‐ mice: a role of lipid mobilization and inflammation. Endocrinology. 2010;151:2504‐2514. [DOI] [PMC free article] [PubMed] [Google Scholar]
- 20. Purushotham A, Schug TT, Xu Q, Surapureddi S, Guo X, Li X. Hepatocyte‐specific deletion of SIRT1 alters fatty acid metabolism and results in hepatic steatosis and inflammation. Cell Metab. 2009;9:327‐338. [DOI] [PMC free article] [PubMed] [Google Scholar]
- 21. Li Y, Wong K, Giles A, et al. Hepatic SIRT1 attenuates hepatic steatosis and controls energy balance in mice by inducing fibroblast growth factor 21. Gastroenterology. 2014;146:539‐547. [DOI] [PMC free article] [PubMed] [Google Scholar]
- 22. Gariani K, Menzies KJ, Ryu D, et al. Eliciting the mitochondrial unfolded protein response via NAD + repletion reverses fatty liver disease. Hepatology. 2016;63:1190‐1204. [DOI] [PMC free article] [PubMed] [Google Scholar]
- 23. Bruckbauer A, Zemel MB, Thorpe T, et al. Synergistic effects of leucine and resveratrol on insulin sensitivity and fat metabolism in adipocytes and mice. Nutr Metab (Lond). 2012;9:77. [DOI] [PMC free article] [PubMed] [Google Scholar]
- 24. Bruckbauer A, Zemel MB. Synergistic effects of polyphenols and methylxanthines with Leucine on AMPK/Sirtuin‐mediated metabolism in muscle cells and adipocytes. PLoS ONE. 2014;9:e89166. [DOI] [PMC free article] [PubMed] [Google Scholar]
- 25. Fu L, Bruckbauer A, Li F, et al. Leucine amplifies the effects of metformin on insulin sensitivity and glycemic control in diet‐induced obese mice. Metabolism. 2015;64:845‐856. [DOI] [PubMed] [Google Scholar]
- 26. Bruckbauer A, Zemel MB. Synergistic effects of metformin, resveratrol, and hydroxymethylbutyrate on insulin sensitivity. Diabetes Metab Syndr Obes. 2013;6:93‐102. [DOI] [PMC free article] [PubMed] [Google Scholar]
- 27. Niswender K, Kolterman O, Kosinski M, Zemel MB. The effects of leucine‐metformin combinations on glycemic control in type 2 diabetes. Diabetes. 2016;65:1144. [Google Scholar]
- 28. Fu L, Bruckbauer A, Li F, et al. Interaction between metformin and leucine in reducing hyperlipidemia and hepatic lipid accumulation in diet‐induced obese mice. Metabolism. 2015:1‐9. [DOI] [PubMed] [Google Scholar]
- 29. Fu L, Li F, Bruckbauer A, et al. Interaction between leucine and phosphodiesterase 5 inhibition in modulating insulin sensitivity and lipid metabolism. Diabetes Metab Syndr Obes. 2015;8:227‐239. [DOI] [PMC free article] [PubMed] [Google Scholar]
- 30. Middleton M, Kosinski M, Flores O, Zemel B, Sirlin C. Agreement of six‐ and composite three‐echo magnitude PDFF‐estimation MRI sequences in a multi‐center clinical trial. RSNA Poster Sess. 2016. Accessed November 20, 2017.
- 31. Schwimmer JB, Middleton MS, Deutsch R, Lavine JE. A phase 2 clinical trial of metformin as a treatment for non‐diabetic paediatric non‐alcoholic steatohepatitis. Aliment Pharmacol Ther. 2005;21:871‐879. [DOI] [PubMed] [Google Scholar]
- 32. Bydder M, Yokoo T, Hamilton G, et al. Relaxation effects in the quantification of fat using gradient echo imaging. Magn Reson Imaging. 2008;26:347‐359. https://doi.org/10.1038/nn.2120.Red-shifted [DOI] [PMC free article] [PubMed] [Google Scholar]
- 33. Yokoo T, Collins JM, Hanna RF, Bydder M, Middleton MS, Sirlin CB. Effects of intravenous gadolinium administration and flip angle on the assessment of liver fat signal fraction with opposed‐phase and in‐phase imaging. J Magn Reson Imaging. 2008;28:246‐251. [DOI] [PubMed] [Google Scholar]
- 34. Yokoo T, Bydder M, Hamilton G, et al. Nonalcoholic fatty liver disease : diagnostic and fat‐grading accuracy of low‐flip‐angle multiecho gradient‐recalled‐echo MI imaging at 1.5 T. Radiology. 2009;251:67‐76. [DOI] [PMC free article] [PubMed] [Google Scholar]
- 35. Yokoo T. Estimation of hepatic proton‐ density fat fraction by using MR imaging at 3T. Radiology. 2011;258:749‐759. [DOI] [PMC free article] [PubMed] [Google Scholar]
- 36. Middleton M, Haufe W, Hooker J, et al. Quantifying abdominal adipose tissue and thigh muscle volume and hepatic proton density fat fraction: repeatability and accuracy of an MR imaging‐based semiautomated analysis method. Radiology. 2017;283:438‐449. [DOI] [PMC free article] [PubMed] [Google Scholar]
- 37. Hamilton G, Yokoo T, Bydder M, et al. In vivo characterization of the liver fat 1 H MR spectrum. NMR Biomed. 2011;00:24. [DOI] [PMC free article] [PubMed] [Google Scholar]
- 38. Middlelton M, Henderson W, Cui J, et al. A quantitative imaging biomarker assessment metric for MRI‐estimated proton density fat fraction. Hepatology. 2017;66:2110. [Google Scholar]
- 39. Barr J, Caballería J, Martínez‐Arranz I, et al. Obesity‐dependent metabolic signatures associated with nonalcoholic fatty liver disease progression. J Proteome Res. 2012;11:2521‐2532. [DOI] [PMC free article] [PubMed] [Google Scholar]
- 40. Martínez‐Arranz I, Mayo R, Pérez‐Cormenzana M, et al. Enhancing metabolomics research through data mining. J Proteomics. 2015;127:275‐288. [DOI] [PubMed] [Google Scholar]
- 41. Verma S, Jensen D, Hart J, Mohanty SR. Predictive value of ALT levels for non‐alcoholic steatohepatitis (NASH) and advanced fibrosis in non‐alcoholic fatty liver disease (NAFLD). Liver Int. 2013;33:1398‐1405. [DOI] [PubMed] [Google Scholar]
- 42. Abd A, Salman A, Abd S, Aboelfadl E, Abd M, Heagzy E. New era for usage of serum liver enzymes as a promising horizon for the prediction of non‐alcoholic fatty liver disease. Maced J Med Sci. 2016;4:348‐352. [DOI] [PMC free article] [PubMed] [Google Scholar]
- 43. Ratziu V, Harrison SA, Francque S, et al. Elafibranor, an agonist of the peroxisome proliferator‐activated receptor‐α and‐δ, induces resolution of nonalcoholic steatohepatitis without fibrosis worsening. Gastroenterology. 2016;150:1147‐1159.e5. [DOI] [PubMed] [Google Scholar]
- 44. Cui J, Philo L, Nguyen P, et al. Sitagliptin versus placebo in the treatment of nonalcoholic fatty liver disease: a randomized controlled trial. J Hepatol. 2016;65:369‐376. [DOI] [PMC free article] [PubMed] [Google Scholar]
- 45. Smits MM, Tonneijck L, Muskiet MHA, et al. Twelve week liraglutide or sitagliptin does not affect hepatic fat in type 2 diabetes: a randomised placebo‐controlled trial. Diabetologia. 2016;. https://doi.org/10.1007/s00125-016-4100-7 [DOI] [PMC free article] [PubMed] [Google Scholar]
- 46. Le TA, Chen J, Changchien C, et al. Effect of colesevelam on liver fat quantified by magnetic resonance in nonalcoholic steatohepatitis: a randomized controlled trial. Hepatology. 2012;56:922‐932. https://doi.org/10.1002/hep.25731 [DOI] [PMC free article] [PubMed] [Google Scholar]
- 47. Loomba R, Sirlin CB, Ang B, et al. Ezetimibe for the treatment of nonalcoholic steatohepatitis: assessment by novel MRI and MRE in a randomized trial (MOZART Trial). Hepatology. 2015;61:1239‐1250. [DOI] [PMC free article] [PubMed] [Google Scholar]
- 48. Elango R, Chapman K, Rafii M, Ball RO, Pencharz PB. Determination of the tolerable upper intake level of leucine in acute dietary studies in young men. Am J Clin Nutr. 2012;96:759‐767. [DOI] [PubMed] [Google Scholar]
- 49. Colak Y, Ozturk O, Senates E, et al. SIRT1 as a potential therapeutic target for treatment of nonalcoholic fatty liver disease. Med Sci Monit. 2011;17:5‐9. [DOI] [PMC free article] [PubMed] [Google Scholar]
- 50. Tateya S, Rizzo NO, Handa P, et al. Endothelial NO/cGMP/VASP signaling attenuates Kupffer cell activation and hepatic insulin resistance induced by high‐fat feeding. Diabetes. 2011;60:2792‐2801. [DOI] [PMC free article] [PubMed] [Google Scholar]
- 51. Nozaki Y, Fujita K, Wada K, et al. Deficiency of eNOS exacerbates early‐stage NAFLD pathogenesis by changing the fat distribution. BMC Gastroenterol. 2015;15:177. [DOI] [PMC free article] [PubMed] [Google Scholar]
- 52. Idilman R, Mizrak D, Corapcioglu D, et al. Clinical trial: insulin‐sensitizing agents may reduce consequences of insulin resistance in individuals with non‐alcoholic steatohepatitis. Aliment Pharmacol Ther. 2008;28:200‐208. [DOI] [PubMed] [Google Scholar]
- 53. Haukeland JW, Konopski Z, Eggesbø HB, et al. Metformin in patients with non‐alcoholic fatty liver disease: a randomized, controlled trial. Scand J Gastroenterol. 2009;44:853‐860. [DOI] [PubMed] [Google Scholar]
- 54. Uygun A, Kadayifci A, Isik AT, et al. Metformin in the treatment of patients with non‐alcoholic steatohepatitis. Aliment Pharmacol Ther. 2004;19:537‐544. [DOI] [PubMed] [Google Scholar]
- 55. Shields WW, Thompson KE, Grice GA, Harrison SA, Coyle WJ. The effect of metformin and standard therapy versus standard therapy alone in nondiabetic patients with insulin resistance and nonalcoholic steatohepatitis (NASH): a pilot trial. Therap Adv Gastroenterol. 2009;2:157‐163. [DOI] [PMC free article] [PubMed] [Google Scholar]
- 56. Omer Z, Cetinkalp S, Akyildiz M, et al. Efficacy of insulin‐sensitizing agents in nonalcoholic fatty liver disease. Eur J Gastroenterol Hepatol. 2010;22:18‐23. [DOI] [PubMed] [Google Scholar]
- 57. Doycheva I, Loomba R. Effect of metformin on ballooning degeneration in nonalcoholic steatohepatitis (NASH): when to use metformin in nonalcoholic fatty liver disease (NAFLD). Adv Ther. 2014;31:30‐43. [DOI] [PubMed] [Google Scholar]
- 58. Lavine JE, Schwimmer JB, van Natta ML. Effect of vitamin E or metformin for treatment of nonalcoholic fatty liver disease in children and adolescents: the TONIC randomized controlled trial. JAMA. 2011;305:1659‐1668. [DOI] [PMC free article] [PubMed] [Google Scholar]
- 59. Giuliano F, Jackson G, Montorsi F, et al. Safety of sildenafil citrate: review of 67 double‐blind placebo‐controlled trials and the postmarketing safety database. Int J Clin Pract. 2010;64:240‐255. [DOI] [PMC free article] [PubMed] [Google Scholar]
- 60. El‐Mahmoudy A, Shousha S, Abdel‐Maksoud H, Abouzaid O. Effect of long‐term administration of sildenafil on lipid profile and organ functions in hyperlipidemic rats. Acta Biomed. 2013;84:12‐22. [PubMed] [Google Scholar]
Associated Data
This section collects any data citations, data availability statements, or supplementary materials included in this article.
Supplementary Materials