

Abstract
Sperm must mature functionally in the process of capacitation to become able to fertilize. Capacitation depends on membrane lipid changes, and can be quantitatively assessed by redistribution of the ganglioside GM1, the basis of the Cap‐Score™ sperm function test. Here, differences in Cap‐Score were compared among and within men at two time points. Ejaculates were liquefied, washed, and incubated for 3 hr under capacitating (Cap) conditions, then fixed and analyzed immediately (Day0); after being incubated 3 hr under Cap conditions then maintained 22–24 hr in fix (Day1‐fix); or after 22–24 hr incubation under Cap conditions prior to fixation (Day1). In all cases, a light fixative previously shown to allow membrane lipid movements was used. Day1‐fix and Day1 Cap‐Scores were greater than Day0 (p < 0.001; n = 25), whereas Day1‐fix and Day1 Cap‐Scores were equivalent (p = 0.43; n = 25). In 123 samples from 52 fertile men, Cap‐Score increased more than 1SD (7.7; calculated previously from a fertile cohort) from Day0 to Day1‐fix in 44% (54/123) of the samples. To test whether timing of capacitation was consistent within an individual, 52 samples from 11 fertile men were classified into either “early” or “late” capacitation groups. The average capacitation group concordance within a donor was 81%. Median absolute deviation (MAD; in Cap‐Score units) was used to assess the tightness of clustering of the difference from Day0 to Day1‐fix within individuals. The average (2.21) and median (1.98) MAD confirmed consistency within individuals. Together, these data show that the timing of capacitation differed among men and was consistent within men.
Keywords: Cap‐Rate™, Cap‐Score™, fertilitzation, GM1, reproduction
Abbreviations
- Cap‐Score
Cap‐Score™ sperm function test
- CTB
cholera toxin beta subunit
- GM1
monosialotetrahexosylganglioside
- [Non‐] Cap
incubated [without] with capacitation stimuli
1. INTRODUCTION
Immediately following ejaculation, human sperm lack the ability to fertilize. This ability is commonly acquired through interactions with the female reproductive tract. Across mammalian species, the time‐dependent acquisition of fertilization competence is known collectively as “capacitation” (Austin, 1951, 1952; Chang, 1955, 1951). The most precise endpoint used to assess capacitation is demonstrated ability to participate in fertilization (Yanagimachi, 1994); however, this is impractical in humans because of ethical reasons and is impractical in other species because of cost. Instead, the completion of capacitation at a single cell level has historically been assessed by a sperm's ability to undergo acrosome exocytosis (AE), or at a population level by looking at relative amounts of protein tyrosine phosphorylation events (Visconti & Kopf, 1998; Visconti, Bailey, et al., 1995; Visconti, Moore, et al., 1995).
Recently, we defined representative patterns of localization of the ganglioside GM1 that could be used to identify capacitated human sperm at the single cell level (Moody et al., 2017) and quantitatively provide information at the population level (Cardona et al., 2017). Based on multiple lines of investigation regarding these patterns, including the observation that sperm having “capacitated” patterns were in fact those cells that could undergo AE, and demonstrations of the precision and repeatability of the assay (Moody et al., 2017), we defined the Cap‐Score™ as the percentage of sperm having GM1 localization patterns consistent with capacitation in relation to the total number of sperm having GM1 localization patterns. These findings were consistent with earlier findings in the mouse and bull (Selvaraj et al., 2007), but more importantly, they had clinical relevance.
In an independently‐performed clinical study that was included in the recent papers, Cap‐Scores™ over a certain threshold were highly correlated with paternity by natural conception or within three or fewer cycles of intrauterine insemination, while those below that threshold were less likely to conceive (Cardona et al., 2017). Because that study was performed at a tertiary care fertility clinic with a patient base atypical for most urologists and local fertility clinics, we performed a cohort comparison trial, comparing Cap‐Scores™ in a population of 76 men with proven fertility versus 122 men questioning their fertility at a local urology center. Significantly more men questioning their fertility had Cap‐Scores™ at or below one standard deviation (SD) below the mean of the fertile men (Cardona et al., 2017). These and other studies validated the use of the Cap‐Score™ to assay sperm capacitation/function and to reflect male fertility.
Before one can determine how knowledge of capacitation status might best be used clinically, one must understand the process at a molecular level. It is known that capacitation is regulated both negatively and positively by interactions with factors in seminal plasma and the female reproductive tract. This modulation ensures that spermatozoa attain maximal fertilizing ability at the site of fertilization (Fraser, 1999). First, during epididymal transit and then ejaculation, the sperm surface interacts with components known as “decapacitation factors.” These help keep the sperm in a non‐capacitated state until they are progressively released during capacitation (Boué, Blais, & Sullivan, 1996; Fraser, Harrison, & Herod, 1990; Kawano, Yoshida, Iwamoto, & Yoshida, 2008). In concert with the release of decapacitation factors, exposure to extracellular Ca2+, HCO3 −, and mediators of sterol efflux such as HDL and/or albumin must occur (Ehrenwald, Foote, & Parks, 1990; Langlais & Roberts, 1985; Travis & Kopf, 2002). These induce one or more signal transduction pathways involving cAMP, protein kinase A (PKA), and tyrosine kinases (Visconti, Bailey, et al., 1995; Visconti, Moore, et al., 1995). In addition, removal of cholesterol decreases the cholesterol/phospholipid ratio, increasing membrane fluidity (Kopf, Visconti, & Galantino‐Homer, 1999), stimulating phospholipase B (PLB) activity (Asano, Nelson‐Harrington, & Travis, 2013), and enabling focal enrichment of GM1 (Cohen et al., 2014). In murine sperm, GM1 regulates Ca2+ transients through the CaV2.3 channel, enabling AE in response to Ca2+ waves induced by CatSper (Cohen et al., 2014).
These alterations in membrane lipids and downstream signaling are highly orchestrated, preventing premature AE and enabling fertilization competence at the right place/time. The importance of this timing of sperm capacitation cannot be over‐emphasized. Put simply, sperm must be present and capable of fertilizing when the oocyte is present, able to be fertilized, and of high enough quality to produce a viable embryo with high developmental potential (Wang & Sun, 2007). Oocytes arrested at the MII stage are usually fertilized shortly after ovulation, with the window for optimal fertilization differing among species: mouse (8–12 hr), rat (12–14 hr), and human (<24 hr) (Austin, 1974). As one would expect, the length of time it takes for sperm of different species to capacitate varies in a predictable way with the time between insemination and appearance of a fertilization competent oocyte. For example, human ejaculates have been shown to have sperm capable of undergoing AE for prolonged times, consistent with coitus occurring at various times relative to ovulation (Giojalas, Rovasio, Fabro, Gakamsky, & Eisenbach, 2004). Conversely, the ability of rabbit sperm to undergo AE peaks at 16 hr after insemination—precisely matching the timing of the rabbit oocyte in this species characterized by induced ovulation (Giojalas et al., 2004).
In addition to these differences in capacitation timing among species, differences in timing of capacitation have been reported among individuals of the same species. In a comparison of eight men, it was shown that the ability of sperm to penetrate hamster zonae pellucidae was temporally dependent upon the whole cell cholesterol:phospholipid ratio, with lower ratios being consistent with faster capacitation times (Hoshi, Aita, Yanagida, Yoshimatsu, & Sato, 1990). Although of limited sample size, this finding has intriguing clinical implications. If fertilization does not occur within the optimal time window, unfertilized oocytes remaining in the oviduct or culture will undergo a time‐dependent deterioration in quality, a process called “oocyte aging” (Miao, Kikuchi, Sun, & Schatten, 2009). If sperm are given insufficient time to complete the processes of capacitation prior to the onset of oocyte aging, the probability of generating a developmentally competent embryo will be diminished. This could have implications for technologies of assisted reproduction in which insemination (whether into the uterus or into a droplet of medium) is timed relative to the appearance of an oocyte. Because the Cap‐Score™ provides a quantitative and much more logistically practical means of assessing capacitation status than methods reliant upon zonae, we set out to use Cap‐Score™ to assess whether there were differences in the timing of capacitation among and within men.
2. RESULTS
2.1. Membrane changes associated with capacitation occur from Day0 to Day1
Semen samples from 25 men with proven fertility were incubated under basal, non‐capacitating conditions (NonCap) and under capacitating conditions (Cap) for 3 hr, then fixed (Day0); were incubated in NonCap and Cap media for 3 hr, then fixed and maintained overnight at room temperature (Day1‐fix); and were incubated for 22–24 hr in NonCap and Cap media and then fixed (Day1). A significant increase in Cap‐Score™ was observed from Day0 to Day1‐fix (p < 0.001; Figure 1) and from Day0 to Day1 (p < 0.001; Figure 1) in Cap samples. However, no difference was detected between Day1‐fix and Day1 samples incubated under Cap conditions (p = 0.43; Figure 1). These observations confirmed that the changes in membrane lipids detected by the Cap‐Score™ did occur in the presence of the light fixative, as described previously in murine sperm (Selvaraj et al., 2006), and showed that those changes occurred in the same percentage of cells as if they had just been incubated in the Cap medium.
Figure 1.
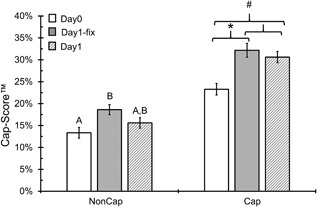
Changes in Cap‐Score™ from Day0 to Day1 reflect membrane changes that are associated with capacitation. Samples from 25 fertile donors were incubated under non‐capacitating (NonCap) and capacitating (Cap) conditions and then analyzed for Cap‐Score™ after 3 hr of incubation (Day0; white bars), after overnight incubation in a light fixative (Day1‐fix; grey bars) and after overnight incubation in physiologic media followed by fixation (Day1; patterned bars). The y‐axis shows the average Cap‐Score™ ± the standard error and the x‐axis shows the different incubation treatments. There was a significant difference between Day0 and Day1‐fix Cap samples (*p < 0.001) and between Day0 and Day1 (#p < 0.001). However, there was no difference between Day1‐fix and Day1 Cap samples (p = 0.43). Differences among NonCap samples are illustrated by different letters (p < 0.05) and show an increase in spontaneous capacitation like events from Day0 to Day1‐fix, which was not different than Day1. Samples were compared within a treatment using Fisher's LSD
2.2. Effect of incubation on acrosome exocytosis
Acquiring the ability to undergo AE is a hallmark of capacitation. As we have shown previously in murine (Selvaraj et al., 2007) and human sperm (Moody et al., 2017), the Cap‐Score™ goes down as capacitated cells undergo AE. This results from the loss of GM1 along with the hybrid plasma/outer acrosomal membrane vesicles, preventing labeling and/or resulting in atypical, “other” GM1 localization patterns, thereby decreasing Cap‐Score™ (Moody et al., 2017; Selvaraj et al., 2007). To confirm that our Cap conditions were indeed capacitating and that Cap‐Score™ was accurately reflecting these cells, we compared sperm incubated under Cap conditions versus those incubated under Cap conditions and then treated with the calcium ionophore A23187. In these samples from 10 men, we saw an increase in Cap‐Score™ from Day0 to Day1‐fix (n = 10; p = 0.03; Figure 2), as was observed in Figure 1. We also saw no difference in Cap‐Score™ between Day1‐fix and Day1 (p = 0.19; Figure 2). Consistent with expectations from our prior experiments, in which single sperm were labeled with peanut agglutinin (PNA) to assess acrosomal status (Moody et al., 2017), we observed significant decreases in Cap‐Score™ following treatment with A23187 versus sperm incubated under Cap conditions without ionophore in both Day0 (p = 0.02) and Day1 (p = 0.01) sperm (Figure 2). Note that we did not assess AE in Day1‐fix cells because of the presence of the fixative and its potential effect on proteins involved in membrane fusion.
Figure 2.

Evaluating capacitation status and acrosome exocytosis. Samples from 10 fertile men were exposed to both non‐capacitating (NonCap; white bars) and capacitating (Cap; grey bars) media and then analyzed for Cap‐Score™ after 3 hr incubation and fixation (Day0), after 3 hr incubation and then maintenance overnight in a light fixative (Day1‐fix) and after overnight incubation followed by fixation (Day1). A third treatment was done for the Day0 and Day1 samples and consisted of incubation for the designated time under Cap conditions, followed by the addition of the calcium ionophore, A23187 (Cap + Ion patterned bars). The y‐axis shows the average Cap‐Score™ and standard error, while the x‐axis shows the different incubation treatments. Preplanned comparisons were done using one‐ and two‐tailed Wilcoxon's Signed Rank Tests (Day0 Cap vs. Day0 Cap + A23187, *p = 0.02; and Day1 Cap vs. Day1 Cap + A23187, @p = 0.01). Increases in Cap‐Score™ from Day0 to Day1‐fix were consistent with those seen in Figure 2 (#p = 0.03). No difference was observed between Day1‐fix and Day1, also as consistent with Figure 2 above (p = 0.19). Differences among NonCap samples are illustrated by different letters (p < 0.05; Nemenyi's procedure for multiple comparisons)
Although the kinetics of AE triggered by calcium ionophore and progesterone are similar (Sosa et al., 2015), it is generally accepted that progesterone is more physiologically relevant. To further investigate whether Cap‐Score™ reflects the capacitation status and ability to undergo exocytosis, we compared the Cap‐Score™ for sperm samples incubated under Cap conditions only and Cap conditions followed by treatment with progesterone (Figure 3). In the 11 samples for Day0 and 10 observations for Day1, there was a decrease in Cap‐Score™ in response to the addition of the progesterone (Day0 p < 0.01; Day1 p = 0.02). These results are consistent with both our previously published data (Moody et al., 2017) and the above data with ionophore, demonstrating that sperm with GM1 localization patterns associated with response to capacitating stimuli were indeed capacitated and capable of undergoing stimulated AE.
Figure 3.
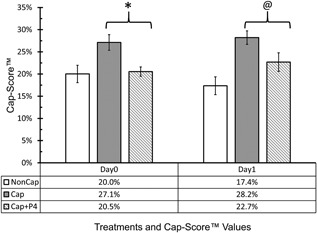
Evaluating capacitation status and acrosome exocytosis using progesterone. Semen samples were exposed to both non‐capacitating (NonCap; White Bars) and capacitating (Cap; Gray Bars) media and then analyzed for Cap‐Score after 3 hr incubation (Day0), and after overnight incubation (Day1). A third treatment consisted of incubation for the designated time under Cap conditions, followed by the addition of Progesterone (Cap + P4; Patterned Bars). Eleven samples were used for Day0 and 10 samples were used for Day1. There were seven ejaculates having sufficient sperm numbers to do all time points and conditions. The y‐axis shows the average Cap‐Score and standard error, while the x‐axis shows the different incubation treatments. Preplanned comparisons were done using one tailed Wilcoxon's Signed Rank Tests (Day0 Cap vs. Day0 Cap + P4, *p < 0.01; and Day1 Cap vs. Day1 Cap + P4, @p = 0.02)
2.3. Cap‐Score™ changes differentially among men
To evaluate whether Cap‐Score™ would change equally with time among men, we determined the Cap‐Score™ for both Day0 and Day1‐fix treatments in 123 samples from 52 donors with proven fertility (Figure 4a). Cap‐Score™ increased from Day0 to Day1‐fix in 84% (103/123). When the average difference from Day0 to Day1‐fix was calculated for each donor, 94% of the individuals showed an increase in Cap‐Score™ (49/52) (Figure 4b). To put these changes into context, we compared the magnitude of the changes in Figure 4 against data we previously collected from 76 fertile men, for whom 7.7 Cap‐Score™ units defined 1 SD in the Cap‐Scores™ which had a normal distribution (Cardona et al., 2017). We found that 44% (54/123) of the Day1‐fix samples had Cap‐Scores™ that increased more than 1SD from the Cap‐Score™ reported after the 3 hr, Day0, incubation. These data supported the existence of substantial changes in capacitation over time that differed among men. For the sake of clarity of writing and understanding, we define Cap‐Rate™ as the difference in Cap‐Score™ from Day0 to Day1‐fix.
Figure 4.

Changes in Cap‐Score™ from Day0 to Day1‐fix revealed a difference in capacitation timing. Cap‐Score™ was assessed for both Day0 (after a 3 hr incubation) and Day1‐fix, on 123 samples from 52 fertile donors. (a) The x‐axis shows the sample number and the y‐axis shows the Cap‐Score™, with the dumbbell plot connecting the values for Day0 and Day1‐fix within a sample. Out of 123 samples, 84% had an increase in Cap‐Score™ from Day0 to Day1‐fix (103/123). A total of 44% (54/123) of the population had an increase in Cap‐Score™ greater than 1 SD (7.7%) defined previously in a population of men with proven fertility (Cardona et al., 2017). (b) The x‐axis shows the donor number and the y‐axis show the average Cap‐Rate™ of each donor (difference Day1‐fix−Day0). Out of 52 donors, 94% had an increase in Cap‐Score™ from Day0 to Day1‐fix (49/52). A total of 42% (22/52) of the population had an average Cap‐Score™ increase greater than 1 SD (7.7%)
2.4. Cap‐Rate™ consistency within men
Although differences in capacitation timing among individual men are known within the literature (Hoshi et al., 1990), it remains unclear whether these differences are consistent within repeated ejaculates from the same individual. For this evaluation, Cap‐Rate™ was determined for 52 samples from 11 fertile donors, with at least four samples per donor. “Early” and “late” capacitation groups were defined based on the Cap‐Rate™ being less than (early) or greater than (late) 1 SD (7.7) as defined previously in a population of 76 men of known fertility (Cardona et al., 2017). The percent concordance in capacitation group was calculated for each donor (Figure 5). The average (81%) and median (83%) concordance were greater than 50% (p < 0.001), demonstrating that Cap‐Rate™ tended to be consistent within individuals. While concordance of grouping demonstrates consistency, it does not accurately reflect individuals who might have tightly clustered results but which lie on either side of that artificial classification into “early” versus “late,” or men who might have samples differing widely in Cap‐Rates™ but which all lie on one side of that divide. To investigate the tightness of clustering of repeated Cap‐Rates™ within individual men, we calculated the median absolute deviation (MAD) for each donor. The average MAD of 2.21 and median MAD of 1.98 both confirmed that Cap‐Rates™ were reproducible within individuals. This builds upon our previous findings of high reproducibility in Cap‐Scores™ in repeated samples from a group of 30 men of known fertility (Cardona et al., 2017), showing consistency in timing as well as absolute score.
Figure 5.

Cap‐Rate™ was consistent within men. Cap‐Scores™ were obtained on Day0 and Day1‐fix for 52 samples from 11 fertile donors, with at least four samples per donor. (a) The y‐axis shows the difference in Cap‐Score™ from Day1‐fix to Day0 within a sample and the x‐axis shows the donor number. The horizontal dotted line denotes a difference of 7.7% (1 SD), which was used to classify samples into early (black dot) and late (gray dot) capacitation groups. The percent concordance was calculated for each donor. For example, donor 1 had 100% late concordance (4/4 samples), while donor 6 had 75% early concordance (3/4 samples). (b) The scatter plot shows the distribution of concordance among donors, with each donor being represented by a single diamond. The average (81%; black plus sign) and median (83%; black line) concordance demonstrate that Cap‐Rate™ was consistent within individuals. (c) The median absolute deviation (MAD) for the Cap‐Rates™ was calculated within a donor (MAD = median (|xi‐median(x)| where xi is the observed difference for a given collection). The scatter plot shows the distribution of MAD among donors with each donor being represented by a single diamond. The average (2.21) and median (1.98) MAD are shown by a black plus sign and line, respectively. These data show consistency of Cap‐Rate™ within men
2.5. Differences in Cap‐Rate™ among sub‐fertile/infertile men
Thus far, Cap‐Rate™ was evaluated in men of proven fertility. To determine whether differences in timing of capacitation also occurred in men questioning their fertility, Cap‐Score™ was assessed for both Day0 and Day1‐fix conditions on samples obtained from 17 men seeking fertility evaluation (Figure 6). Using the classifications defined above, 29% (5/17) of this population was placed into the late capacitation group. For comparison, 42% (22/52) of the men from the normal fertile population showed similar characteristics (Figure 4b), which is not different from the sub‐fertile/infertile population (p = 0.49).
Figure 6.

Cap‐Rate™ in a population of sub‐fertile/infertile men. Cap‐Score™ was assessed on both Day0 and Day1‐fix for single samples obtained from 17 men questioning their fertility. The x‐axis shows the donor number and the y‐axis shows Cap‐Score™, with the dumbbell plot connecting the values for Day0 to Day1‐fix within a donor. A total of 29% (5/17) of the population had an increase in Cap‐Score™ from Day0 to Day1‐fix that was greater than 1 SD (7.7%) calculated previously from a population of 76 fertile men (Cardona et al., 2017)
3. DISCUSSION
Our data show that the timing of capacitation differed among men, and was consistent within men. The exact cause/cellular mechanism to account for this difference in timing is beyond the scope of the current report, but several lines of evidence point to a central role for lipids. Multiple studies have established that the concentration of cholesterol in the sperm plasma membrane varies considerably among species. The cholesterol to phospholipid molar ratios for isolated plasma membrane fractions are about 0.20 in boar sperm (Parks & Lynch, 1992), 0.36 in stallion sperm (Parks & Lynch, 1992), about 0.40 in bovine sperm (Parks, Arion, & Foote, 1987), 0.43 in ram sperm (Parks & Hammerstedt, 1985), and 0.83 in human sperm (Mack, Everingham, & Zaneveld, 1986). Remarkably, cholesterol to phospholipid ratios tightly correlate with capacitation timing across mammals (Davis, 1981), including in humans (Hoshi et al., 1990). Although the number of men whose samples were analyzed in the study by Hoshi et al. (1990) was low (n = 8), they found that sperm with a high cholesterol to phospholipid ratio were slower to capacitate (as assessed by penetration of zona‐free hamster oocytes) than sperm with a lower ratio. It is intriguing to consider whether relative lipid ratios might contribute to differences in timing of capacitation and through that, to infertility in humans.
In support of this possibility, the cholesterol to phospholipid ratio in sperm of patients with unexplained infertility is about twice that of fertile donors (Sugkraroek, Kates, Leader, & Tanphaichitr, 1991). Sperm of normospermic men who failed to fertilize eggs in vitro were found to be characterized by abnormally high cholesterol content, or by a slow loss, or even an increase in cholesterol during in vitro incubation (Benoff et al., 1993). Why/how the lipid composition of sperm varies among men is unclear. No correlation seems to exist between cholesterol or phospholipid levels found in blood serum and that found in sperm or seminal plasma, suggesting a local regulation within the male reproductive tract (Grizard, Sion, Jouanel, Benoit, & Boucher, 1995).
That a high relative cholesterol content might interfere with fertility makes sense in terms of directly making the plasma membrane more rigid and less fusogenic with the outer acrosomal membrane, or indirectly by reducing PLB activity and/or by reducing the ability of GM1 to regulate Ca2+ influx, as described above. However, the timing of capacitation for the sperm of a given man might also impact his fertility status. It is essential that sperm and eggs both are fertilization competent and in the same place at the same time for successful conception. Because coitus in humans is not tightly linked to the time of ovulation, one would predict that there is no inherent benefit or deficit associated with having sperm capacitate relatively early or late. Studies of timing of intercourse show that conception occurs in a 6‐day window ending on the day of ovulation (Wilcox, Weinberg, & Baird, 1995), meaning that natural conception very likely occurs both with sperm that we would have defined as early and late capacitators.
Indeed, here we found that in men with proven fertility and in those pursuing medical work‐ups because they question their fertility, there were roughly similar ratios of individuals having sperm that capacitated relatively early or late. However, one might imagine that couples trying to time coitus relative to ovulation might introduce a systematic bias in their approach that effectively reduces their fertility if they do not have knowledge of the timing of capacitation for that individual man. This problem might be worsened in couples using assisted reproduction, in which timing of intrauterine insemination is usually standardized relative to ovulation, or in which the amount of time given for fertilization in classical in vitro fertilization (IVF) is also standardized.
Because the Cap‐Rate™ was consistent among ejaculates within individuals, this information could potentially be used to optimize insemination timing in procedures such as IUI, IVF, and natural conception leading to personalized management of infertility (Figure 7). Currently, IUI is most often performed within 24‐36 hrs after hCG injection, and ovulation can occur over a window of time (26–46 hrs), with an average of approximately 38 hrs after the hCG injection (Andersen, Als‐Nielsen, Hornnes, & Franch Andersen, 1995; Testart, Thebault, Souderes, & Frydman, 1982). Oocytes are believed to be fertilization competent for less than 24 hr after ovulation (Austin, 1974; Miao et al., 2009). Thus, inseminations occurring around or after the time of ovulation will introduce a selective bias against men whose sperm take longer to capacitate. Most work comparing the relative efficacy of different timings of IUI concentrate on times after the hCG injection (AboulGheit, 2010). Of note, a retrospective study comparing outcomes of 228 cycles of IUI with hCG administered before insemination against 104 cycles of IUI with hCG administered after insemination, found that the latter approach resulted in almost a doubling of IUI success (10.9% vs. 19.6%; Jarvela, Tapanainen, & Martikainen, 2010). In an alternative scenario, perhaps individuals identified as having delayed capacitation could have their sperm treated at the time of insemination to hasten capacitiation. Several substances, such as fertilization promoting peptide and calcitonin have been shown to stimulate capacitation while concomitantly inhibiting loss due to spontaneous AE (Fraser & Adeoya‐Osiguwa, 2001; Fraser & Osiguwa, 2004). By accelerating the onset/completion of capacitation in late capacitators, in theory, a greater proportion of the sperm could be functionally synchronized with the oocyte to achieve fertilization through IUI.
Figure 7.

Current and future algorithms of the IUI process. Currently, IUI is most often performed 24–36 hr after hCG injection. However, few if any techniques are available to identify the significant proportion of couples that will fail this treatment repeatedly and eventually be directed to IVF/ICSI. Use of Cap‐Score™ in conjunction with semen analysis (SA) can identify men that have defects in capacitation/sperm function and thus are destined to fail IUI. These individuals would be directed immediately to IVF/ICSI, preventing the emotional, physical, and financial costs associated with failed cycles. Those individuals that pass the Cap‐Score™ could be further differentiated into “Early” or “Late” capacitation groups using Cap‐Rate™. This classification could help determine whether the man's semen should be inseminated into the patient earlier than 24 hr after hCG injection (favoring late capacitators) or following the current protocol of inseminating 24–36 hr post hCG (favoring early capacitators). If it takes a patient's sperm 24 hr to reach optimal capacitation status (i.e., the man exhibits late capacitation), the common practice of inseminating at 36 hr, close to the time of ovulation, might have reduced success because by the time the sperm cells are fully capacitated, the egg may no longer be viable. Knowledge of the ability of sperm to capacitate and of the timing of capacitation, could thus be used to personalize both the most appropriate technology of assisted reproduction and the optimal timing with which that procedure would be performed
It is known that a significant proportion of couples fail this treatment repeatedly and are eventually directed to IVF/ICSI (Guzick et al., 2001; Ombelet et al., 1997; van der Steeg et al., 2011). Knowledge of inherent fertilizing ability, such as obtained by the Cap‐Score™ performed in conjunction with semen analysis, and the timing of capacitation such as obtained by Cap‐Rate™, might enable clinicians to personalize infertility treatments for couples. The impact of a test able to provide this information has recently been modeled and shown to not only increase clinical pregnancy rate but also to reduce mean medical costs by $4,000 in couples with women under 35 years of age and by $19,200 in couples with women over 42 years of age (Babigumira, Sharara, & Garrison, 2018).
4. MATERIALS AND METHODS
All procedures were approved by the Western Institutional Review Board (https://www.wirb.com/Pages/Default.aspx; Protocol #20152233).
4.1. Specimen collection
Semen samples were collected by manual masturbation from consenting men after a minimum of 2 and a maximum of 5 days of sexual abstinence. Any sample having fewer than 10 × 106 motile sperm was discarded. Those men with known fertility provided evidence of fathering a child within the past 3 years or having a currently pregnant partner. Men questioning their fertility had been referred to the New Jersey Urology group for evaluation; the fertility status of their partner was not known or considered.
4.2. Standard sample processing
Samples were processed as previously described (Moody et al., 2017). Briefly, ejaculates were liquefied for up to 2 hr. Following liquefaction, the sperm were removed from the seminal plasma by centrifugation through Enhance S‐Plus Cell Isolation Media (Vitrolife, Göteborg, Sweden, catalogue # 15232 ESP‐100‐90%) and washed with modified Human Tubal Fluid medium (mHTF) (Irvine Scientific, Santa Ana, CA; catalogue # 90126 [97.8 mM NaCl; 4.69 mM KCl; 0.20 mM MgSO4; 0.37 mM KH2PO4; 2.04 mM CaCl2; 4 mM NaHCO3; 21 mM HEPES; 2.78 mM C6H12O6; 0.33 mM Sodium Pyruvate; 21.4 mM Sodium Lactate; 10 μg/ml Gentamicin; 5 mg/L Phenol Red]). The sperm were resuspended in mHTF with (Cap) and without (NonCap) 2‐hydroxypropyl‐β‐cyclodextrin (CD; Sigma, St. Louis, MO, catalogue # C0926) to promote capacitation. Previous studies have shown that stimulation with 2‐hydroxypropyl‐β‐cyclodextrin was as effective in promoting capacitation in human sperm at 3 hr of incubation as albumin was at 6 hr (Vairo et al., 2013). Following incubation, the samples were lightly fixed based on the original findings of Selvaraj et al. (2006), and different treatments were created based on the time of their incubation and time maintained in the fix prior to analysis. Prior to fixation the percent motile sperm for the Cap Day0 and Day1 were 39.6 ± 3.4 (n = 34) and 20.0 ± 3.2% (n = 33), respectively. The percent motile sperm for the NonCap Day0 and Day1 were 32.3 ± 2.9 (n = 31) and 32.2 ± 3.2% (n = 30), respectively.
4.3. Acrosome exocytosis experiments
Sperm were incubated with (Cap) or without (NonCap) CD. Day0‐A23187 treatment sperm were incubated with CD for 2.5 hr and then calcium ionophore A23187 (Sigma–Aldrich, St. Louis, MO; catalogue # C7522) was added to a final concentration of 20 μM for 0.5 hr prior to fixation and evaluation. Day1‐A23187 sperm were first incubated overnight with CD. The following day, A23187 was added to a final concentration of 20 μM and the cells were incubated for another 0.5 hr, fixed and evaluated.
A 6.36 mM solution of progesterone (P4; SigmaP8783) was prepared in pure ethanol (Sigma 459836), which was further diluted to create a 254.4 μM stock solution in mHTF. This P4 stock solution was stored at −20 °C until use. Day0‐P4 sperm were incubated with CD for 2.5 hr and then the P4 stock was added to yield a final concentration of 10 μM P4. Sperm were incubated in the presence of P4 for 0.5 hr prior to fixation and evaluation. Day1‐P4 sperm were incubated in the presence of CD overnight. The following day, P4 was added to a final concentration of 10 μM and the cells were incubated for another 0.5 hr, fixed, and then evaluated.
4.4. Sample labeling
Following incubation and fixation, samples were labeled with 2 μg/ml of Alexa Fluor 488‐conjugated CTB (Thermo Fisher, Waltham, MA; catalogue # C34775). After 10 min, 5 μl of the labeled sperm were placed on a microscope slide, overlaid with a cover slip (50 mm no. 1), and moved to an imaging station.
4.5. Image acquisition
Imaging was performed on Nikon Eclipse NI‐E microscopes equipped with CFI60 Plan Apochromat Lambda 40x Objectives; C‐FL AT GFP/FITC Long‐Pass Filter Sets; Hamamatsu ORCA‐Flash 4.0 cameras; H101F—ProScan III Open Frame Upright Motorized H101F Flat Top Microscope Stages; and 64‐bit imaging workstations running NIS Elements software (Nikon; Melville, NY).
4.6. Cap‐Score™ determination
Readers were trained to identify GM1 localization patterns associated with capacitation of human sperm and tested for proficiency as described (Moody et al., 2017). The proportion of sperm within a sample having undergone capacitation was determined and reported as the Cap‐Score™ (# of sperm with GM1 localization patterns consistent with capacitation/[# of sperm with capacitation patterns + number of sperm with other patterns]).
4.7. Statistical analyses
All statistical evaluations were carried out in XLSTAT Version 19.03.45087. To evaluate Cap‐Score™ differences among Day0, Day1‐fix, and Day1 treatments, an ANOVA followed by Fisher's LSD for multiple comparisons was utilized. To evaluate preplanned comparisons in the AE experiments, Wilcoxon's Signed Rank Test was used, while the Friedman's test for repeated measures was used for the multiple comparisons.
CONFLICTS OF INTEREST
G. Charles Ostermeier, Cristina Cardona, Melissa A. Moody, Alana J. Simpson, and Romeo Mendoza are employees of Androvia LifeSciences, LLC. Alexander J. Travis' laboratory at Cornell developed the assay, which was licensed by Androvia. He serves as a consultant to Androvia LifeSciences with duties of a Chief Scientific Officer.
AUTHORS' CONTRIBUTION
MAM, CC, AJS, RM, ES, & GCO performed the research; CC, MAM, AJT, & GCO analyzed the data; AJT & GCO designed experiments; AJT, CC, & GCO wrote the paper.
ACKNOWLEDGMENTS
The work was funded by Androvia LifeSciences.
Ostermeier GC, Cardona C, Moody MA, et al. Timing of sperm capacitation varies reproducibly among men. Mol Reprod Dev. 2018;85:387–396. https://doi.org/10.1002/mrd.22972
REFERENCES
- AboulGheit, S. (2010). Pregnancy rates following three different timings of intrauterine insemination for women with unexplained infertility: A randomised controlled trial. Middle East Fertility Society Journal, 15(4), 265–268. [Google Scholar]
- Andersen, A. G. , Als‐Nielsen, B. , Hornnes, P. J. , & Franch Andersen, L. (1995). Time interval from human chorionic gonadotrophin (HCG) injection to follicular rupture. Human Reproduction (Oxford, England), 10(12), 3202–3205. [DOI] [PubMed] [Google Scholar]
- Asano, A. , Nelson‐Harrington, J. L. , & Travis, A. J. (2013). Phospholipase B is activated in response to sterol removal and stimulates acrosome exocytosis in murine sperm. Journal of Biological Chemistry, 288(39), 28104–28115. [DOI] [PMC free article] [PubMed] [Google Scholar]
- Austin, C. R. (1951). Observations on the penetration of the sperm in the mammalian egg. Australian Journal of Scientific Research B, 4(4), 581–596. [DOI] [PubMed] [Google Scholar]
- Austin, C. R. (1952). The capacitation of the mammalian sperm. Nature, 170(4321), 326. [DOI] [PubMed] [Google Scholar]
- Austin, C. R. (1974). Fertilization In: Lash J. & Whittaker J. R. (Eds.), Concepts of development (pp. 48–75). Stamford, Connecticut: Sinauer Associates. [Google Scholar]
- Babigumira, J. B. , Sharara, F. I. , & Garrison, L. P. (2018). Projecting the potential impact of the Cap‐Score™ on clinical pregnancy, live births, and medical costs in couples with unexplained infertility. Journal of Assisted Reproduction and Genetics, 35(1), 99–106. [DOI] [PMC free article] [PubMed] [Google Scholar]
- Benoff, S. , Hurley, I. , Cooper, G. , Mandel, F. , Hershlag, A. , Scholl, G. , & Rosenfeld, D. (1993). Fertilization potential in vitro is correlated with head‐specific mannose‐ligand receptor expression, acrosome status and membrane cholesterol content. Human reproduction (Oxford. England), 8(12), 2155–2166. [DOI] [PubMed] [Google Scholar]
- Boué, F. , Blais, J. , & Sullivan, R. (1996). Surface localization of P34H, an epididymal protein, during maturation, capacitation, and acrosome reaction of human spermatozoa. Biology of Reproduction, 54(5), 1009–1017. [DOI] [PubMed] [Google Scholar]
- Cardona, C. , Neri, Q. V. , Simpson, A. J. , Moody, M. A. , Ostermeier, G. C. , Seaman, E. K. , … Travis, A. J. (2017). Localization patterns of the ganglioside GM1 in human sperm are indicative of male fertility and independent of traditional semen measures. Molecular Reproduction and Development, 84(5), 423–435. [DOI] [PMC free article] [PubMed] [Google Scholar]
- Chang, M. (1955). Development of fertilizing capacity of rabbit spermatozoa in the uterus. Nature, 175(4467), 1036–1037. [DOI] [PubMed] [Google Scholar]
- Chang, M. C. (1951). Fertilizing capacity of spermatozoa deposited into the fallopian tubes. Nature, 168(4277), 697–698. [DOI] [PubMed] [Google Scholar]
- Cohen, R. , Buttke, D. E. , Asano, A. , Mukai, C. , Nelson, J. L. , Ren, D. , … Travis, A. J. (2014). Lipid modulation of calcium flux through CaV2.3 regulates acrosome exocytosis and fertilization. Developmental Cell, 28(3), 310–321. [DOI] [PMC free article] [PubMed] [Google Scholar]
- Davis, B. K. (1981). Timing of fertilization in mammals: Sperm cholesterol/phospholipid ratio as a determinant of the capacitation interval. Proceedings of the National Academy of Sciences, 78(12), 7560–7564. [DOI] [PMC free article] [PubMed] [Google Scholar]
- Ehrenwald, E. , Foote, R. H. , & Parks, J. E. (1990). Bovine oviductal fluid components and their potential role in sperm cholesterol efflux. Molecular Reproduction and Development, 25(2), 195–204. [DOI] [PubMed] [Google Scholar]
- Fraser, L. R. (1999). New insights into possible causes of male infertility. Human Reproduction 14(suppl_1), 38–46. [DOI] [PubMed] [Google Scholar]
- Fraser, L. R. , & Adeoya‐Osiguwa, S. A. (2001). Fertilization promoting peptide—A possible regulator of sperm function in vivo. Vitamins & Hormones, 63, 1–28. [DOI] [PubMed] [Google Scholar]
- Fraser, L. R. , Harrison, R. , & Herod, J. E. (1990). Characterization of a decapacitation factor associated with epididymal mouse spermatozoa. Journal of Reproduction and Fertility, 89(1), 135–148. [DOI] [PubMed] [Google Scholar]
- Fraser, L. R. , & Osiguwa, O. O. (2004). Human sperm responses to calcitonin, angiotensin II and fertilization‐promoting peptide in prepared semen samples from normal donors and infertility patients. Human Reproduction, 19(3), 596–606. [DOI] [PubMed] [Google Scholar]
- Giojalas, L. C. , Rovasio, R. A. , Fabro, G. , Gakamsky, A. , & Eisenbach, M. (2004). Timing of sperm capacitation appears to be programmed according to egg availability in the female genital tract. Fertility and Sterility, 82(1), 247–249. [DOI] [PubMed] [Google Scholar]
- Grizard, G. , Sion, B. , Jouanel, P. , Benoit, P. , & Boucher, D. (1995). Cholesterol, phospholipids and markers of the function of the accessory sex glands in the semen of men with hypercholesterolaemia. International Journal of Andrology, 18(3), 151–156. [DOI] [PubMed] [Google Scholar]
- Guzick, D. S. , Overstreet, J. W. , Factor‐Litvak, P. , Brazil, C. K. , Nakajima, S. T. , Coutifaris, C. , … Vogel, D. L. (2001). Sperm morphology, motility, and concentration in fertile and infertile men. N Engl J Med, 345(19), 1388–1393. [DOI] [PubMed] [Google Scholar]
- Hoshi, K. , Aita, T. , Yanagida, K. , Yoshimatsu, N. , & Sato, A. (1990). Variation in the cholesterol/phospholipid ratio in human spermatozoa and its relationship with capacitation. Human Reproduction, 5(1), 71–74. [DOI] [PubMed] [Google Scholar]
- Jarvela, I. Y. , Tapanainen, J. S. , & Martikainen, H. (2010). Improved pregnancy rate with administration of hCG after intrauterine insemination: A pilot study. Reproductive Biology and Endocrinology: RB&E, 8, 18. [DOI] [PMC free article] [PubMed] [Google Scholar]
- Kawano, N. , Yoshida, K. , Iwamoto, T. , & Yoshida, M. (2008). Ganglioside GM1 mediates decapacitation effects of SVS2 on murine spermatozoa. Biology of Reproduction, 79(6), 1153–1159. [DOI] [PubMed] [Google Scholar]
- Kopf, G. S. , Visconti, P. E. , & Galantino‐Homer, H. (1999). Capacitation of the mammalian spermatozoon. Advances in Developmental Biochemistry, 5, 83–107. [Google Scholar]
- Langlais, J. , & Roberts, K. D. (1985). A molecular membrane model of sperm capacitation and the acrosome reaction of mammalian spermatozoa. Molecular Reproduction and Development, 12(2), 183–224. [Google Scholar]
- Mack, S. , Everingham, J. , & Zaneveld, L. (1986). Isolation and partial characterization of the plasma membrane from human spermatozoa. Journal of Experimental Zoology Part A: Ecological Genetics and Physiology, 240(1), 127–136. [DOI] [PubMed] [Google Scholar]
- Miao, Y. L. , Kikuchi, K. , Sun, Q. Y. , & Schatten, H. (2009). Oocyte aging: Cellular and molecular changes, developmental potential and reversal possibility. Human Reproduction Update, 15(5), 573–585. [DOI] [PubMed] [Google Scholar]
- Moody, M. A. , Cardona, C. , Simpson, A. J. , Smith, T. T. , Travis, A. J. , & Ostermeier, G. C. (2017). Validation of a laboratory‐developed test of human sperm capacitation. Molecular Reproduction and Development, 84(5), 408–422. [DOI] [PMC free article] [PubMed] [Google Scholar]
- Ombelet, W. , Bosmans, E. , Janssen, M. , Cox, A. , Vlasselaer, J. , Gyselaers, W. , … Maes, M. (1997). Semen parameters in a fertile versus subfertile population: A need for change in the interpretation of semen testing. Human Reproduction, 12(5), 987–993. [DOI] [PubMed] [Google Scholar]
- Parks, J. E. , Arion, J. W. , & Foote, R. (1987). Lipids of plasma membrane and outer acrosomal membrane from bovine spermatozoa. Biology of Reproduction, 37(5), 1249–1258. [DOI] [PubMed] [Google Scholar]
- Parks, J. E. , & Hammerstedt, R. H. (1985). Developmental changes occurring in the lipids of ram epididymal spermatozoa plasma membrane. Biology of Reproduction, 32(3), 653–668. [DOI] [PubMed] [Google Scholar]
- Parks, J. E. , & Lynch, D. V. (1992). Lipid composition and thermotropic phase behavior of boar, bull, stallion, and rooster sperm membranes. Cryobiology, 29(2), 255–266. [DOI] [PubMed] [Google Scholar]
- Selvaraj, V. , Asano, A. , Buttke, D. E. , McElwee, J. L. , Nelson, J. L. , Wolff, C. A. , … Lisanti, M. P. (2006). Segregation of micron‐scale membrane sub‐domains in live murine sperm. Journal of Cellular Physiology, 206(3), 636–646. [DOI] [PubMed] [Google Scholar]
- Selvaraj, V. , Buttke, D. E. , Asano, A. , McElwee, J. L. , Wolff, C. A. , Nelson, J. L. , … Travis, A. J. (2007). GM1 dynamics as a marker for membrane changes associated with the process of capacitation in murine and bovine spermatozoa. Journal of Andrology, 28(4), 588–599. [DOI] [PubMed] [Google Scholar]
- Sosa, C. M. , Pavarotti, M. A. , Zanetti, M. N. , Zoppino, F. C. M. , De Blas, G. A. , & Mayorga, L. S. (2015). Kinetics of human sperm acrosomal exocytosis. MHR: Basic Science of Reproductive Medicine, 21(3), 244–254. [DOI] [PubMed] [Google Scholar]
- Sugkraroek, P. , Kates, M. , Leader, A. , & Tanphaichitr, N. (1991). Levels of cholesterol and phospholipids in freshly ejaculated sperm and Percoll‐gradient‐pelletted sperm from fertile and unexplained infertile men. Fertility and Sterility, 55(4), 820–827. [PubMed] [Google Scholar]
- Testart J., Thebault A., Souderes E., & Frydman R. (1982). Premature ovulation after ovarian ultrasonography. BJOG: An International Journal of Obstetrics & Gynaecology, 89(9):694–700. [DOI] [PubMed] [Google Scholar]
- Travis, A. J. , & Kopf, G. S. (2002). The role of cholesterol efflux in regulating the fertilization potential of mammalian spermatozoa. The Journal of Clinical Investigation, 110(6), 731–736. [DOI] [PMC free article] [PubMed] [Google Scholar]
- Vairo, L. , Neri, Q. , Rosenwaks, Z. , Schlegel, P. , Travis, A. , & Palermo, G. (2013). A novel, biomarker‐based assay to screen for dysfunctional spermatozoa. Fertility and Sterility, 100(3), S224–S225. [Google Scholar]
- van der Steeg, J. W. , Steures, P. , Eijkemans, M. J. , Habbema, J. D. , Hompes, P. G. , Kremer, J. A. , … van der Veen, F. (2011). Role of semen analysis in subfertile couples. Fertility and Sterility, 95(3), 1013–1019. [DOI] [PubMed] [Google Scholar]
- Visconti, P. E. , Bailey, J. L. , Moore, G. D. , Pan, D. , Olds‐Clarke, P. , & Kopf, G. S. (1995). Capacitation of mouse spermatozoa. I. Correlation between the capacitation state and protein tyrosine phosphorylation. Development, 121(4), 1129–1137. [DOI] [PubMed] [Google Scholar]
- Visconti, P. E. , & Kopf, G. S. (1998). Regulation of protein phosphorylation during sperm capacitation. Biology of Reproduction, 59(1), 1–6. [DOI] [PubMed] [Google Scholar]
- Visconti, P. E. , Moore, G. D. , Bailey, J. L. , Leclerc, P. , Connors, S. A. , Pan, D. , … Kopf, G. S. (1995). Capacitation of mouse spermatozoa. II. Protein tyrosine phosphorylation and capacitation are regulated by a cAMP‐dependent pathway. Development, 121(4), 1139–1150. [DOI] [PubMed] [Google Scholar]
- Wang, Q. , & Sun, Q. Y. (2007). Evaluation of oocyte quality: Morphological, cellular and molecular predictors. Reproduction, Fertility, and Development, 19(1), 1–12. [DOI] [PubMed] [Google Scholar]
- Wilcox, A. J. , Weinberg, C. R. , & Baird, D. D. (1995). Timing of sexual intercourse in relation to ovulation. Effects on the probability of conception, survival of the pregnancy, and sex of the baby. The New England Journal of Medicine, 333(23), 1517–1521. [DOI] [PubMed] [Google Scholar]
- Yanagimachi, R. , (1994). Mammalian fertilisation In Knobil E. & Neill J. (Eds.), The physiology of reproduction. New York: Raven Press. [Google Scholar]