

Abstract
We identified that GATA zinc finger domain containing 1 (GATAD1), a transcriptional factor, was significantly up‐regulated in hepatocellular carcinoma (HCC) through gene amplification. We demonstrated the critical role, molecular mechanisms, and clinical implications of GATAD1 as a novel oncogenic factor in HCC. We found that GATAD1 protein was expressed in 76.6% of primary HCCs (85/111) but silenced in normal liver tissues. Gene amplification of GATAD1 was positively correlated with its overexpression in primary HCCs (R = 0.629, P < 0.0001). GATAD1 significantly increased cell proliferation, G1–S cell cycle transition, and migration/invasion but suppressed apoptosis in liver cell lines and promoted tumor growth and lung metastasis in both xenograft and orthotopic mouse models. Mechanistically, GATAD1 induced the transcriptional expression of phosphatase of regenerating liver 3 (PRL3) by binding to its promoter identified by RNA sequencing and chromatin immunoprecipitation‐PCR analyses. PRL3 played an oncogenic role in HCC. Knockdown of PRL3 blunted the tumorigenic effect of GATAD1. In addition, GATAD1 activated Akt signaling, evidenced by increased phosphorylation levels of total Akt, Akt1, Akt2, and Akt target glycogen synthase kinase 3β, while knockdown of PRL3 abolished this effect of GATAD1. We further unveiled that PRL3 activated Akt signaling by dephosphorylating phosphatase and tensin homolog at tyrosine residue, thus reducing phosphatase and tensin homolog protein. The PRL3 inhibitor 5‐[[5‐bromo‐2‐[(2‐bromophenyl)methoxy]phenyl]methylene]‐2‐thioxo‐4‐thiazolidinone significantly suppressed HCC growth by inhibiting Akt activation. Moreover, high GATAD1 nuclear protein expression was associated with poor survival of HCC patients as an independent prognostic factor. Conclusion: GATAD1 plays a pivotal oncogenic role in HCC by directly inducing PRL3 transcription to activate the Akt signaling pathway. GATAD1 may serve as an independent poor prognostic factor for HCC patients. (Hepatology 2018;67:2302‐2319).
Abbreviations
- BR‐1
5‐[[5‐bromo‐2‐[(2‐bromophenyl)methoxy]phenyl]methylene]‐2‐thioxo‐4‐thiazolidinone
- CDK4
cyclin‐dependent kinase 4
- ChIP
chromatin immunoprecipitation
- CI
confidence interval
- FHRE
fork head response element
- GATAD1
GATA zinc finger domain containing 1
- HCC
hepatocellular carcinoma
- IHC
immunohistochemistry
- luc
luciferase
- mTOR
mammalian target of rapamycin
- PRL3
phosphatase of regenerating liver 3
- PTEN
phosphatase and tensin homolog
- RR
relative risk
- siRNA
small interfering RNA
- TCGA
The Cancer Genome Atlas
- TNM
tumor–node–metastasis
- TUNEL
terminal deoxynucleotidyl transferase‐mediated deoxyuridine triphosphate nick‐end labeling
Hepatocellular carcinoma (HCC) is one of the most common types of cancer worldwide.1 Copy number aberrations including chromosome gains and losses, localized amplifications, and deletions are frequently found in human HCC and are major causes of aberrant activation of oncogenes and inactivation of tumor suppressor genes.2 Some copy number aberrations, such as copy number gain at chromosomal region 8q11 and copy number loss of chromosome 17q13.3, are closely related to clinical outcome or metastatic progression.3 Therefore, it is of great importance to identify and functionally characterize novel genes with copy number aberrations that are associated with HCC.4 Considerable efforts have focused on identifying novel gene targets by copy number variation so as to unravel the molecular mechanisms for the activation of oncogenic pathways that contribute to hepatocarcinogenesis and to design better treatments to reduce its mortality.
Activation of the Akt signaling pathway has been well established as a major determinant of tumor cell growth and survival in HCC.5 In normal conditions, the Akt pathway is negatively regulated by phosphatase and tensin homolog (PTEN), which limits the ability of Akt to bind to the membrane, decreasing its activity.6 Phosphatase of regenerating liver 3 (PRL3), whose expression was up‐regulated in HCC,7 is known to exert its oncogenic functions through multiple oncogenic effector pathways, including phosphoinositide 3‐kinase/Akt/mammalian target of rapamycin (mTOR) and mitogen‐activated protein kinase.8, 9, 10 PRL3 has also been shown to increase the activation of Akt by the concomitant down‐regulation in protein expression levels of PTEN.11
We have recently identified that GATA zinc finger domain containing 1 (GATAD1), a transcriptional factor, was an outlier expression gene along with gene amplification in HCC tumor tissues. The genomic location of the GATAD1 gene is on 7q21.2.12 Regional chromosome 7q21‐q22 gain is in close association with HCC progression.13 The protein encoded by this gene contains a zinc finger at the N terminus12 and is thought to bind to a histone modification site that regulates gene expression.14 However, the role of GATAD1 in HCC has not yet been explored. In this study, we characterized the functional significance, molecular mechanisms, and clinical implications of GATAD1 in HCC.
Materials and Methods
TISSUE SAMPLES
Tissue microarrays of 184 HCC cases were constructed from paraffin‐embedded HCC tissues, which were collected at the Prince of Wales Hospital of the Chinese University of Hong Kong from 2001 to 2015. The patients' demographic and clinicopathological features are shown in Table 1. The tumor–node–metastasis (TNM) stage of HCC tissue microarray samples was assessed according to the criteria of the seventh edition of the TNM classification of the American Joint Committee on Cancer. Patients were being regularly followed up, and the median follow‐up duration since the time of diagnosis was 49.8 months (range 0.2‐167.1 months). In addition, 111 paired primary HCCs and adjacent non‐HCC tissues were obtained from patients with HCC without any prior therapeutic intervention at the Prince of Wales Hospital. All of the samples were subsequently verified by histology. Three normal human liver tissue samples were collected from the Department of Liver Transplantation at The University of Hong Kong. Informed consent was given by all patients. The study protocol was approved by the Clinical Research Ethics Committee of The Chinese University of Hong Kong.
Table 1.
Relationship Between GATAD1 Expression and Clinicopathological Features in 184 HCC Cases
| Variable | Low Expression (n = 91) | Percent | High Expression (n = 93) | Percent | P |
|---|---|---|---|---|---|
| Mean age, years ± SD | 56.34 ± 9.803 | 53.99 ± 12.128 | 0.150 | ||
| Gender | |||||
| Male | 74 | 81.3 | 81 | 87.1 | 0.282 |
| Female | 17 | 18.7 | 12 | 12.9 | |
| Grade | |||||
| High | 24 | 26.4 | 5 | 5.4 | <0.0001 |
| Moderate | 63 | 69.2 | 71 | 76.3 | |
| Poor | 4 | 4.4 | 17 | 18.3 | |
| TNM | |||||
| I | 44 | 48.4 | 50 | 53.8 | 0.649 |
| II | 25 | 27.5 | 22 | 23.7 | |
| III | 22 | 24.2 | 20 | 21.5 | |
| IV | 0 | 0 | 1 | 1.1 | |
| Size | |||||
| <5 cm | 51 | 56.0 | 55 | 59.1 | 0.671 |
| ≥5 cm | 40 | 44.0 | 38 | 40.9 | |
| Multiple tumors | |||||
| Yes | 66 | 72.5 | 75 | 80.6 | 0.193 |
| No | 25 | 27.5 | 18 | 19.4 |
HCC CELL LINES
Six HCC cell lines (Huh6, Huh7, SK‐Hep1, HepG2, Hep3B, PLC‐5) and one immortalized hepatocyte cell line (LO2) were used in this study. Among them, SK‐Hep1 has been identified as being of endothelial origin recently. Cells were cultured in Dulbecco's modified Eagle's medium (Gibco BRL, Rockville, MD) supplemented with 10% fetal bovine serum (Gibco BRL).
UBIQUITINATION ASSAY
LO2 and HepG2 cells stably transfected with GATAD1 expression vector or empty vector were transfected with ubiquitin‐hemagglutinin for 24 hours. Then the cells were incubated in the presence or absence of 10 μM MG132 (Cell Signaling Technology) for 12 hours. Total proteins were extracted using radio immunoprecipitation assay buffer supplemented with proteinase inhibitor. Immunoprecipitation was then performed using anti‐Akt antibody. The immunoprecipitated proteins were subjected to western blotting using antihemagglutinin antibody to evaluate the ubiquitination level. The inputs were subjected to western blot analysis with antibodies against GATAD1, Akt, and β‐actin, respectively.
STATISTICAL ANALYSIS
The results were expressed as mean ± SD. Statistical analysis was performed using SPSS (standard V.16.0; IBM Corporation, Armonk, NY). The Pearson correlation coefficient was used to evaluate the correlation between GATAD1 gene amplification and expression in the clinical samples. The χ2 test was used for comparison of patient characteristics and distributions of expression and covariates by vital status. Crude relative risks (RRs) of death associated with GATAD1 expression and other predictor variables were estimated by the univariate Cox proportional hazards regression model first. A multivariate Cox model was constructed to estimate the adjusted RR for GATAD1 expression. Overall survival in relation to expression was evaluated by the Kaplan‐Meier survival curve and the log‐rank test. The Mann‐Whitney U test or Student t test was performed to compare the variables of two groups. The difference in cell viability and tumor growth rate between the two groups of nude mice was determined by repeated‐measures analysis of variance. P < 0.05 was taken as statistically significant.
Additional experimental procedures are provided in the http://onlinelibrary.wiley.com/doi/10.1002/hep.29750/suppinfo.
Results
GATAD1 IS AMPLIFIED AND OVEREXPRESSED IN HCC
Data mining from The Cancer Genome Atlas (TCGA) data set repository (https://cancergenome.nih.gov/) of 50 pairs of primary HCC tumor tissue samples, we found that GATAD1 mRNA was strongly up‐regulated in HCC tumor tissues compared to their adjacent nontumor tissues (P < 0.001; Fig. 1A). Then, we evaluated GATAD1 expression status and copy number variation from the TCGA data set (http://www.cbioportal.org/index.do). In the TCGA cohort of 364 HCCs, GATAD1 copy number gain occurred in 33.2% of HCC tumor tissues (121/364; Fig. 1B), and there was a positive correlation between its copy number status and expression (R = 0.629, P < 0.0001; Fig. 1C). These data suggest that up‐regulation of GATAD1 in HCC is at least in part contributed by DNA amplification. We then evaluated GATAD1 protein level in 20 pairs of HCC tumor tissues and their adjacent normal tissues by western blot. The protein expression level of GATAD1 was significantly higher in primary HCCs compared with their adjacent normal tissues (P < 0.05; Fig. 1D). In addition, 111 pairs of HCC tumor tissues and adjacent normal tissues were examined by immunohistochemistry (IHC) (Fig. 1E). GATAD1 nuclear staining was detected in 76.6% of primary HCC tumor tissues (85/111). The level of GATAD1 nuclear expression was significantly higher in HCC tumor tissues compared to their adjacent normal tissues (P < 0.0001; Fig. 1E).
Figure 1.
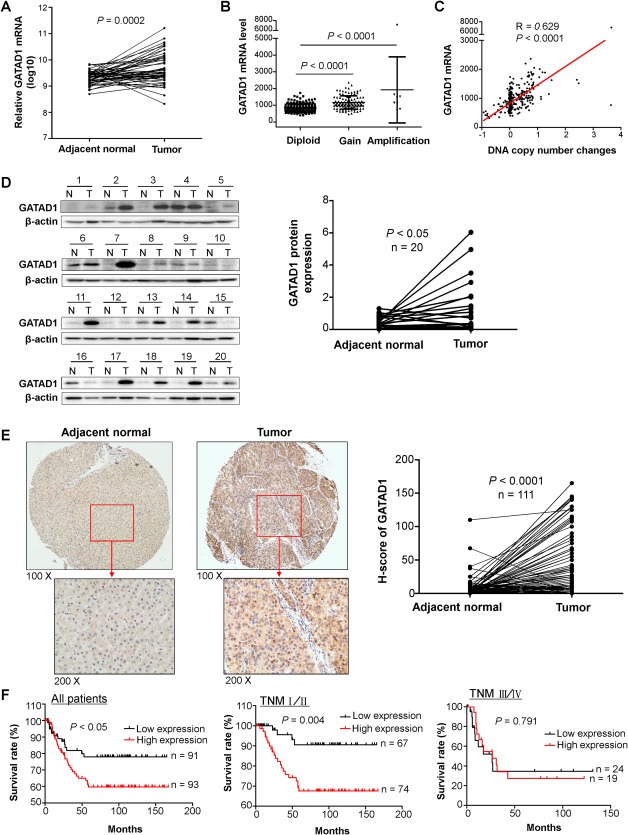
GATAD1 is amplified and overexpressed in primary HCC tissue samples, and high expression of GATAD1 is associated with poor prognosis of HCC patients. (A) The TCGA data set of 50 HCC patients showed that GATAD1 mRNA was strongly up‐regulated in HCC tumor tissues compared to their adjacent nontumor tissues (P < 0.001). (B) GATAD1 gene copy number gain was identified in 33.2% (121/364) of HCC tumor tissues in the TCGA cohort (Gain, low‐level gain; Amplification, high‐level amplification). (C) GATAD1 copy number status was positively correlated with its mRNA expression (R = 0.629, P < 0.0001) in the TCGA cohort. (D) The protein expression level of GATAD1 was significantly higher in primary HCCs compared with their adjacent normal tissues by western blot (n = 20, P < 0.05). (E) Representative images of IHC staining of GATAD1 protein expression in HCC tumor and adjacent normal tissues. The level of GATAD1 nuclear expression was significantly higher in HCC tumor tissues compared to their adjacent normal tissues by IHC (n = 111, P < 0.0001). (F) Kaplan‐Meier survival analysis in 184 HCC patients. HCC patients with high GATAD1 expression had poorer survival than those with low or negative GATAD1 expression (log‐rank test, P < 0.05) in total. Considering the TNM staging, the difference was only significant in stage I/II (P < 0.01) patients but not stage III/IV patients. Abbreviations: N, normal; T, tumor.
OVEREXPRESSION OF GATAD1 IS ASSOCIATED WITH POOR PROGNOSIS OF PATIENTS WITH HCC
To evaluate the clinical significance of GATAD1 in HCC, GATAD1 nuclear expression was examined in another cohort of 184 primary HCC tissues in tissue microarray by IHC. There was no correlation between GATAD1 expression status and clinical pathological features such as age, gender, TNM stage, tumor size, and multiple tumors (Table 1). However, high GATAD1 expression was positively associated with poor differentiation (P < 0.0001). On univariate Cox regression analysis, high GATAD1 expression was associated with an increased risk of cancer‐related death (RR, 1.867, 95% confidence interval [CI], 0.999‐3.489; P < 0.05; http://onlinelibrary.wiley.com/doi/10.1002/hep.29750/suppinfo). As expected, the TNM stage was also a significant prognostic factor (P < 0.0001). After adjustment for potential confounding factors including age, gender, and TNM stage, high GATAD1 expression was found to be an independent risk factor for shortened survival in patients with HCC by multivariate Cox regression analysis (RR, 1.981; 95% CI, 1.056‐3.716; P = 0.0033; http://onlinelibrary.wiley.com/doi/10.1002/hep.29750/suppinfo). As shown on the Kaplan‐Meier survival curves, those with high GATAD1 expression had significantly shorter survival than those with low GATAD1 expression among patients with HCC (P < 0.05; Fig. 1F). After stratification by TNM stage, high GATAD1 expression patients had significantly shorter survival in stages I/II (P < 0.01) but not in stages III/IV (Fig. 1F). Particularly, in stage I/II patients, high GATAD1 expression was associated with an increased risk of tumor‐related death on univariate Cox regression (RR, 4.195; 95% CI, 1.440‐12.224; P = 0.009; http://onlinelibrary.wiley.com/doi/10.1002/hep.29750/suppinfo). Multivariate Cox regression analysis showed that high GATAD1 expression was an independent predictor of poorer survival of patients with stage I/II HCC (RR, 5.577; 95% CI, 1.891‐16.442; P = 0.002; http://onlinelibrary.wiley.com/doi/10.1002/hep.29750/suppinfo).
GATAD1 PROMOTES CELL GROWTH AND CELL CYCLE PROGRESSION AND INHIBITS APOPTOSIS IN HCC CELLS
We examined the protein expression of GATAD1 in HCC cell lines by western blot. GATAD1 was readily expressed in all seven HCC cell lines but absent in normal liver tissues (Fig. 2A). High expression of GATAD1 in HCC cell lines and tumor tissues suggested that GATAD1 might have an oncogenic function to promote HCC tumorigenesis. To prove this, stable ectopic expression of GATAD1 in the immortal hepatocyte cell line LO2 and the HCC cell line HepG2 was generated (Fig. 2B). Conversely, SK‐Hep1 and HepG2 cell lines were used for loss of GATAD1 function by transient transfection of two sets of small interfering RNA (siRNA) against GATAD1 (siGATAD1) (Fig. 2B). Ectopic expression of GATAD1 in LO2 and HepG2 cells significantly increased cell viability compared with empty vector‐transfected LO2 and HepG2 cells (Fig. 2C), while an inverse effect was observed in SK‐Hep1 and HepG2 cells with GATAD1 knockdown (Fig. 2C). In keeping with this, the number of colonies which had formed in GATAD1‐transfected LO2 and HepG2 cells were significantly increased compared with empty vector‐transfected LO2 and HepG2 cells (Fig. 2D), while knockdown of GATAD1 inhibited the colony formation ability in SK‐Hep1 and HepG2 cells (Fig. 2D). These results indicated that GATAD1 was important for promoting HCC cell growth.
Figure 2.
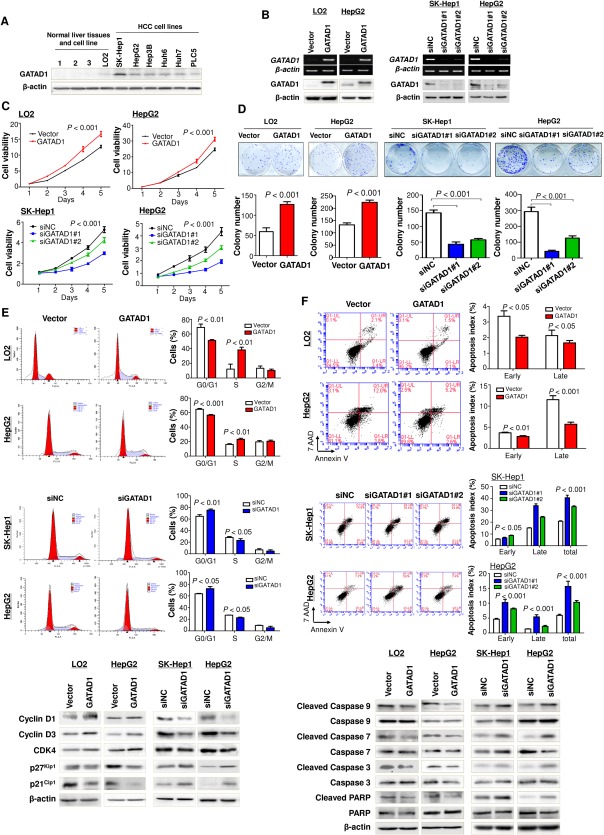
GATAD1 promotes HCC cell proliferation and cell cycle progression and inhibits cell apoptosis. (A) GATAD1 was highly expressed in HCC cell lines but not in normal liver tissues by western blot. (B) Ectopic expression of GATAD1 in LO2 (normal immortalized hepatocyte cell line) and HepG2 (HCC cell line) was confirmed by RT‐PCR and western blot. Knockdown efficiency of GATAD1 by siGATAD1 in HCC cell lines SK‐Hep1 and HepG2 was confirmed by RT‐PCR and western blot. (C) Ectopic expression of GATAD1 significantly increased cell viability in LO2 and HepG2 cells (upper panel), while cell growth was inhibited by GATAD1 knockdown in SK‐Hep1 and HepG2 cells (lower panel). (D) Ectopic expression of GATAD1 promoted colony formation in LO2 and HepG2 cells. Knockdown of GATAD1 suppressed colony formation in SK‐Hep1 and HepG2 cells. (E) GATAD1 decreased the number of cells in G1 phase but increased the number of cells in S phase by flow‐cytometric analysis in LO2 and HepG2 cells (upper panel). Knockdown of GATAD1 arrested the cell cycle at the G1–S transition in SK‐Hep1 and HepG2 cells (middle panel). Ectopic expression of GATAD1 enhanced protein levels of cyclin‐D1, cyclin‐D3, and CDK4 and reduced p27Kip1 and p21Cip1 by western blot. Knockdown of GATAD1 had the opposite effect (lower panel). (F) GATAD1 inhibited cell apoptosis analyzed by flow cytometry of cells stained with annexin V/7‐amino‐actinomycin D (upper panel). Knockdown of GATAD1 promoted cell apoptosis (middle panel). GATAD1 significantly reduced the protein levels of the active forms of caspase‐3, caspase‐7, and caspase‐9 and poly(adenosine diphosphate‐ribose) polymerase in LO2 and HepG2 cells, while knockdown of GATAD1 in SK‐Hep1 and HepG2 had the opposite effect by western blot (lower panel). Abbreviations: 7‐AAD, 7‐amino‐actinomycin D; NC, negative control; PARP, poly(adenosine diphosphate‐ribose) polymerase.
To characterize the oncogenic mechanism of GATAD1 in HCC cell growth, we further investigated the role of GATAD1 in cell cycle progression. We found that ectopic expression of GATAD1 in LO2 and HepG2 cells significantly decreased the number of cells in G1 phase (P < 0.01) but increased the number of cells in S phase (P < 0.01) compared with control vector‐transfected cells (Fig. 2E). Conversely, knockdown of GATAD1 in SK‐Hep1 and HepG2 cells by siGATAD1 arrested the cell cycle at the G1–S transition (Fig. 2E). Western blot analysis showed that key G1 cell cycle regulators cyclin D1, cyclin D3, and cyclin‐dependent kinase 4 (CDK4) were elevated and that G1 cell cycle inhibitors p21Cip1 and p27Kip1 were reduced in GATAD1 overexpressing LO2 and HepG2 cells (Fig. 2E), while knockdown of GATAD1 in SK‐Hep1 and HepG2 cells had the opposite effect (Fig. 2E), confirming the role of GATAD1 in promoting cell growth by regulating cell cycle progression in HCC cells.
We further examined the contribution of apoptosis to the observed GATAD1‐enhanced tumor growth in HCC cells. The effect of GATAD1 on apoptosis was assessed quantitatively by flow cytometry after staining with annexin V and 7‐amino‐actinomycin D. The results showed a reduction in the number of early apoptotic cells (3.37 ± 0.20% versus 2.13 ± 0.20%, P < 0.05) and late apoptotic cells (2.03 ± 0.07% versus 1.67 ± 0.09%, P < 0.05) in GATAD1‐transfected LO2 cells compared with vector‐transfected LO2 cells (Fig. 2F). A similar effect was observed in GATAD1‐transfected HepG2 cells, which showed a reduced proportion of cells in the early apoptotic phase (3.67 ± 0.09% versus 2.80 ± 0.12%, P < 0.01) and in the late apoptotic phase (11.50 ± 0.55% versus 5.70 ± 0.29%, P < 0.001) compared with control cells (Fig. 2F). To further clarify whether knockdown of GATAD1 could reverse this phenotype, siRNA against GATAD1 was transiently transfected into SK‐Hep1 and HepG2 cells. The percentage of early and late apoptotic cells in siGATAD1 SK‐Hep1 and HepG2 cells was significantly increased compared with control cells (Fig. 2F). We examined the key cell apoptosis regulators by western blot and found that GATAD1 significantly reduced the protein levels of the active forms of caspase‐3, caspase‐7, caspase‐9, and poly(adenosine diphosphate‐ribose) polymerase in LO2 and HepG2 cells, while knockdown of GATAD1 in SK‐Hep1 and HepG2 cells had the opposite effect (Fig. 2F). Therefore, our results indicated that GATAD1 suppressed the occurrence of apoptosis in HCC cells.
GATAD1 PROMOTES THE MIGRATION AND INVASION ABILITIES IN HCC CELLS
The tumor‐promoting effect of GATAD1 was further evaluated on cell migration and invasion. Ectopic expression of GATAD1 significantly increased the migration abilities in LO2 (P < 0.01) and HepG2 (P < 0.001) cells compared to control cells. Matrigel invasion assay also showed that overexpression of GATAD1 promoted the invasion of LO2 (P < 0.01) and HepG2 (P < 0.05) cells (http://onlinelibrary.wiley.com/doi/10.1002/hep.29750/suppinfo). In keeping with this, GATAD1 promoted epithelial–mesenchymal transition evidenced by up‐regulating mesenchymal regulators N‐cadherin and Slug (http://onlinelibrary.wiley.com/doi/10.1002/hep.29750/suppinfo).
GATAD1 PROMOTES TUMORIGENICITY IN NUDE MICE
To further explore the in vivo tumorigenic ability of GATAD1, empty vector‐transfected and GATAD1‐transfected LO2 cells were injected into the left and right flanks of nude mice, respectively. We found that tumor growth rates in the nude mice injected with the LO2‐GATAD1 cells were significantly faster than those in mice injected with the LO2‐vector control cells (P < 0.01; Fig. 3A). At the end of the experiment, the mice were sacrificed and the xenografts were excised (Fig. 3A). The average tumor weight in nude mice injected with LO2‐GATAD1 (0.162 ± 0.032 g) was significantly heavier compared with that in control mice (0.036 ± 0.007 g) (P < 0.01; Fig. 3A). IHC staining confirmed the GATAD1 transfected efficiency in xenograft tumor tissues (Fig. 3B). Similar to the in vitro experiments, significantly more proliferating cells (P < 0.01) and fewer apoptotic cells (P < 0.01) were observed in GATAD1 overexpressing xenografts, as indicated by Ki‐67 staining and terminal deoxynucleotidyl transferase‐mediated deoxyuridine triphosphate nick‐end labeling (TUNEL) assays, respectively (Fig. 3B). Conversely, silencing of GATAD1 in HepG2 cells inhibited tumorigenic ability in a subcutaneous xenograft mouse model (Fig. 3C). GATAD1 knockdown efficiency was verified by IHC staining (Fig. 3D). In concordance with the in vitro findings, significantly fewer proliferating cells (P < 0.05) and more apoptotic cells (P < 0.01) were detected in GATAD1‐knockdown xenografts, as indicated by Ki‐67 staining and TUNEL assays, respectively (Fig. 3D).
Figure 3.
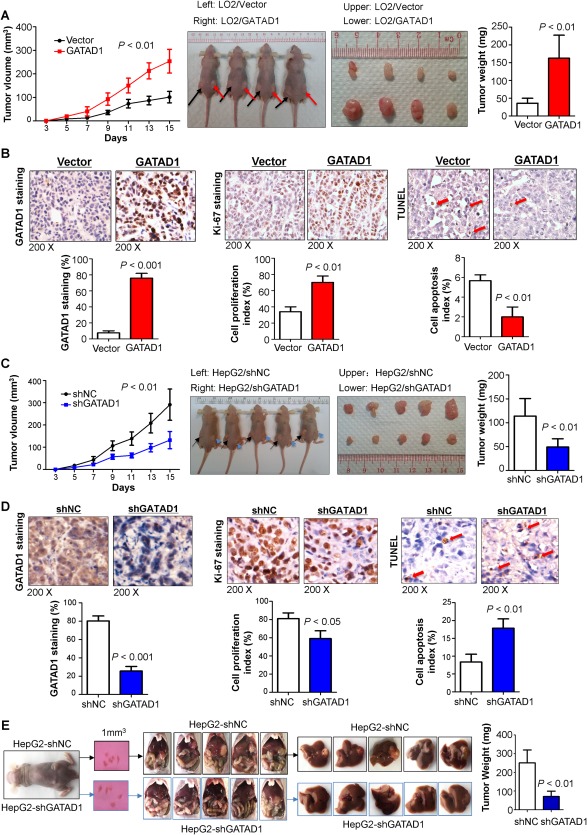
GATAD1 enhances tumorigenesis in vivo. (A) Tumor growth curve of GATAD1‐expressing LO2 cells in nude mice was compared with control vector‐transfected LO2 cells (left panel). Representative images of tumor growth in nude mice subcutaneously inoculated with GATAD1‐transfected or control vector‐transfected LO2 cells (middle panel). Tumor weight was compared at the end of the experiment (right panel). (B) GATAD1 protein expression in subcutaneous xenografts was determined by IHC. Cell proliferative activity was evaluated by Ki‐67 staining, and cell apoptosis was measured by TUNEL staining in subcutaneous xenografts. (C) The tumor growth curve of HepG2 stably transduced with short hairpin GATAD1 in nude mice was significantly dampened compared with HepG2 transduced with control (left panel). Representative images of tumor formation in nude mice subcutaneously inoculated with short hairpin GATAD1‐HepG2 or control‐HepG2 (middle panel). Tumor weights from the short hairpin GATAD1 and control groups (right panel). (D) GATAD1 protein expression was determined in subcutaneous xenografts by IHC. Cell proliferative activity was evaluated by Ki‐67 staining and cell apoptosis by TUNEL staining. (E) Knockdown of GATAD1 in HepG2 significantly inhibited HCC tumorigenicity in vivo as demonstrated by an orthotopic tumor implantation experiment in nude mice. Tumor weights are shown. Data are expressed as mean ± SD, n = 5/group. Abbreviations: NC, negative control; sh, short hairpin.
Orthotopic xenograft tumor models were established using subcutaneous xenograft tumors in HepG2 cells with and without lentivirus‐mediated GATAD1 knockdown. The results showed that knockdown of GATAD1 in HepG2 cells significantly decreased the orthotopic liver tumor volume and tumor weight compared to controls (P < 0.01; Fig. 3E). Moreover, GATAD1 knockdown in HepG2 cells significantly suppressed lung metastasis compared to controls (P < 0.05; http://onlinelibrary.wiley.com/doi/10.1002/hep.29750/suppinfo). These data suggested that GATAD1 promoted the metastatic ability of HCC cells.
GATAD1 INDUCES PRL3 TRANSCRIPTIONAL EXPRESSION BY DIRECTLY BINDING TO PRL3 PROMOTER
It has been reported that GATAD1 is a transcription factor that can regulate downstream gene expression.14 To confirm this, we first examined whether GATAD1 localizes primarily to the nucleus by double immunofluorescence of GATAD1 and 4′,6‐diamidino‐2‐phenylindole (a blue fluorescent nucleic acid stain). GATAD1 showed a strong nuclear signal in GATAD1‐transfected LO2 and HepG2 cells (Fig. 4A).
Figure 4.
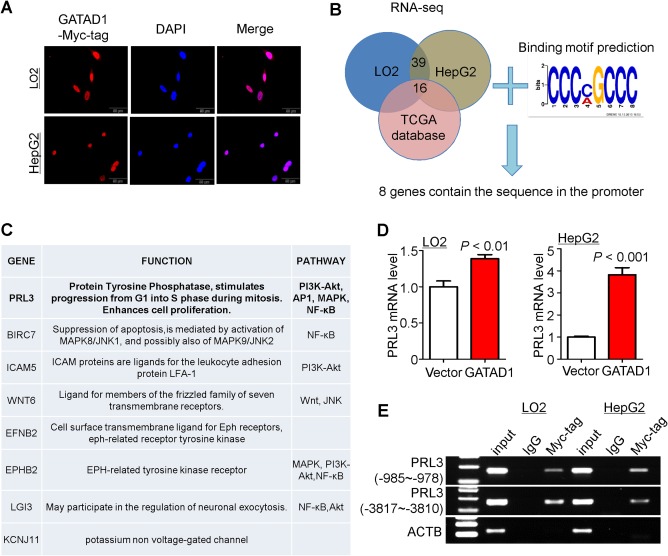
PRL3 is a direct downstream target of GATAD1. (A) Nuclear localization of GATAD1 in LO2 and HepG2 cells following GATAD1 transfection by immunofluorescence staining. (B) Venn diagram of RNA‐sequencing data and predicted pattern of transcription factor binding site for GATAD1 to select the direct downstream target genes of GATAD1. (C) The list of the putative target genes of GATAD1. (D) Ectopic expression of GATAD1 increased the mRNA expression of PRL3 in LO2 and HepG2 by quantitative PCR. (E) ChIP‐PCR was performed to determine the interaction between GATAD1 and PRL3 promoter. Enrichment of GATAD1 in PRL3 promoter was found in GATAD1‐expressing LO2 and HepG2 cells. Abbreviations: AP1, activator protein‐1; DAPI, 4′,6‐diamidino‐2‐phenylindole; IgG, immunoglobulin G; JNK, c‐Jun N‐terminal kinase; MAPK, mitogen‐activated protein kinase; NF‐κB, nuclear factor kappa B; PI3K, phosphoinositide 3‐kinase.
In order to characterize the direct targets of GATAD1 that conferred oncogenic properties in HCC, we performed RNA sequencing in LO2‐GATAD1 and HepG2‐GATAD1 cell lines as well as their vector‐control counterparts. Thirty‐nine genes were up‐regulated in both overexpression cell lines (fold change >1.2; P < 0.05) (Fig. 4B; http://onlinelibrary.wiley.com/doi/10.1002/hep.29750/suppinfo). To limit the candidate genes, data mining from the TCGA data set showed that the mRNA levels of 16 genes were significantly up‐regulated in HCC tumor tissues compared to their adjacent normal tissue (Fig. 4B; http://onlinelibrary.wiley.com/doi/10.1002/hep.29750/suppinfo). The genome‐wide binding locations of GATAD1 were estimated using the GATAD1 chromatin immunoprecipitation (ChIP) sequencing data set (http://www.ncbi.nlm.nih.gov/geo/query/acc.cgi?acc=GSE20303). Because GATAD1 had a zinc finger domain,12 the most likely transcription factor binding site pattern for GATAD1 was CCCMGCCC (Fig. 4B). In this connection, eight genes with transcription factor binding sites in their promoter region were selected (Fig. 4C). Among them, only PRL3 belongs to the protein‐tyrosine phosphatase family. Real‐time PCR confirmed that PRL3 was up‐regulated in GATAD1 overexpressing LO2 and HepG2 cells (Fig. 4D). Moreover, ChIP‐PCR was performed in LO2‐GATAD1 and HepG2‐GATAD1 cell lines. As expected, GATAD1 was enriched in the promoter of PRL3 in LO2 and HepG2 cells (Fig. 4E). Moreover, we evaluated the influence of GATAD1 overexpression on the other two potential target genes (BIRC7 and ICAM5). The results showed that GATAD1 was enriched in the promoter of BIRC7 and ICAM5 in LO2 and HepG2 cells by ChIP‐PCR and increased their mRNA expression (http://onlinelibrary.wiley.com/doi/10.1002/hep.29750/suppinfo). Moreover, GATAD1 mRNA expression was positively correlated with BIRC7 mRNA expression in 50 HCC tumor tissues (R = 0.79, P < 0.001; http://onlinelibrary.wiley.com/doi/10.1002/hep.29750/suppinfo).
PRL3 PLAYS AN ONCOGENIC ROLE IN HCC, AND THE EFFECT OF GATAD1 IS DEPENDENT ON PRL3
We found that PRL3 mRNA expression was increased in HCC tumor tissues compared with adjacent normal (P < 0.01) (Fig. 5A). Analysis of the TCGA data set also showed that PRL3 was up‐regulated in HCC tumor tissues (P < 0.0001) (Fig. 5A). These results indicated that PRL3 might play an oncogenic role in the development of HCC, which was consistent with results reported by others.7 To study the functional role of PRL3 in HCC, SK‐Hep1 and HepG2 cells were transiently transfected with two sets of siRNA against PRL3 or control. Knockdown of PRL3 significantly suppressed cell proliferation (Fig. 5B). In keeping with this, PRL3 knockdown decreased the protein levels of CDK4 and cyclin D1 and increased p27Kip1 levels by western blot (Fig. 5C). Moreover, we investigated the effect of PRL3 knockdown on GATAD1‐mediated cell proliferation. LO2 and HepG2 cells stably transfected with GATAD1‐expressing or empty vector were cotransfected with siRNA against PRL3. Our results showed that PRL3 knockdown partially abolished the effect of GATAD1 on cell viability (Fig. 5D) and colony‐formation abilities in both LO2 and HepG2 cells (Fig. 5E). The PRL3‐dependent oncogenic role of GATAD1 was further investigated with an in vivo model. LO2 cells stably transfected with GATAD1 expressing or empty vector were cotransfected with lentivirus short hairpin RNA‐PRL3. The cells were subcutaneously injected into the right flanks of nude mice. We found that PRL3 knockdown partially abolished the effect of GATAD1 on tumor growth (Fig. 5F). These results indicated that the oncogenic function of GATAD1, at least in part, depended on the existence of PRL3 in HCC cells.
Figure 5.
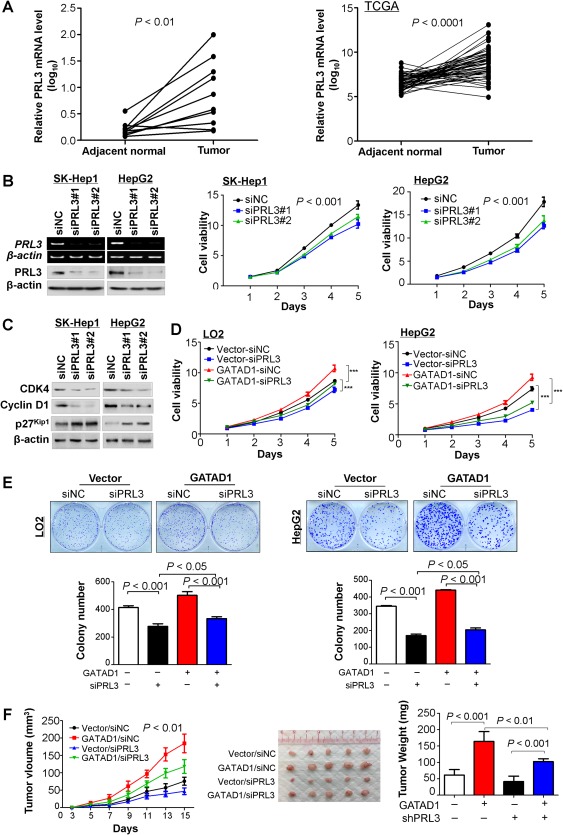
GATAD1 exerts its oncogenic function partially dependent on the existence of PRL3 in HCC. (A) PRL3 expression was increased in HCC tumor tissues compared with adjacent normal tissue (n = 10; P < 0.01; left panel). The TCGA data set of 50 HCC patients confirmed that PRL3 mRNA was up‐regulated in HCC tumor tissues compared to their adjacent nontumor tissues (n = 50; P < 0.001; right panel). (B) Knockdown efficiency of PRL3 by siPRL3 in SK‐Hep1 and HepG2 cells was confirmed by RT‐PCR and western blot. Cell viability of SK‐Hep1 and HepG2 cells was determined by the 3‐[4,5‐dimethylthiazol‐2‐yl]‐2,5 diphenyl tetrazolium bromide assay. (C) Protein expression of cyclin‐D1, CDK4, and p27Kip1 was evaluated by western blot. (D) Effect of GATAD1 on HCC cell viability with or without PRL3 knockdown by the 3‐[4,5‐dimethylthiazol‐2‐yl]‐2,5 diphenyl tetrazolium bromide assay. Data are mean ± SD. *** P < 0.001. (E) Effect of GATAD1 on colony formation ability of HCC cells with or without PRL3 knockdown. (F) Tumor growth curve of GATAD1‐expressing LO2 cells with or without PRL3 knockdown in nude mice was compared with control vector‐transfected LO2 cells (left panel). Representative images of tumor formation in nude mice subcutaneously inoculated with GATAD1‐transfected or control vector‐transfected LO2 cells with or without PRL3 knockdown (middle panel). Tumor weight was compared at the end of the experiment (right panel). Abbreviations: NC, negative control; sh, short hairpin.
GATAD1 ACTIVATES THE Akt SIGNALING PATHWAY IN A PRL3‐DEPENDENT MANNER
To gain insight into the downstream signaling pathways modulated by GATAD1 in HCC development, we performed promoter‐luciferase (luc) activity assays using several pathway luc reporters including nuclear factor κB‐luc, p53‐luc, activator protein‐1‐luc, serum response element‐luc, superTOP‐luc, and forkhead response element (FHRE)‐luc. Ectopic expression of GATAD1 significantly reduced FHRE‐luc reporter activities in LO2 and HepG2 cells, whereas no significant activity changes were observed in other pathway reporters (Fig. 6A). FHRE is the response element of forkhead box O3, which is a transcription factor that regulates the expression of some tumor suppressor genes. It was reported that Akt promotes cell survival by phosphorylating and inhibiting forkhead box O3.15 In keeping with this, GATAD1 increased the levels of phospho‐Akt (Thr450), phospho‐Akt1 (Ser473), phospho‐Akt2 (Ser474), and total Akt in LO2 and HepG2 cells (Fig. 6B), whereas no significant changes were observed in the mRNA levels of AKT1 and AKT2 (http://onlinelibrary.wiley.com/doi/10.1002/hep.29750/suppinfo). In order to investigate whether GATAD1 increased the level of Akt by affecting ubiquitination/degradation of Akt, we examined the ubiquitination and protein levels of Akt in the presence or absence of GATAD1 and/or the proteasome inhibitor MG132 after transfection with ubiquitin‐hemagglutinin in LO2 and HepG2 cells. GATAD1 decreased the ubiquitination level of Akt (anti‐Akt immunoprecipitation product) (Fig. 6C). Both GATAD1 overexpression and MG132 treatment increased the protein level of Akt but not the mRNA expression of Akt (http://onlinelibrary.wiley.com/doi/10.1002/hep.29750/suppinfo), suggesting that GATAD1 could stabilize Akt by inhibiting its ubiquitin‐mediated degradation. The phosphorylation level of glycogen synthase kinase 3β, a target of Akt, was also enhanced by GATAD1 (Fig. 6B). In light of our observation that GATAD1 could directly induce PRL3 expression, we postulated that GATAD1 might activate the Akt signaling pathway by up‐regulating PRL3. To prove this, we knocked down PRL3 expression in SK‐Hep1 and HepG2 cells. Western blot showed that knockdown of PRL3 by siRNA‐PRL3 reduced the levels of phospho‐Akt (Thr450), phospho‐Akt1 (Ser473), and phospho‐Akt2 (Ser474) (http://onlinelibrary.wiley.com/doi/10.1002/hep.29750/suppinfo). Moreover, GATAD1 increased the protein levels of PRL3 and phospho‐Akt (Ser 473) in GATAD1 expressing LO2 xenograft tumors compared to controls by western blot (Fig. 6D1). We also determined the protein expression of GATAD1, PRL3, and phospho‐Akt in paired HCC tumor tissues. The result showed that the protein levels of GATAD1, PRL3, and phospho‐Akt were consistently higher in tumor tissues compared to their adjacent normal tissues. Proliferating cell nuclear antigen as a marker for proliferation was also enhanced in HCC tumors (Fig. 6D2). Furthermore, PRL3 knockdown by siRNA‐PRL3 abolished the effect of GATAD1 on activating the Akt signaling pathway as evidenced by western blot and luc reporter assay (Fig. 6E1,2). Taken together, these results suggested that the effect of GATAD1 on activating the Akt signaling pathway was PRL3‐dependent. Because Akt is not the only target of PRL3,11, 12 we further investigated mTOR and p38 mitogen‐activated protein kinase in GATAD1 overexpressing cells. The results showed that phospho‐mTOR as well as the downstream effector of mTOR, phospho‐p70 S6 kinase (Thr389), and phospho‐4E‐BP1 were significantly elevated in GATAD1 overexpressing LO2 and HepG2 cells by western blot (http://onlinelibrary.wiley.com/doi/10.1002/hep.29750/suppinfo). Phospho‐p38 mitogen‐activated protein kinase was also up‐regulated in GATAD1 overexpressing LO2 and HepG2 cells (http://onlinelibrary.wiley.com/doi/10.1002/hep.29750/suppinfo), suggesting the activation of mTOR and p38 by GATAD1.
Figure 6.
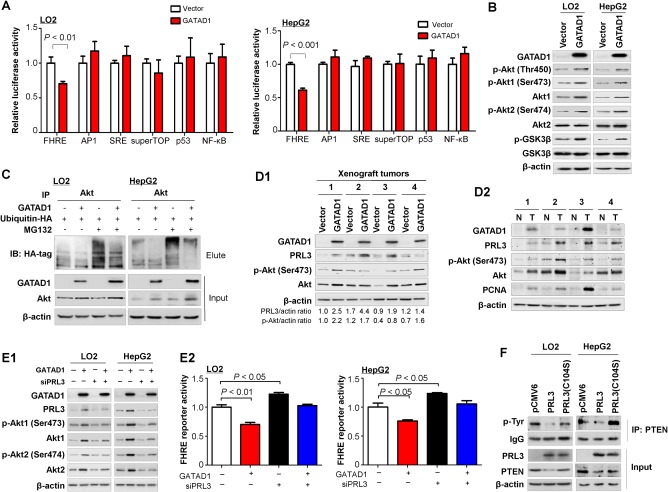
GATAD1 activates Akt signaling pathway. (A) GATAD1 activated the Akt pathway as evidenced by reduced FHRE luciferase activity. (B) Protein expression of factors in Akt signaling pathway in LO2 and HepG2 cells by western blot. (C) GATAD1 stabilized the Akt level by inhibiting its ubiquitin‐mediated degradation. (D) Protein expression of PRL3 and factors in the Akt signaling pathway in GATAD1 xenograft tumor tissues (D1) and paired HCC tumor tissues (D2). (E) Protein expression of factors in the Akt signaling pathway in GATAD1 stable expressing LO2 and HepG2 cells with transient knockdown of PRL3 by siPRL3 for 48 hours (E1). Relative FHRE luciferase activity in GATAD1 stable expressing LO2 and HepG2 cells with or without transient knockdown of PRL3 by siPRL3 for 48 hours (E2). (F) PRL3 reduced PTEN phosphorylation at the tyrosine residue by immunoprecipitation and PTEN protein in PRL3‐expressing LO2 and HepG2 cell lines by western blot. PRL3 (C104S), which was a catalytically inactive PRL3 mutant, was used as a negative control. Abbreviations: AP1, activator protein‐1; GSK, glycogen synthase kinase; HA, hemagglutinin; IB, immunoblot; IP, immunoprecipitation; N, nontumor; NF‐κB, nuclear factor kappa B; PCNA, proliferating cell nuclear antigen; SRE, serum response element; T, tumor.
PRL3 DEPHOSPHORYLATES PTEN AT TYROSINE AND CONSEQUENTLY ACTIVATES Akt SIGNALING
Our results indicated that PRL3 enhanced the Akt phosphorylation level at Ser473 and Ser474 and activated the Akt signaling pathway. However, PRL3 belongs to the protein tyrosine phosphatase family, whose physiological function is to dephosphorylate its substrates at tyrosine.16 Therefore, the mechanism by which PRL3 activated the Akt signaling pathway remains unclear. PRL3 down‐regulates PTEN expression, a negative regulator of the Akt pathway.11 Phosphorylation of PTEN at Tyr336 is required for maintenance of PTEN protein stability and prevention of PTEN degradation.17 We therefore speculated that PRL3 might dephosphorylate PTEN at tyrosine sites and consequently reduce the PTEN protein level. To confirm this hypothesis, immunoprecipitation was performed to determine the effect of PRL3 on PTEN phosphorylation and expression. PRL3 (C104S), which was a catalytically inactive PRL3 mutant, was used as a negative control. As expected, PRL3 clearly reduced PTEN phosphorylation at the tyrosine residue and PTEN protein in PRL3 overexpressing LO2 and HepG2 cell lines, with no significant changes in PRL3 (C104S) mutant cells (Fig. 6F). Collectively, these results suggested that PRL3 activated the Akt pathway by reducing tyrosine phosphorylation of PTEN and the PTEN protein level.
PRL3 INHIBITOR SUPPRESSES HCC GROWTH BY INHIBITING Akt SIGNALING
To assess the therapeutic potential and examine a landmark guiding to PRL3‐targeted therapy, we evaluated the anticancer activity of the PRL3 inhibitor 5‐[[5‐bromo‐2‐[(2‐bromophenyl)methoxy]phenyl]methylene]‐2‐thioxo‐4‐thiazolidinone (BR‐1) in one immortal hepatocyte cell line (LO2) and three HCC cell lines (SK‐Hep1, PLC5, and HepG2) with different PRL3 expression (Fig. 7A). Cells were treated with PRL3 inhibitor at a series of concentrations ranging from 0 to 50 μmol/L. PRL3 inhibitor showed different dose‐dependent and time‐dependent antiproliferative efficacy on the tested cell lines. The 50% inhibition concentration values of HepG2, SK‐Hep1, PLC5, and LO2 were 32.10, 35.23, 34.89, and 44.88 μmol/L, respectively (Fig. 7B1). HepG2 cells were more sensitive to PRL3 inhibitor treatment than SK‐Hep1 and PLC5 cells with moderate expression of PRL3. It was interesting to note that the 50% inhibition concentration of LO2 was much higher than that of other HCC cell lines, which implied that LO2 was more resistant to PRL3. Moreover, the sensitivity of the drug was in keeping with the expression levels of endogenous PRL3. These results indicated that PRL3 inhibitor treatment retarded HCC cell growth in a dose‐dependent manner but did not affect normal liver cell viability. In addition, we treated the cell lines with 30 μmol/L of BR‐1 to see the therapeutic effect of PRL3 inhibition on HCC cell lines. BR‐1 inhibited cell proliferation in a time‐dependent manner in HCC cell lines but had little effect on the immortal normal hepatocyte cell line LO2 (Fig. 7B2). To test whether BR‐1 repressed HCC in vivo, mice with HCC (HepG2) xenografts were treated with BR‐1 (50 mg/kg, intraperitoneal injection, three times per week). Treatment with BR‐1 resulted in significant suppression of tumor growth (Fig. 7C; http://onlinelibrary.wiley.com/doi/10.1002/hep.29750/suppinfo). Western blot showed that treatment with BR‐1 reduced the levels of phospho‐Akt1 (Ser473) and phospho‐Akt2 (Ser474) in SK‐Hep1 and HepG2 cells, which indicated that BR‐1 suppressed HCC growth by inhibiting the Akt signaling pathway (Fig. 7D). Moreover, we investigated the effect of BR‐1 on GATAD1‐mediated cell proliferation. LO2 and HepG2 cells stably transfected with GATAD1‐expressing or empty vector were treated with BR‐1. Our results showed that BR‐1 partially abolished the effect of GATAD1 on cell viability (Fig. 7E). Collectively, BR‐1 showed therapeutic impact on HCC and might be useful in HCC with GATAD1 and PRL3 high expression.
Figure 7.
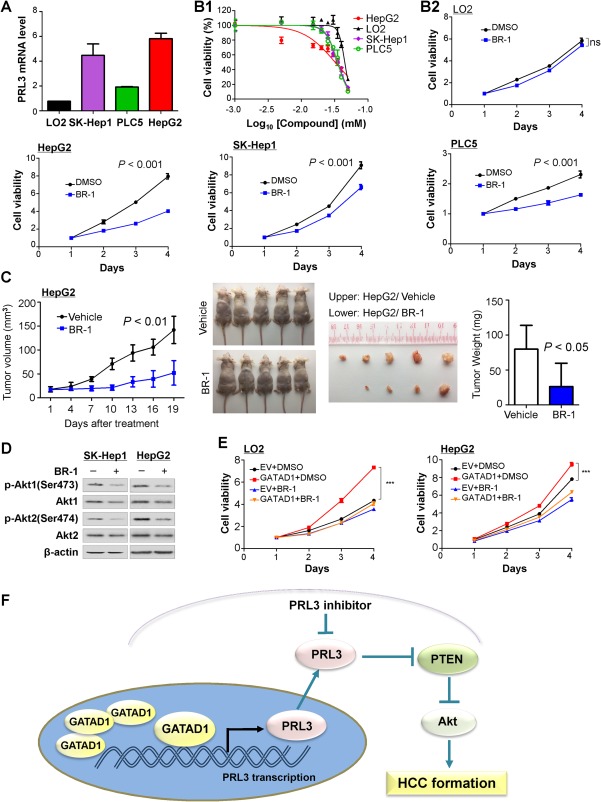
The PRL3 inhibitor BR‐1 suppresses HCC growth by inhibiting Akt signaling. (A) PRL3 mRNA expression in one immortal hepatocyte cell line (LO2) and three HCC cell lines (SK‐Hep1, PLC5, and HepG2). (B1) Effects of PRL3 inhibitor (BR‐1) on cell viability in LO2, SK‐Hep1, HepG2, and PLC5 cell lines. (B2) BR‐1 (30 μmol/L) inhibited cell proliferation in all three HCC cell lines (SK‐Hep1, PLC5, and HepG2) but not in LO2 cells. (C) Mice with HCC (HepG2) xenografts that were treated with BR‐1 (50 mg/kg, three times per week) showed suppression of tumor growth. (D) BR‐1 treatment reduced the active form of Akt1 and Akt2 by western blot. (E) Effect of GATAD1 on liver cell growth in the presence or absence of BR‐1. Cell growth was measured by the 3‐[4,5‐dimethylthiazol‐2‐yl]‐2,5 diphenyl tetrazolium bromide assay. Data are mean ± SD. *** P < 0.001. (F) Proposed mechanistic scheme of GATAD1 in promoting HCC through inducing PRL3 and activating the Akt signaling pathway in HCC. Abbreviations: DMSO, dimethyl sulfoxide; ns, nonsignificant.
Discussion
In this study, we demonstrated that GATAD1 was frequently overexpressed in primary HCC tumor tissues and HCC cell lines but silenced in normal human liver tissues due to copy number gain. It was reported that amplification at the 7q21 locus contributes to the development or progression of HCC.13 GATAD1, located at 7q21,12 was amplified in 33% of HCCs, which was significantly correlated with GATAD1 overexpression, suggesting that GATAD1 gene amplification contributes to its overexpression in HCCs. GATAD1 was overexpressed in up to 76% of cases, suggesting that, besides gene amplification, additional mechanisms (such as epigenetic regulation including microRNA) may also regulate the enhanced GATAD1 expression in HCC. Analyses of GATAD1 protein expression on 111 HCC tissue microarray slides demonstrated that GATAD1 protein was expressed in 76.6% of primary HCCs. Overexpression of GATAD1 was significantly associated with poor tumor differentiation (P < 0.0001). High GATAD1 expression was an independent risk factor of poor survival in patients with HCC. In particular, high GATAD1 expression was significantly associated with shorter survival and was an independent risk factor of poor survival for patients with stage I/II HCC (RR = 5.577, P = 0.002). These results suggested that GATAD1 overexpression could be regarded as a prognostic factor for HCC, especially in patients at TNM stages I/II. Patients with HCC vary greatly in clinical outcome, depending on the growth status and aggressiveness of tumors. At present, the most important clinical prognostic indicator of disease outcome is TNM stage. Nevertheless, some patients with early‐stage HCC still experience a poor outcome. Therefore, this additional prognostic biomarker is useful to provide better risk assessment of HCC patient prognosis.
We found that GATAD1 was commonly up‐regulated in patients with HCC. This implies the importance of the oncogenic function of GATAD1 during hepatocellular carcinogenesis. With this connection, we investigated the function of GATAD1 in HCC both in vitro and in vivo. Ectopic expression of GATAD1 in LO2 and HepG2 cells significantly enhanced cell viability and colony‐formation ability compared with empty vector transfection. Conversely, knockdown of GATAD1 in SK‐Hep1 and HepG2 cells significantly suppressed cell growth. Furthermore, subcutaneous xenograft and orthotopic models confirmed that GATAD1 significantly promoted tumorigenicity of HCC cells in nude mice. The mechanism by which GATAD1 promoted HCC cell growth was mediated by promoting G1–S cell cycle transition and inhibiting cell apoptosis. G1–S transition by GATAD1 was associated with the up‐regulation of cyclin D1 and CDK4 as well as the reduction of p27Kip1 and p21Cip1. The cyclin D1/CDK4 complex is a key regulator of the transition through the G1 phase of the cell cycle which governs cell cycle progression. The role of p21Cip1 and p27Kip1 as two key CDK inhibitors has been well accepted.18 Concomitantly, the growth‐enhancement effect of GATAD1 was also related to the inhibition of apoptosis, as evidenced by the GATAD1‐expressing cultured HCC cell lines and xenograft tumors in the nude mice. Apoptosis was mediated by the caspase‐dependent apoptosis pathway including casepase‐9, casepase‐3, casepase‐7, and poly(adenosine diphosphate‐ribose) polymerase.19 Therefore, GATAD1 exerts its effect by regulating the cell cycle and cell death to promote tumor growth.
To understand the molecular basis of the role of GATAD1, integrative analysis of RNA‐sequencing and transcription factor binding site prediction using ChIP sequencing was conducted for identification of the GATAD1 downstream targets. We first identified that PRL3 was a potential downstream target gene of GATAD1. The ectopic expression of GATAD1 enhanced expression of PRL3. Moreover, the interaction between GATAD1 and PRL3 was confirmed by ChIP‐PCR. Thus, GATAD1 can bind to the promoter of PRL3 and regulate its expression.
We then examined the functional role of PRL3 in HCC and revealed that PRL3 significantly enhanced HCC cell growth. In keeping with our findings, PRL3 was reported to promote tumor growth in several cancer types, signifying the oncogenic role of PRL3 in human cancers.7, 20, 21 We evaluated whether the oncogenic function of GATAD1 was dependent on PRL3 and found that PRL3 knockdown in HCC cells could significantly blunt the oncogenic effect of GATAD1, suggesting that the protumorigenic role of GATAD1 in HCC is dependent on PRL3.
Moreover, we elucidated the cancer pathways mediated by GATAD1 and found that GATAD1 activated the Akt signaling pathway. GATAD1 induced Akt phosphorylation at both Ser473 and Ser474 sites in GATAD1 overexpressing cells compared to control cells. We found that GATAD1 induced protein levels of total Akt and phospho‐Akt (Thr450); the latter affects Akt protein stability22 but did not change AKT mRNA expression. GATAD1 decreased the Akt ubiquitination; thus, GATAD1 enhanced Akt signaling mainly by stabilizing the Akt protein. In addition, GATAD1 increased PRL3 expression, which was known to activate Akt signaling by increasing phospho‐Akt.9, 11 Taken together, GATAD1 increased Akt activity through stabilizing Akt protein and enhancing phospho‐Akt by inducing PRL3. Protein levels of GATAD1, PRL3, and phospho‐Akt were consistently higher in xenograft tumors and in human HCC tissues. Collectively, these results indicated that GATAD1 is involved in the regulation of the Akt signaling pathway in HCC. We further investigated whether the effect of GATAD1 on Akt activation is dependent on PRL3. We found that knockdown of PRL3 partially diminished the effect of GATAD1 on Akt activation (Fig. 6), implying that GATAD1 activated Akt signaling at least in part through inducing PRL3.
PRL3 is a protein‐tyrosine phosphatase that plays regulatory roles in a variety of cellular processes, including stimulating progression from G1 into S phase during mitosis.21 PRL3 governs the dephosphorylation of a set of effectors, of which some are involved in regulating the Akt signaling pathway.11, 16 We evaluated the effect of PRL3 in Akt activation and observed a significant reduction of both phospho‐Akt (Thr450, Ser473, and Ser474) and total Akt levels following PRL3 knockdown in SK‐Hep1 and HepG2 cells, confirming that PRL3 activates Akt signaling in HCC cells. In this connection, we conducted experiments designed to test how PRL3, a protein‐tyrosine phosphatase, activates Akt signaling in HCC. We identified that PRL3 reduced the phosphorylation of PTEN at the tyrosine site, an active and stable form of PTEN. In keeping with this, PRL3 reduced PTEN protein expression. Reduced PTEN leads to accumulation of phosphatidylinositol‐3,4,5‐trisphosphate and then activates the Akt signaling pathway.6 Collectively, our results indicated that the oncogenic property of GATAD1 in HCC is, at least in part, dependent on the transcriptional induction of PRL3, which reduces the Akt negative regulator PTEN by dephosphorylation of PTEN at the tyrosine site and consequently activates the Akt signaling pathway (Fig. 7F).
In light of the oncogenic role of PRL3 by activating Akt signaling pathway in HCC, we evaluated the antitumorigenic effect of a PRL3 inhibitor (BR‐1) in HCC. We found that BR‐1 suppressed cell proliferation in three HCC cell lines and inhibited tumor growth in vivo in nude mice. Moreover, we confirmed that BR‐1 suppressed HCC cell proliferation by inhibiting the activation of Akt (Fig. 7D). Because PRL3 is the direct target of GATAD1 and no specific GATAD1 inhibitor is currently available, PRL3 inhibitor is a potential therapeutic target in HCC patients with GATAD1 expression.
In conclusion, we have identified an amplification gene, GATAD1, with overexpression in HCC. GATAD1 plays a pivotal oncogenic role in hepatocellular carcinogenesis. GATAD1 induces expression of its downstream transcriptional effector PRL3 by directly binding to its promoter, which in turn reduces the phosphorylation level of PTEN at the tyrosine site and therefore down‐regulates the protein level of PTEN and activates the Akt signaling pathway (Fig. 7F). All of these results provide a mechanistic explanation of the involvement of GATAD1 in activating the Akt signaling pathway. GATAD1 expression may serve as an independent poor prognostic factor for HCC patients.
Author names in bold designate shared co‐first authors.
Supporting information
Additional Supporting Information may be found at http://onlinelibrary.wiley.com/doi/10.1002/hep.29750/suppinfo.
Supporting Information 1
Potential conflict of interest: Nothing to report.
Supported by research funds from RGC‐GRF Hong Kong (14106415, 14111216 to J.Y.), Theme‐based Research Scheme of the Hong Kong Research Grants Council (T12‐403‐11 to J.Y. and H.L.Y.C.), Shenzhen Virtual University Park Support Scheme to CUHK‐SZRI (to J.Y.) and direct grant CUHK (to J.Y.).
Contributor Information
Henry L.Y. Chan, Email: hlychan@cuhk.edu.hk
Jun Yu, Email: junyu@cuhk.edu.hk.
REFERENCES
- 1. Siegel RL, Miller KD, Jemal A. Cancer statistics, 2015. CA Cancer J Clin 2015;65:5‐29. [DOI] [PubMed] [Google Scholar]
- 2. Wang K, Lim HY, Shi S, Lee J, Deng SB, Xie T, et al. Genomic landscape of copy number aberrations enables the identification of oncogenic drivers in hepatocellular carcinoma. Hepatology 2013;58:706‐717. [DOI] [PubMed] [Google Scholar]
- 3. Kim TM, Yim SH, Shin SH, Xu HD, Jung YC, Park CK, et al. Clinical implication of recurrent copy number alterations in hepatocellular carcinoma and putative oncogenes in recurrent gains on 1q. Int J Cancer 2008;123:2808‐2815. [DOI] [PMC free article] [PubMed] [Google Scholar]
- 4. Beroukhim R, Mermel CH, Porter D, Wei G, Raychaudhuri S, Donovan J, et al. The landscape of somatic copy‐number alteration across human cancers. Nature 2010;463:899‐905. [DOI] [PMC free article] [PubMed] [Google Scholar]
- 5. Nakanishi K, Sakamoto M, Yamasaki S, Todo S, Hirohashi S. Akt phosphorylation is a risk factor for early disease recurrence and poor prognosis in hepatocellular carcinoma. Cancer 2005;103:307‐312. [DOI] [PubMed] [Google Scholar]
- 6. Roberts LR, Gores GJ. Hepatocellular carcinoma: molecular pathways and new therapeutic targets. Semin Liver Dis 2005;25:212‐225. [DOI] [PubMed] [Google Scholar]
- 7. Zhao WB, Li Y, Liu X, Zhang LY, Wang X. Evaluation of PRL‐3 expression, and its correlation with angiogenesis and invasion in hepatocellular carcinoma. Int J Mol Med 2008;22:187‐192. [PubMed] [Google Scholar]
- 8. Al‐Aidaroos AQO, Yuen HF, Guo K, Zhang SD, Chung TH, Chng WJ, et al. Metastasis‐associated PRL‐3 induces EGFR activation and addiction in cancer cells. J Clin Invest 2013;123:4540‐4540. [DOI] [PMC free article] [PubMed] [Google Scholar]
- 9. Ye Z, Al‐Aidaroos AQO, Park JE, Yuen HF, Zhang SD, Gupta A, et al. PRL‐3 activates mTORC1 in cancer progression. Sci Rep 2015;5:17046. [DOI] [PMC free article] [PubMed] [Google Scholar]
- 10. Zimmerman MW, McQueeney KE, Isenberg JS, Pitt BR, Wasserloos KA, Homanics GE, et al. Protein‐tyrosine phosphatase 4A3 (PTP4A3) promotes vascular endothelial growth factor signaling and enables endothelial cell motility. J Biol Chem 2014;289:5904‐5913. [DOI] [PMC free article] [PubMed] [Google Scholar]
- 11. Wang HH, Quah SY, Dong JM, Manser E, Tang JP, Zeng Q. PRL‐3 down‐regulates PTEN expression and signals through PI3K to promote epithelial–mesenchymal transition. Cancer Res 2007;67:2922‐2926. [DOI] [PubMed] [Google Scholar]
- 12. Tsuruga T, Kanamoto T, Kato T, Yamashita H, Miyagawa K, Mishima HK. Ocular development‐associated gene (ODAG), a novel gene highly expressed in ocular development. Gene 2002;290:125‐130. [DOI] [PubMed] [Google Scholar]
- 13. Pang EYT, Bai AHC, To KF, Sy SMH, Wong NLY, Lai PBS, et al. Identification of PFTAIRE protein kinase 1, a novel cell division cycle‐2 related gene, in the motile phenotype of hepatocellular carcinoma cells. Hepatology 2007;46:436‐445. [DOI] [PubMed] [Google Scholar]
- 14. Vermeulen M, Eberl HC, Matarese F, Marks H, Denissov S, Butter F, et al. Quantitative interaction proteomics and genome‐wide profiling of epigenetic histone marks and their readers. Cell 2010;142:967‐980. [DOI] [PubMed] [Google Scholar]
- 15. Brunet A, Bonni A, Zigmond MJ, Lin MZ, Juo P, Hu LS, et al. Akt promotes cell survival by phosphorylating and inhibiting a Forkhead transcription factor. Cell 1999;96:857‐868. [DOI] [PubMed] [Google Scholar]
- 16. Rios P, Li X, Kohn M. Molecular mechanisms of the PRL phosphatases. FEBS J 2013;280:505‐524. [DOI] [PubMed] [Google Scholar]
- 17. Yim EK, Peng G, Dai H, Hu RZ, Li KY, Lu W, et al. Rak functions as a tumor suppressor by regulating PTEN protein stability and function. Cancer Cell 2009;15:304‐314. [DOI] [PMC free article] [PubMed] [Google Scholar]
- 18. Polyak K, Kato JY, Solomon MJ, Sherr CJ, Massague J, Roberts JM, et al. p27Kip1, a cyclin‐Cdk inhibitor, links transforming growth factor‐beta and contact inhibition to cell cycle arrest. Genes Dev 1994;8:9‐22. [DOI] [PubMed] [Google Scholar]
- 19. McIlwain DR, Berger T, Mak TW. Caspase functions in cell death and disease. Cold Spring Harb Perspect Biol 2015;7:a026716. [DOI] [PMC free article] [PubMed] [Google Scholar]
- 20. Laurent C, Valet F, Planque N, Silveri L, Maacha S, Anezo O, et al. High PTP4A3 phosphatase expression correlates with metastatic risk in uveal melanoma patients. Cancer Res 2011;71:666‐674. [DOI] [PubMed] [Google Scholar]
- 21. den Hollander P, Rawls K, Tsimelzon A, Shepherd J, Mazumdar A, Hill J, et al. Phosphatase PTP4A3 promotes triple‐negative breast cancer growth and predicts poor patient survival. Cancer Res 2016;76:1942‐1953. [DOI] [PMC free article] [PubMed] [Google Scholar]
- 22. Liao Y, Hung MC. Physiological regulation of Akt activity and stability. Am J Transl Res 2010;2:19‐42. [PMC free article] [PubMed] [Google Scholar]
Associated Data
This section collects any data citations, data availability statements, or supplementary materials included in this article.
Supplementary Materials
Additional Supporting Information may be found at http://onlinelibrary.wiley.com/doi/10.1002/hep.29750/suppinfo.
Supporting Information 1