Abstract
Magnesium and its alloys have the intrinsic capability of degrading over time in vivo without leaving toxic degradation products. They are therefore suitable for use as biodegradable scaffolds that are replaced by the regenerated tissues. One of the main concerns for such applications, particularly in load‐bearing areas, is the sufficient mechanical integrity of the scaffold before sufficient volumes of de novo tissue is generated. In the majority of the previous studies on the effects of biodegradation on the mechanical properties of porous biomaterials, the change in the elastic modulus has been studied. In this study, variations in the static and fatigue mechanical behavior of porous structures made of two different Mg alloys (AZ63 and M2) over different dissolution times ( , , and ) have been investigated. The results showed an increase in the mechanical properties obtained from stress–strain curve (elastic modulus, yield stress, plateau stress, and energy absorption) after and a sharp decrease after . The initial increase in the mechanical properties may be attributed to the accumulation of corrosion products in the pores of the porous structure before degradation has considerably proceeded. The effects of mineral deposition was more pronounced for the elastic modulus as compared to other mechanical properties. That may be due to insufficient integration of the deposited particles in the structure of the magnesium alloys. While the bonding of the parts being combined in a composite‐like material is of great importance in determining its yield stress, the effects of bonding strength of both parts is much lower in determining the elastic modulus. The results of the current study also showed that the dissolution rates of the studied Mg alloys were too high for direct use in human body. © 2018 Authors Journal of Biomedical Materials Research Part A Published by Wiley Periodicals, Inc. J Biomed Mater Res Part A: 106A: 1798–1811, 2018.
Keywords: biodegradation, magnesium alloy, porous biomaterials, mechanical properties, fatigue
INTRODUCTION
Open‐cell porous metallic biomaterials have many advantages over rigid biomaterials. For example, porous biomaterials have lower stiffness values, which helps better load transfer between the bone and implant, thereby avoiding stress shielding and the resulting bone resorption.1, 2 The interconnected hollow space inside these structures also facilitates uniform bone cell seeding.3 Some metals such as iron alloys (e.g., Fe‐Mn) as well as magnesium and its alloys have the intrinsic capability of degrading over time when being in contact with body fluids (corrosion).4 The degraded parts of biodegradable porous structures are replaced by biological tissues via physiological extracellular components.4 If the porous structure is biodegradable, it does not require removal or replacement by subsequent surgeries years after the implantation, which are usually costly, risky, and painful.5, 6 To keep the structural integrity of the implant, the degradation rate of the biodegradable scaffold should be close to the rate of new tissue regeneration.7
Magnesium is known as one of the best metallic biodegradable biomaterials. This is because in addition to being biodegradable, magnesium is an osteoconductive material and bone growth activator.4 One of the main concerns about the usage of pure magnesium for manufacturing of porous biomaterials is its fast degradation rate, which can cause failure of the implant before the new bone tissues have completely replaced it. Several works have been carried out on the study of microstructure, corrosion resistance, and mechanical properties of Mg and its alloys such as Mg–3Ca–2Zn, Zn‐Mg, Mg–3Ca, AZ91D, ZM21, Mg2Ca, AZ91, ZE41, and ZK60.8, 9, 10, 11, 12, 13, 14, 15, 16, 17, 18
By tuning the amount of alloying elements, the degradation rate of the magnesium alloy could be adjusted to be close to the rate of new bone regeneration. The results of a study by Aghion and Perez19 showed that increasing the porosity reduces the corrosion resistance of MRI 201S Mg alloy porous biomaterials significantly. They therefore suggested the use of a coating or some other surface treatments to restrain the degradation of scaffold. Cheng et al.20 reported that a homogeneous MgF2 coating on the surface of porous magnesium is able to suppress rapid corrosion.
The focus of the majority of the previous studies has been on the investigation of biodegradation rate of Mg alloys. Although the effect of biodegradation on the mechanical performance of porous biomaterials is one of the main concerns for using them as load‐bearing implants, only a few works6, 21, 22 have been carried out to address this aspect. For example, Lietaert et al.6 used NaCl spaceholders to produce porous structures made of four different magnesium alloys (M2, AZ63, ZM21, and MZX211). The results of their study showed that the dissolution rate of such materials is too high (leading to excessive hydrogen evolution and fast drop in the elastic modulus and yield stress of the scaffolds) and therefore they are not suitable for direct use in human body. They suggested carrying out postprocessing procedures to decrease the dissolution rate.
There are three questions that are of great importance for bone‐replacing Mg implants but have not been investigated before. First, besides the elastic modulus and yield stress investigated in Ref. 6, other mechanical properties such as plateau stress and energy absorption are also of great importance in determining the mechanical integrity of the Mg porous structure after being inserted into the body. Second, measurement of the noted mechanical properties in earlier times (such as and ) can also give a better impression on the involved effective mechanisms. Third, since the (load bearing) bone‐replacing implants are usually loaded in cyclic loads rather than static loads, studying their fatigue response can give a good overview on their performance in real life.
To further improve our understanding of the mechanical behavior of biodegradable Mg alloys,6 we studied here variations in the static mechanical properties of porous structures made of AZ63 and M2 magnesium alloys over different dissolution times. The elastic modulus, yield stress, plateau stress, and energy absorption after different degradation times , and were measured and compared to the corresponding values of nondegraded porous structures. In addition to static loads, the fatigue response of these porous biomaterials after different degradation times was also studied.
MATERIALS AND METHODS
Materials and manufacturing
The production of the specimens will only be described shortly here, a more detailed report is available in Ref. 6. The porous Mg specimens (Fig. 1) were produced by replication processing. NaCl particles with a diameter around 500 µm were used as the space holder material. NaCl was cold pressed isostatically to create an NaCl column, which was then placed in a furnace. The Mg alloy was placed on top of the NaCl column and the furnace was heated to 690°C. An Ar pressure of 3 bar was used to press the liquid metal in the NaCl column between the connected NaCl grains. The volumetric density of the NaCl in the final specimen is determined by the pressure in the cold isostatic press (CIP), which was 17.3 MPa in this case. Two different Mg alloys were used for infiltration: AZ63 (6 wt % of Al and 3 wt % of Zn) and M2 (2 wt % of Mn). As Al has been linked to neurological disorders, the AZ63 alloy is not a real biomedical alloy.23 In this research, AZ63 is considered as a benchmark, as the mechanical properties of Mg‐Al alloys have been studied more extensively than those of Mg‐Mn alloys. The Mg‐NaCl composites were machined into cylindrical specimens with diameters of 6 mm and heights of 10 mm. The NaCl space holders were removed with a solution which contained 0.133M Cl– and 0.15M F– in H2O (prepared from NaCl and NaF), thereby obtaining porous Mg alloys.
Figure 1.
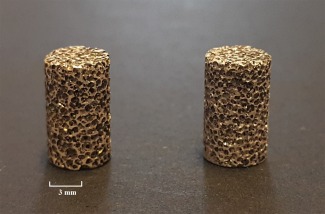
A view from M2 (left) and AZ63 (right) porous specimens.
In vitro degradation
The degradation setup for evaluating the degradation behavior of the specimens is also described in detail in Ref. 6. A static phosphate buffered saline (PBS) solution from Sigma Aldrich (P4417) was used as the degradation medium. The buffer system was used to keep the pH constant during degradation. The gas release during the degradation test was measured with an eudiometer and was used as a measure of the degradation rate. The smallest measureable amount of was 0.8 mL. The entire setup was kept at 37°C with a Julabo HC F20 thermal bath and specimens were retrieved after 6, 12, and 24 h of degradation. In the first 8 h, the volume of the released hydrogen gas was measured every hour, and then at the time points of 10, 12, and 24 h. Four specimens were tested for each combination of alloy and degradation period. After degradation process, the specimens were dried in a hot air oven at 65°C before further characterization.
The amount of release at the time points of , , and was compared between the two groups (i.e., M2 and AZ63) using a one‐way analysis of variance (ANOVA). All the analyses were performed using SPSS (IBM SPSS Statistics for Windows, Version 22.0. Armonk, NY: IBM) with the level of significance chosen at 0.05.
Characterization
A GE Phoenix Nanotom micro‐computed tomography (µCT) system was used to scan the specimens. Reconstruction was done with the Phoenix Datos|x2 software (GE, MA, United States). The settings used resulted in a voxel size of 5.5 × 5.5 × 5.5 µm3. CTAn software (Bruker, Belgium) was used to calculate the porosity of the scaffolds.
Metallography was also used to observe the grain shape and size of both the M2 and AZ63 structures. To do this, the specimens were ground using sand papers from 80 grit size to 2000 grit size. The surfaces of the specimens were then polished with respectively 3 and 1 µm polishing cloths. Both alloys were finally etched by applying 3 of the following etchant: 5 g picric acid, 10 mL nitric acid, 10 mL distilled water, and 80 mL ethanol. The microstructure of the specimens was observed with a scanning electron microscope instrument (SEM, JSM‐IT100, JEOL, Japan). The surfaces of the specimens were sputter‐coated with an electrically‐conducting material (gold) before carrying out the SEM imaging to avoid charging of the specimen. Energy‐dispersive spectroscopy (EDS) was used to analyze elemental composition in the cross‐section as well as the external surface of the specimens.
Mechanical testing
Compressive mechanical tests were carried out using an MTS machine (load cell of 10 kN) with a loading rate of 1.8 mm/min. The methodology used for obtaining the material constants of the porous structures was based on the one recommended by ISO 13314:2011.24 For each specimen, four different material constants, namely quasi‐elastic gradient (hereafter referred to as the elastic modulus) , yield stress , plateau stress , and energy absorption were obtained.
To calculate the yield stress, the initial linear part of the stress–strain curve was offset to the right side by 0.2% and its intersection with the stress–strain curve was measured. To have the plateau stress, the arithmetical mean of the stresses between 20% and 40% compressive strains was calculated.24 The elastic modulus of the porous structure was determined by calculating the slope of the line connecting the two points at stress levels of and (i.e., 20% and 70% of plateau stress) in the linear gradient part of the stress–strain curve. To calculate the energy absorption of the porous structure, the area below the stress–strain diagram was measured up to 50% strain (according to standard ISO 13314: 201124). The noted parameters were measured at different times of , and 24 for each alloy type. For each alloy and dissolution time, compressive mechanical tests were carried out for three specimens, and the average and standard deviation of their results were calculated. The mechanical properties were statistically compared to those determined at the initial time point using a Kruskall–Wallis test. All the statistical analyses were performed using SPSS (IBM SPSS Statistics for Windows, Version 22.0. Armonk, NY: IBM) with the level of significance chosen at 0.05. The results are provided in the supplementary material.
As for the fatigue tests, each specimen was loaded cyclically in compression‐compression. The loading ratio (the ratio of the minimum to the maximum peak load applied to the specimen in each cycle) was set to 10 for all the specimens and a loading frequency of 15 Hz was chosen. The maximum cyclic compressive load for each specimen was chosen to be 0.6 of the yield compressive load obtained from the quasi‐static tests.
RESULTS
µCT analysis
Table 1 shows that all the batches have a porosity close to 80% and that the intrabatch variation is acceptable. As control over the size and position of the spaceholders is limited, some intrabatch variation of porosity could be expected. The porosity of the samples was almost 100% interconnected and thus open, as determined from the micro‐CT scans. The ‘windows’ between different pores are controlled by the deformation of the NaCl particles during cold isostatic pressing. No quantitative data about the size of these ‘windows’ is available.
Table 1.
Change in Porosity of AZ63 and M2 Alloy Porous Structures Over Time
| Alloy | Degradation (h) | Average Porosity (%) | Min Porosity (%) | Max Porosity (%) |
|---|---|---|---|---|
| AZ63 | 0 | 80.80 | 80.11 | 81.95 |
| 6 | 78.99 | 78.14 | 79.58 | |
| 12 | 79.53 | 79.30 | 79.89 | |
| 24 | 81.48 | 80.98 | 81.92 | |
| M2 | 0 | 81.26 | 80.94 | 81.75 |
| 6 | 80.39 | 80.03 | 80.58 | |
| 12 | 80.78 | 80.35 | 81.15 | |
| 24 | 80.83 | 80.16 | 81.37 |
Degradation rate
Figure 2 shows the average degradation rates of the AZ63 and M2 specimens over 24 h together with the standard deviations. The average degradation rate for AZ63 was lower than that for M2. release in the group of AZ63 did not significantly differ from those of M2 at the time points of and (p‐values > 0.05), while it was significantly different at the time point of (p = 0.02). Moreover, the release rate in M2 slightly increased with time, while it was almost constant in AZ63 (Fig. 2). EDS measurements on AZ63 after showed very high amounts of Cl, Na, and Zn (about twice the amount of Mg), and considerable amount of Ca (Fig. 3), although the amount of minerals (Ca, Cl, Na, and Zn) decreased significantly at . However, EDS measurements on M2 showed that Mg is the most frequently found element at all the dissolution times and (Fig. 3). Examples of EDS patterns of dissolution products of both AZ63 and M2 porous structures are shown in Figure 4.
Figure 2.
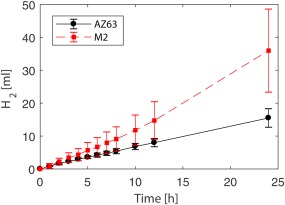
Average change in release with respect to time for both AZ63 and M2 alloy porous structures.
Figure 3.
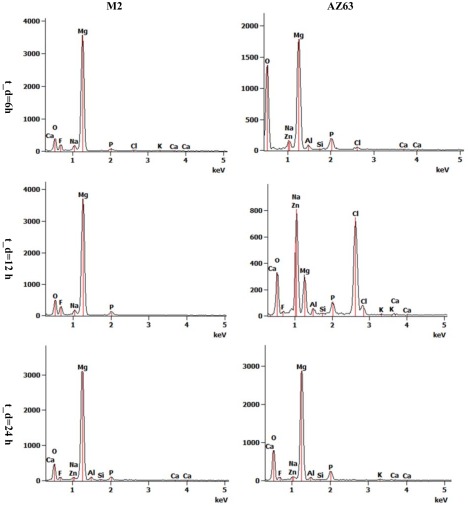
Examples of EDS patterns of the external surface of AZ63 and M2 alloy porous structures after 6, 12, and 24 h dissolution times.
Figure 4.
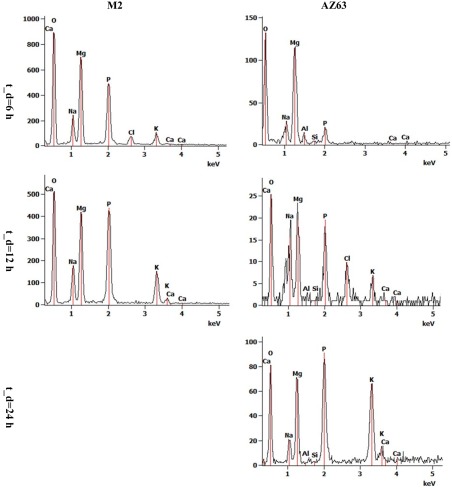
Examples of EDS patterns of dissolution products of AZ63 and M2 alloy porous structures after 6, 12, and 24 h dissolution times.
Metallography of both alloys demonstrated that a major part of the M2 specimens are mono‐phasic with no observable grain boundaries [Fig. 5(a)]. On the other hand, the cross‐section of struts in AZ63 specimens showed several grains with prominent boundaries [Fig. 5(b)]. The grain boundaries consisted of a very light‐colored cores and gray‐white textured area around them [Fig. 5(c,d)]. EDS measurements on the cross‐section of AZ63 porous structures showed that Mg is the dominant alloy inside the grains while the majority of the alloying elements (Zn and Al) are concentrated in the light part of the grain boundaries (Fig. 6). The alloying elements were also present in the textured areas but in lower amounts (Fig. 6). On the other hand, the element composition of all the areas in the cross‐section of M2 specimens was similar and no significant difference was observed (Fig. 7). Mineral deposition on AZ63 and M2 specimens after different dissolution times can be visually observed in Figures 8–9.
Figure 5.
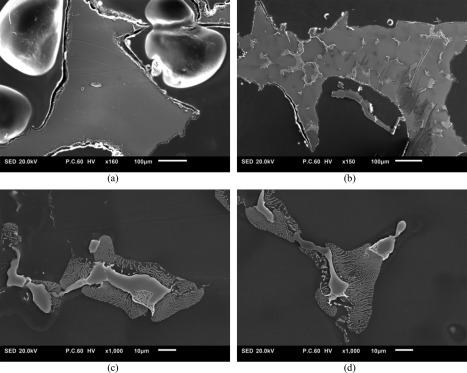
Etched cross‐section of (a) M2 and (b) AZ63 porous structures. The grains are easily recognizable in AZ63 cross‐sections. In (c, d) the grain boundaries of AZ63 are demonstrated in higher magnification.
Figure 6.
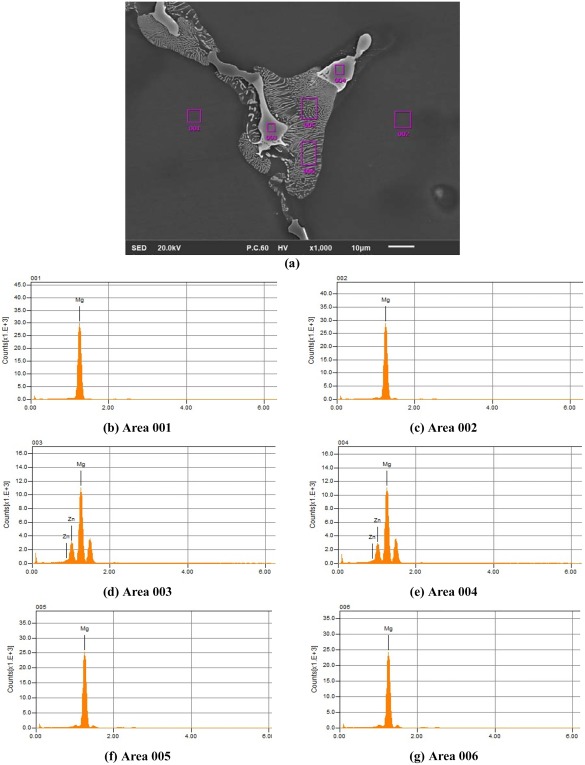
EDS pattern of the cross‐section of AZ63 porous structures in three different phases: (a) a part of the cross‐section including the grains (gray), the boundaries (white), and the area between them (textured in gray and white). The EDS measurements are shown in (b, c) for the inner parts of the grains, (d, e) in the boundaries of the grains, and (f, g) in the textured part.
Figure 7.
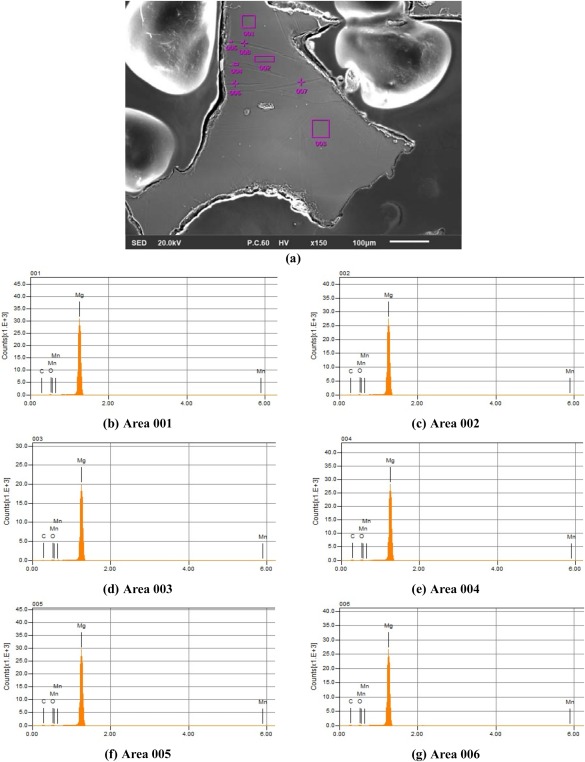
EDS pattern of the cross‐section of M2 porous structures: (a) a part of the cross‐section including the twin bands. (b–g) show the EDS measurements at points demonstrated in the top picture.
Mechanical response
The average stress‐strain curves of both AZ63 and M2 alloy porous structures after different dissolution times are shown in Figure 10. All the mechanical properties including elastic modulus, yield stress, plateau stress, and energy absorption of both AZ63 and M2 structures increased substantially after (Fig. 11). The values of the yield and plateau stresses as well as energy absorption capacity did not change significantly after another 6 h (i.e., ). For the yield stress, plateau stress, and energy absorption, the values of the noted parameters were slightly smaller after as compared to those after [Fig. 11(b–d)]. The elastic modulus showed a relatively large decrease after as compared to its value after [Fig. 11(a)]. After , all the noted mechanical properties showed a sharp decrease to values around or even smaller than their initial values. The middle raised part in the quasi‐static mechanical properties diagrams was more pronounced in the porous structures made of AZ63 magnesium alloy as compared to those made of M2 (Fig. 11). For example, from to , the average elastic modulus of the porous structure made of AZ63 alloy increased from 28 to 105.16 MPa (275.5% increase). In the same period of time, the increase in the elastic modulus of the porous structure made of M2 alloy was, however, from 12.96 to 15.01 MPa (15.8% increase).
Figure 10.
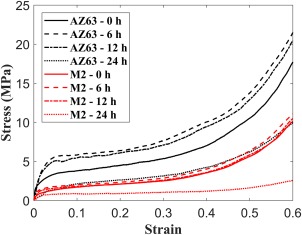
Average stress‐strain curves of AZ63 and M2 alloy porous structures after different dissolution times.
Figure 11.

Comparison of (a) elastic modulus, (b) yield stress, (c) plateau stress, and (d) energy absorption capacity of AZ63 and M2 porous structures at different dissolution times.
The plots presenting the mechanical properties were redrawn also in a normalized way (Fig. 12), which was defined as the mechanical property at each time divided by its initial value . Since the difference between the absolute values of mechanical properties of AZ63 and M2 was quite large, normalizing the mechanical properties would give a better impression on how the mechanical properties of each structure change with respect to its initial value due to dissolution. Similar to absolute mechanical property curves (Fig. 11), all the mechanical properties curves showed an increase in their value at and but showed a huge drop at . There were two interesting points in the normalized curves. First, while the normalized elastic modulus curve of AZ63 showed a significant increase at and , the increase in the elastic modulus of M2 at the two noted time points was not considerable [Fig. 12(a)]. Second, each porous structure had similar normalized curves of yield stress, plateau stress, and energy absorption [Fig. 12(c,d)].
Figure 12.
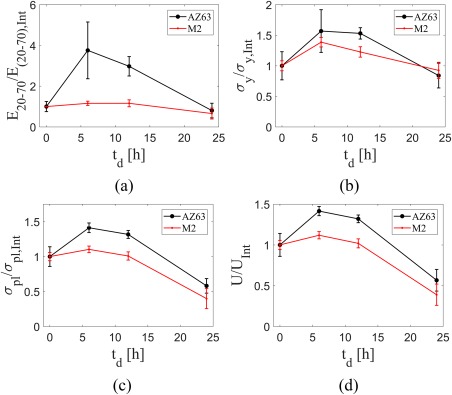
Comparison of normalized (a) elastic modulus, (b) yield stress, (c) plateau stress, and (d) energy absorption capacity of M2 and AZ63 porous structures at different dissolution times. The subscript “Int” stands for “Initial” and corresponds to mechanical properties before dissolution starts.
As for the fatigue tests, no failure was observed before 1,000,000 cycles in the specimens, except one which failed at cycle number around 900,000. According to previous studies,25 the cycle numbers that an implant needs to sustain in the first month after surgery is between 100,000 and 1,000,000 cycles. As a result, the cyclic tests were stopped after 1,000,000 cycles. Although due to limitations in the number of specimens, the fatigue tests were carried out at load ratio of 0.6 only, the unlimited fatigue life for this load ratio, also shows the unlimited fatigue lives for smaller load ratios. In one of the specimens (M2 sample after 6 h degradation), the cyclic loading was continued after 1 million cycles and it failed after around 2,000,000 cycles (Fig. 13). The displacement‐life curves of all the specimens were similar to each other and were straight horizontal lines. The displacement‐cycle curve of one of the samples which showed earlier fatigue failure is demonstrated in Figure 13(d). The other specimens did not show the final failure part.
Figure 13.
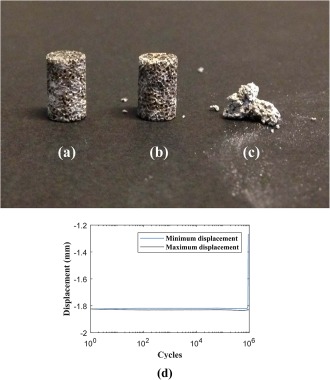
Views of an M2 specimen after 6 h degradation: (a) before fatigue tests, (b) after around 1,900,000 cycles, and (c) after around 2,000,000 cycles. (d) The displacement‐cycle diagram of one of the M2 specimens, which showed failure earlier than 1,000,000 cycles.
DISCUSSIONS
Mg alloys degrade in salty water through the following process4:
| (1) |
| (2) |
| (3) |
The release rate in M2 was higher than that in AZ63 (Fig. 2). One of the reasons can be the higher percentage of Mg present in M2 as compared to AZ63 (ca. 98% in M2 as compared to 90% in AZ63). Alloying pure magnesium could change the rate of degradation in four ways. First, some elements such as Ca, Zr, and Sr decrease the corrosion rate through grain refinement mechanisms.26 Although grain refinement leads to a large area of grain boundaries that cause galvanic corrosion, large grain boundaries could act as a more effective physical barrier to corrosion than coarse grains.27 In addition, a high fraction of grain boundaries is likely to accelerate passivation kinetics and reduce the intensity of micro galvanic coupling between grains and grain boundaries.28, 29 Second, some rare earth elements increase corrosion resistance while some other decrease. This is because different rare earth elements interact differently with the corrosion product layer. For instance, La and Nd oxides can combine with which improves corrosion resistance, while Er decreases corrosion resistance because it enhances the stability of the layer.26 Third, if alloying is of solid solution type, the alloying element(s) could change the corrosion potential. For example, it has been shown that increasing the content of Al in Al‐alloyed Mg decreases its corrosion rate.26, 30 Fourth, if the amount of alloying element exceeds the solid solubility of the metal, intermetallic phases are formed. Depending on the shape and size of the second phase, this could have a double role in the corrosion rate of the Mg alloy. A fine and continuous second phase slows the corrosion process whereas the presence of discontinuous second phase accelerates corrosion.26 This is because the corrosion products could form on the surface of the alloy and retard the corrosion of Mg matrix (to have a clearer picture, see Fig. 22b in Ref. 31). Among the four factors mentioned above, the latter two may have been playing a role in the higher corrosion rate of M2 as compared to AZ63, since AZ63 includes 6 wt % of Al. Moreover, metallography (Fig. 5) showed that the AZ63 microstructure is featured by Mg matrix and continuous second phase which has different compositions (Fig. 6). While M2 alloy only has a single phase with homogeneous composition (Fig. 7). It has also been shown15 that both Zn and Mn contents decrease the corrosion rate. Due to presence of both elements in both the alloys (Mn in M2 and Zn in AZ63), it is not possible to readily compare their corrosion resistance effects.
In the design stage of porous implants made of titanium or other nonbiodegradable materials, the main focus is mainly on tailoring the stiffness of the porous material, and other mechanical properties are usually of less importance as the safety factor of the implant is usually taken sufficiently high to avoid failures caused by yielding, collapsing of the cells, and so forth In the biodegradable magnesium implants, however, since the mechanical properties decrease over time, the stresses experienced by the implant can come close to the momentary yield and plateau stresses of the biodegradable material. Similarly, energy absorption capacity of the implant (mostly composed of post‐yielding strain of the material) becomes important to indicate the capability of the implant to deform under impact before being completely fractured.
Both the absolute and normalized mechanical properties curves showed an initial increase in their value after and and a sharp decrease after (Figs. 11 and 12). Two mechanisms are effective in determining the development of mechanical properties during dissolution. While dissolution decreases the mechanical behavior of the porous structure itself, the corrosion products trapped in the pores increase the mechanical properties of the system consisting of the porous structure and the corrosion products inside it. Depending on the degree each mechanism works, the resulted mechanical properties can be less or more than initial mechanical properties (i.e., before dissolution). The initial increase in the mechanical properties was more pronounced for AZ63. This initial increase in mechanical properties could be attributed to the more significant accumulation of corrosion products (Ca as well as other minerals such as Cl, Na, and Zn) over the AZ63 porous structure as compared to those in M2 porous structures (as shown in Fig. 3). Weight percentage of mineral elements on external surfaces of AZ63 samples also showed higher values after 6–12 h as compared to those of M2 specimens (see the details on weight percentage in the Supporting Information). Comparison of Figures 8 and 9 also demonstrates the higher mineral deposition in AZ63 structure as compared to M2 structure. It is not clear whether the initial increase in mechanical properties will be observed in an in vivo implant, since the matter which fills the pores over time would be of a different nature in vivo due to the presence of cells, limited fluid flow, a much more complex chemical environment and so forth. The release in AZ63 alloy was also much lower (about half) than that in M2 porous structure (Fig. 2), which shows its lower dissolution rate. While in M2 porous structure, the two mechanisms (dissolution decreasing mechanical properties and corrosion products increasing mechanical properties) balance out each other, in AZ63 structure, due to lower dissolution rate, the corrosion products take a big role in increasing the mechanical properties substantially after and . As the degradation continues, the structure loses its mechanical integrity significantly in both cases (the normalized mechanical properties of both AZ63 and M2 are very close after ). In AZ63 porous structures, the effects of mineral deposition was more pronounced for the elastic modulus [Figs. 11(a) and 12(a)] as compared to other mechanical properties [Figs. 11(b–d) and 12(b–d)]. This may be due to relatively weak bonding between the deposited particles and porous structure of the magnesium alloy. While the strength of the interfacial bonding between both parts in a composite‐like material is of great importance in determining the yield stress of the structure, the effects of interfacial bonding strength of the two parts may be of lower importance in determining the value of the elastic modulus of the composite‐like material. That is due to the fact that the load may be easily transferred between both un‐bonded phases through the normal component of the surface traction between both phases. Therefore, the load is distributed between the two phases which decreases the total displacement of the structure (i.e., increases the structure stiffness).
Figure 8.
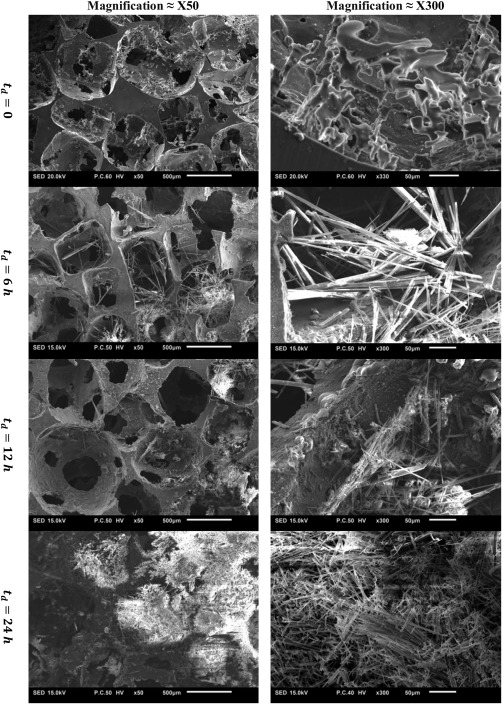
SEM images of M2 porous structures in two different magnifications (×50 and ×300) after 0, 6, 12, and 24 h.
Figure 9.
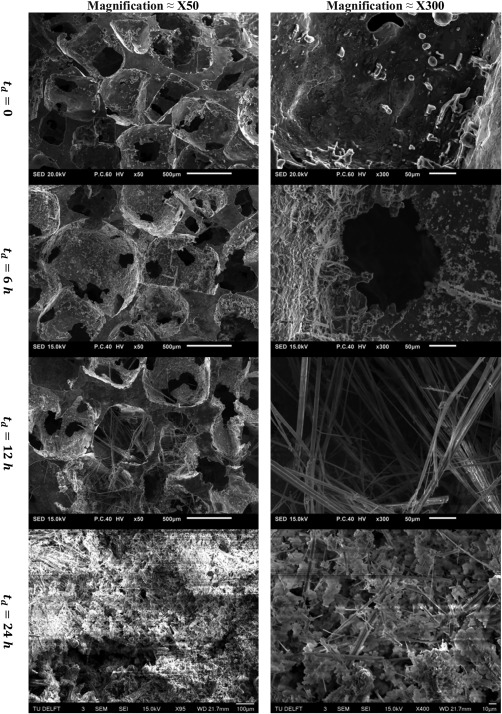
SEM images of AZ63 alloy porous structures in two different magnifications (×50 and ×300) after 0, 6, 12, and 24 h.
Degradation creates pitting on the surface of porous biomaterials, which can convert into notches, which in turn decrease the fatigue life of the porous structure. Our fatigue study showed that none of the specimens [except one specimen which failed in cycle number around 900,000, Fig. 13(d)] showed failure earlier than 1,000,000 cycles. In other words, if a porous Mg specimen is able to withstand static failure, it won't show fatigue failure for loads <60% of its yield load. The cyclic tests were not continued after 1,000,000 as this number is considered as indefinite fatigue life.32 This is because, in average, adults take approximately between 2.3 million (in the US33) to 3.7 million (in the Switzerland34) steps per year. Since the bone regeneration is usually completed after 4 months, the generated bone after around 1 million cycles will enhance the fatigue performance of porous implant. Our previous study showed that the endurance limit of porous biomaterial can increase up to 10‐fold after being filled by bone.35
The porous magnesium alloy structures usually show much higher degradation rates as compared to their solid (i.e., nonporous) counterparts. This is due to their much higher surface area per volume which increases their interaction with body fluids. There are many manufacturing methods to produce porous magnesium‐based structures. The main methods to manufacture magnesium‐based porous biomaterials with random pore distribution and size include removable spacer, low pressure casting, and powder sintering.4 The main techniques used for manufacturing regular magnesium‐based porous biomaterials are leaching, replication, vapor deposition, electrodeposition, space holder,36 and solid free‐form process.4 In recent years, some attempts have been made to manufacture regular periodic structures based on magnesium or its alloys.37, 38 Manufacturing of these structures using additive manufacturing techniques has more challenges compared to other biocompatible materials such as titanium,39, 40, 41 Nitinol,42 tantalum,43 and steel44 due to the high reactivity of magnesium and its alloys with oxygen and their significant flammability at high temperatures.38 Future developments in safe additive manufacturing techniques could assist in manufacturing Mg alloy porous structures with the desired topology that satisfies many factors such as low stiffness (close to bone), less surface area exposed to body fluids, and so forth.
Many other techniques have been proposed to decrease the corrosion rate of porous structures. One of the methods is using Fe as a scaffold material, as Fe has also shown biodegradation properties.45, 46 Contrary to magnesium, the main issue with Fe porous structures is their too slow degradation rate.4, 47 One of the promising methods to decrease the degradation rate of magnesium down to the tissue healing speed is using coating or other surface treatment techniques.48 The other method would be using specified amounts of biodegradation enhancing or diminishing materials in different cells of closed‐cell porous magnesium implant to tailor the degradation rate to values close to tissue regeneration. However, since impermeable closed‐cell structures are not very suitable for tissue regeneration, one suggestion could be using porous structures containing both open and closed cells wherein closed cells (which encapsulate biodegradation enhancing or diminishing biomaterials) are meant to tailor the degradation rate.
CONCLUSIONS
In this study, the variations in the static and fatigue mechanical properties of porous structures made of AZ63 and M2 magnesium alloys over different dissolution times ( , , and ) were studied. In vitro tests displayed higher release of H2 in M2 as compared to AZ63. The results showed an increase in the mechanical properties obtained from stress–strain curve (elastic modulus, yield stress, plateau stress, and energy absorption) after and a sharp decrease after . The initial increase in the mechanical properties could be attributed to the accumulation of corrosion products in the pores of the porous structure before degradation has considerably progressed. The effects of mineral deposition was more pronounced for the elastic modulus as compared to other mechanical properties, that is, yield stress, plateau stress, and energy absorption. This is because the deposited particles are not well bonded with the magnesium alloy porous structure. While the bonding strength of both parts in a composite‐like material is of great importance in determining its yield stress, the effects of bonding of the two parts is much lower in determining the elastic modulus due to the fact that the load could be easily transferred between the two phases through the normal component of the surface traction in the interface. The results of the fatigue study demonstrated high fatigue resistance of the porous Mg materials as they did not fail under cyclic loading for cyclic loading as high as 60% of their yield load.
Supporting information
Supporting Information
How to cite this article: Hedayati R, Ahmadi SM, Lietaert K, Tümer N, Li Y, Amin Yavari S, Zadpoor AA. 2018. Fatigue and quasi‐static mechanical behavior of bio‐degradable porous biomaterials based on magnesium alloys. J Biomed Mater Res Part A 2018:106A:1798–1811.
REFERENCES
- 1. Hedayati R, Sadighi Mohammadi Aghdam MM, Zadpoor AA. Mechanical properties of additively manufactured thick honeycombs. Materials 2016; 9:613. [DOI] [PMC free article] [PubMed] [Google Scholar]
- 2. Ahmadi S, Campoli G, Yavari SA, Sajadi B, Wauthlé R, Schrooten J, Weinans H, Zadpoor A. Mechanical behavior of regular open‐cell porous biomaterials made of diamond lattice unit cells. J Mech Behav Biomed Mater 2014;34:106–115. [DOI] [PubMed] [Google Scholar]
- 3. Hutmacher DW, Sittinger M, Risbud MV. Scaffold‐based tissue engineering: Rationale for computer‐aided design and solid free‐form fabrication systems. Trends Biotechnol 2004;22:354–362. [DOI] [PubMed] [Google Scholar]
- 4. Yusop A, Bakir A, Shaharom N, Abdul Kadir M, Hermawan H. Porous biodegradable metals for hard tissue scaffolds: A review. Int J Biomater 2012;2012:1. [DOI] [PMC free article] [PubMed] [Google Scholar]
- 5. Navarro M, Michiardi A, Castano O, Planell J. Biomaterials in orthopaedics. J Royal Soc Interface 2008;5:1137–1158. [DOI] [PMC free article] [PubMed] [Google Scholar]
- 6. Lietaert K, Weber L, Van Humbeeck J, Mortensen A, Luyten J, Schrooten J. Open cellular magnesium alloys for biodegradable orthopaedic implants. J Magnesium Alloys 2013;1:303–311. [Google Scholar]
- 7. Risbud MV, Sittinger M. Tissue engineering: Advances in in vitro cartilage generation. Trends Biotechnol 2002;20:351–356. [DOI] [PubMed] [Google Scholar]
- 8. Borodkin VS, Savitsky EM, Sivash KM, Stroganov GB, Terekhova VF, Tikhova NM, Volkov MV. Magnesium‐base alloy for use in bone surgery. 1972, Google Patents.
- 9. Jamesh M, Kumar S, Narayanan TS. Corrosion behavior of commercially pure Mg and ZM21 Mg alloy in Ringer's solution–Long term evaluation by EIS. Corrosion Sci 2011;53:645–654. [Google Scholar]
- 10. Kim W‐C, Kim J‐G, Lee J‐Y, Seok H‐K. Influence of Ca on the corrosion properties of magnesium for biomaterials. Mater Lett 2008;62:4146–4148. [Google Scholar]
- 11. Heakal FE‐T, Fekry A, Fatayerji M. Influence of halides on the dissolution and passivation behavior of AZ91D magnesium alloy in aqueous solutions. Electrochim Acta 2009;54:1545–1557. [Google Scholar]
- 12. Du H, Wei Z, Liu X, Zhang E. Effects of Zn on the microstructure, mechanical property and bio‐corrosion property of Mg–3Ca alloys for biomedical application. Mater Chem Phys 2011;125:568–575. [Google Scholar]
- 13. Li Z, Gu X, Lou S, Zheng Y. The development of binary Mg–Ca alloys for use as biodegradable materials within bone. Biomaterials 2008;29:1329–1344. [DOI] [PubMed] [Google Scholar]
- 14. Pereda M, Alonso C, Burgos‐Asperilla L, Del Valle J, Ruano OA, Perez P, De Mele MFL. Corrosion inhibition of powder metallurgy Mg by fluoride treatments. Acta Biomater 2010;6:1772–1782. [DOI] [PubMed] [Google Scholar]
- 15. Song G. Control of biodegradation of biocompatable magnesium alloys. Corros Sci 2007;49:1696–1701. [Google Scholar]
- 16. Liu X, Sun Zhou J, Yang F, Chang Y, Qiu R, Pu K, Li ZL, Zheng Y. Micro‐alloying with Mn in Zn–Mg alloy for future biodegradable metals application. Mater Des 2016;94:95–104. [Google Scholar]
- 17. Dinesh S, Senthilkumar Asokan VP, Arulkirubakaran D. Effect of cryogenic cooling on machinability and surface quality of bio‐degradable ZK60 Mg alloy. Mater Des 2015;87:1030–1036. [Google Scholar]
- 18. Kayhan SM, Tahmasebifar Koç A, Usta M, Tezcaner YA, Evis Z. Experimental and numerical investigations for mechanical and microstructural characterization of micro‐manufactured AZ91D magnesium alloy disks for biomedical applications. Mater Des 2016;93:397–408. [Google Scholar]
- 19. Aghion E, Perez Y. Effects of porosity on corrosion resistance of Mg alloy foam produced by powder metallurgy technology. Mater Charact 2014;96:78–83. [Google Scholar]
- 20. Cheng M‐Q, Wahafu T, Jiang G‐F, Liu W, Qiao Y‐Q, Peng X‐C, Cheng T, Zhang X‐L, He G, Liu X‐Y. A novel open‐porous magnesium scaffold with controllable microstructures and properties for bone regeneration. Sci Rep 2016;6:24134. [DOI] [PMC free article] [PubMed] [Google Scholar]
- 21. Alavi R, Trenggono A, Champagne S, Hermawan H. Investigation on mechanical behavior of biodegradable iron foams under different compression test conditions. Metals 2017;7:202. [Google Scholar]
- 22. Jurgeleit T, Quandt E, Zamponi C. Mechanical properties and in vitro degradation of sputtered biodegradable Fe‐Au foils. Materials 2016;9:928. [DOI] [PMC free article] [PubMed] [Google Scholar]
- 23. El‐Rahman SSA. Neuropathology of aluminum toxicity in rats (glutamate and GABA impairment). Pharmacol Res 2003;47:189–194. [DOI] [PubMed] [Google Scholar]
- 24. Standard I. ISO 13314: 2011 (E)(2011) Mechanical testing of metals—ductility testing—compression test for porous and cellular metals. Ref Number ISO. 13314(13314):p. 1–7.
- 25. Tudor‐Locke C, Bassett DR. How many steps/day are enough? Sports Med 2004;34:1–8. [DOI] [PubMed] [Google Scholar]
- 26. Zheng Y. Magnesium Alloys as Degradable Biomaterials. CRC Press; FL, United States, 2015. [Google Scholar]
- 27. Aung NN, Zhou W. Effect of grain size and twins on corrosion behaviour of AZ31B magnesium alloy. Corros Sci 2010;52:589–594. [Google Scholar]
- 28. Argade GR, Panigrahi SK, Mishra RS. Effects of grain size on the corrosion resistance of wrought magnesium alloys containing neodymium. Corros Sci 2012;58:145–151. [Google Scholar]
- 29. Alvarez‐Lopez M, Pereda MD, del Valle JA, Fernandez‐Lorenzo M, Garcia‐Alonso MC, Ruano OA, Escudero ML. Corrosion behaviour of AZ31 magnesium alloy with different grain sizes in simulated biological fluids. Acta Biomater 2010;6:1763–1771. [DOI] [PubMed] [Google Scholar]
- 30. Witte F, Hort N, Vogt C, Cohen S, Kainer KU, Willumeit R, Feyerabend F. Degradable biomaterials based on magnesium corrosion. Curr Opin Solid State Mater Sci 2008;12:63–72. [Google Scholar]
- 31. Song G, Atrens A. Understanding magnesium corrosion—A framework for improved alloy performance. Adv Eng Mater 2003;5:837–858. [Google Scholar]
- 32. Bobbert F, Lietaert Eftekhari K, Pouran A, Ahmadi B, Weinans SH, Zadpoor A. Additively manufactured metallic porous biomaterials based on minimal surfaces: A unique combination of topological, mechanical, and mass transport properties. Acta Biomater 2017;53:572–584. [DOI] [PubMed] [Google Scholar]
- 33. Wyatt HR, Peters JC, Reed GW, Barry M, Hill JO. A Colorado statewide survey of walking and its relation to excessive weight. Med Sci Sports Exer 2005;37:724–730. [DOI] [PubMed] [Google Scholar]
- 34. Sequeira MM, Rickenbach M, Wietlisbach V, Tullen B, Schutz Y. Physical activity assessment using a pedometer and its comparison with a questionnaire in a large population survey. Am J Epidemiol 1995;142:989–999. [DOI] [PubMed] [Google Scholar]
- 35. Hedayati R, Janbaz Sadighi S, Mohammadi‐Aghdam MM, Zadpoor A. How does tissue regeneration influence the mechanical behavior of additively manufactured porous biomaterials? J Mech Behav Biomed Mater 2017;65:831–841. [DOI] [PubMed] [Google Scholar]
- 36. Wen C, Yamada Y, Shimojima K, Chino Y, Hosokawa H, Mabuchi M. Compressibility of porous magnesium foam: Dependency on porosity and pore size. Mater Lett 2004;58:357–360. [Google Scholar]
- 37. Chung Ng C, Savalani M, Chung Man H. Fabrication of magnesium using selective laser melting technique. Rapid Prototyping J 2011;17:479–490. [Google Scholar]
- 38. Staiger MP, Kolbeinsson I, Kirkland NT, Nguyen T, Dias G, Woodfield TB. Synthesis of topologically‐ordered open‐cell porous magnesium. Mater Lett 2010;64:2572–2574. [Google Scholar]
- 39. Ahmadi SM, Yavari SA, Wauthle R, Pouran B, Schrooten J, Weinans H, Zadpoor AA. Additively manufactured open‐cell porous biomaterials made from six different space‐filling unit cells: The mechanical and morphological properties. Materials 2015;8:1871–1896. [DOI] [PMC free article] [PubMed] [Google Scholar]
- 40. Hedayati R, Leeflang A, Zadpoor A. Additively manufactured metallic pentamode meta‐materials. Appl Phys Lett 2017;110:091905. [Google Scholar]
- 41. Hedayati R, Yavari SA, Zadpoor A. Fatigue crack propagation in additively manufactured porous biomaterials. Mater Sci Eng: C 2017;76:457–463. [DOI] [PubMed] [Google Scholar]
- 42. Gorgin Karaji Z, Speirs Dadbakhsh MS, Kruth J, Weinans PH, Zadpoor AA, Amin Yavari S. Additively manufactured and surface biofunctionalized porous nitinol. ACS Appl Mater Interfaces 2017;9:1293–1304. [DOI] [PubMed] [Google Scholar]
- 43. Wauthle R, Van der Stok J, Yavari SA, Van Humbeeck J, Kruth J‐P, Zadpoor AA, Weinans H, Mulier M, Schrooten J. Additively manufactured porous tantalum implants. Acta Biomater 2015;14:217–225. [DOI] [PubMed] [Google Scholar]
- 44. Frazier WE. Metal additive manufacturing: A review. J Mater Eng Perform 2014;23:1917–1928. [Google Scholar]
- 45. Peuster M, Wohlsein P, Brügmann M, Ehlerding M, Seidler K, Fink C, Brauer H, Fischer A, Hausdorf G. A novel approach to temporary stenting: degradable cardiovascular stents produced from corrodible metal—results 6–18 months after implantation into New Zealand white rabbits. Heart 2001;86:563–569. [DOI] [PMC free article] [PubMed] [Google Scholar]
- 46. Farack J, Wolf‐Brandstetter C, Glorius S, Nies B, Standke G, Quadbeck P, Worch H, Scharnweber D. The effect of perfusion culture on proliferation and differentiation of human mesenchymal stem cells on biocorrodible bone replacement material. Mater Sci Eng: B 2011;176:1767–1772. [Google Scholar]
- 47. Hermawan H, Dubé D, Mantovani D. Degradable metallic biomaterials: Design and development of Fe–Mn alloys for stents. J Biomed Mater Res Part A 2010;93:1–11. [DOI] [PubMed] [Google Scholar]
- 48. Yavari SA, Ahmadi S, van der Stok J, Wauthlé R, Riemslag A, Janssen M, Schrooten J, Weinans H, Zadpoor AA. Effects of bio‐functionalizing surface treatments on the mechanical behavior of open porous titanium biomaterials. J Mech Behav Biomed Mater 2014;36:109–119. [DOI] [PubMed] [Google Scholar]
Associated Data
This section collects any data citations, data availability statements, or supplementary materials included in this article.
Supplementary Materials
Supporting Information


