

Abstract
Key points
This investigation assessed the influence of group III/IV muscle afferents on small muscle mass exercise performance from a skeletal muscle bioenergetics perspective.
Group III/IV muscle afferent feedback was attenuated with lumbar intrathecal fentanyl during intermittent isometric single‐leg knee‐extensor all‐out exercise, while 31P‐MRS was used to assess skeletal muscle bioenergetics.
Attenuation of group III/IV muscle afferent feedback improved exercise performance during the first minute of exercise, due to an increase in total ATP production with no change in the ATP cost of contraction. However, exercise performance was not altered during the remainder of the protocol, despite a sustained increase in total ATP production, due to an exacerbated ATP cost of contraction.
These findings reveal that group III/IV muscle afferents directly limit exercise performance during small muscle mass exercise, but, due to their critical role in maintaining skeletal muscle contractile efficiency, with time, the benefit of attenuating the muscle afferents is negated.
Abstract
The direct influence of group III/IV muscle afferents on exercise performance remains equivocal. Therefore, all‐out intermittent isometric single‐leg knee‐extensor exercise and phosphorous magnetic resonance spectroscopy (31P‐MRS) were utilized to provide a high time resolution assessment of exercise performance and skeletal muscle bioenergetics in control conditions (CTRL) and with the attenuation of group III/IV muscle afferent feedback via lumbar intrathecal fentanyl (FENT). In both conditions, seven recreationally active men performed 60 maximal voluntary quadriceps contractions (MVC; 3 s contraction, 2 s relaxation), while knee‐extensor force and 31P‐MRS were assessed during each MVC. The cumulative integrated force was significantly greater (8 ± 6%) in FENT than CTRL for the first minute of the all‐out protocol, but was not significantly different for the second to fifth minutes. Total ATP production was significantly greater (16 ± 21%) in FENT than CTRL throughout the all‐out exercise protocol, due to a significantly greater anaerobic ATP production (11 ± 13%) in FENT than CTRL with no significant difference in oxidative ATP production. The ATP cost of contraction was not significantly different between FENT and CTRL for the first minute of the all‐out protocol, but was significantly greater (29 ± 34%) in FENT than in CTRL for the second to fifth minutes. These findings reveal that group III/IV muscle afferents directly limit exercise performance during small muscle mass exercise, but, due to their critical role in maintaining skeletal muscle contractile efficiency, with time, the benefit from muscle afferent attenuation is negated.
Keywords: magnetic resonance spectroscopy, intrathecal fentanyl, muscle metabolism
Key points
This investigation assessed the influence of group III/IV muscle afferents on small muscle mass exercise performance from a skeletal muscle bioenergetics perspective.
Group III/IV muscle afferent feedback was attenuated with lumbar intrathecal fentanyl during intermittent isometric single‐leg knee‐extensor all‐out exercise, while 31P‐MRS was used to assess skeletal muscle bioenergetics.
Attenuation of group III/IV muscle afferent feedback improved exercise performance during the first minute of exercise, due to an increase in total ATP production with no change in the ATP cost of contraction. However, exercise performance was not altered during the remainder of the protocol, despite a sustained increase in total ATP production, due to an exacerbated ATP cost of contraction.
These findings reveal that group III/IV muscle afferents directly limit exercise performance during small muscle mass exercise, but, due to their critical role in maintaining skeletal muscle contractile efficiency, with time, the benefit of attenuating the muscle afferents is negated.
Introduction
Despite extensive investigation, a clear understanding of the influence of group III/IV muscle afferents on exercise performance has remained elusive. However, it is evident that these afferents constrain motoneuronal output during exercise, as evinced by the marked increase in motoneuronal output when feedback from group III/IV muscle afferents is attenuated (Amann et al. 2009, 2011a; Sidhu et al. 2014; Blain et al. 2016). These muscle afferents also constrain the intramuscular metabolic perturbation and the development of peripheral fatigue during exercise, which are both exacerbated by the attenuation of group III/IV muscle afferent feedback (Amann et al. 2009, 2011a; Sidhu et al. 2014; Blain et al. 2016). Thus, it may be anticipated that these muscle afferents influence exercise performance, but, remarkably, exercise performance has either been unaltered or diminished with the attenuation of group III/IV muscle afferent feedback (Amann et al. 2009, 2011a; Sidhu et al. 2014, 2017; Blain et al. 2016). Importantly, it must be acknowledged that the impact of the group III/IV muscle afferents on exercise performance in these previous studies using whole‐body exercise was likely influenced by a diminished oxygen delivery to the working skeletal muscle, secondary to the attenuated muscle afferent feedback (Amann et al. 2011b).
Recently, an intermittent isometric small muscle mass exercise protocol to task failure was utilized specifically to circumvent the reduction in oxygen delivery to the working skeletal muscle due to a fentanyl‐induced attenuation of group III/IV muscle afferent feedback (Broxterman et al. 2017b). In doing so, it was revealed that the ATP cost of muscle contraction was exacerbated during exercise with attenuated muscle afferent feedback. This finding indicates that group III/IV muscle afferent feedback is critically involved in maintaining efficient muscle contraction during submaximal exercise. Of importance, this increased ATP cost of contraction appeared to offset an increase in total ATP production, rendering exercise performance unaltered and, therefore, confounding conclusions regarding the influence of group III/IV muscle afferents on exercise performance. Unfortunately, due to large variations in time to task failure, an assessment of performance and skeletal muscle bioenergetics, throughout the exercise protocol, was precluded in this previous study (Broxterman et al. 2017b).
The intermittent isometric all‐out exercise protocol presents a unique opportunity for the high time resolution assessment of both exercise performance and skeletal muscle bioenergetics during maximal exercise (Burnley, 2009; Burnley et al. 2010; Broxterman et al. 2017a). This all‐out protocol is distinct from both time to task‐failure and time‐trial protocols, in that maximal exercise performance is assessed throughout the entire protocol, rather than only at task‐failure, without the confounding influence of pacing strategies. Additionally, this all‐out protocol recruits all motor units from the onset of exercise, and fatigue‐prone motor units (i.e. Type II) progressively contribute less to force generation (Sargeant et al. 1981; McCartney et al. 1983; Burnley, 2009; Vanhatalo et al. 2011), which is coupled with the progressive intramuscular metabolic perturbation and development of neuromuscular fatigue (Burnley, 2009; Burnley et al. 2010; Broxterman et al. 2017a). As such, the relative influence of group III/IV muscle afferent feedback on motor unit recruitment patterns and strategies, and therefore exercise performance (Bigland‐Ritchie et al. 1986; Garland & McComas, 1990; Hayward et al. 1991; Rossi et al. 2003; Martin et al. 2008; Kennedy et al. 2013), is likely progressively increased throughout the all‐out protocol. It may, therefore, be anticipated that the attenuation of group III/IV muscle afferent feedback will exacerbate the ATP cost of contraction only during the latter portion of the all‐out protocol, when activation of these muscle afferents is high and motor unit recruitment strategies are highly influential on exercise performance. These characteristics of all‐out exercise also provide a novel opportunity to further assess the influence of group III/IV muscle afferents on the perception of exertion during exercise. Thus, this all‐out exercise protocol provides a unique opportunity to assess the influence of the group III/IV muscle afferents on exercise performance across time when the role of these muscle afferents on skeletal muscle bioenergetics is likely changing substantially.
Therefore, the purpose of this investigation was to elucidate the influence of group III/IV muscle afferent feedback on exercise tolerance from a skeletal muscle bioenergetics perspective using lumbar intrathecal fentanyl and 31P‐MRS during all‐out intermittent isometric knee‐extensor exercise. We hypothesized that, compared to control conditions (CTRL), the attenuation of group III/IV muscle afferent feedback (FENT) during all‐out exercise would (1) increase total ATP production throughout the entire exercise protocol, (2) increase the ATP cost of contraction during the later portion of the exercise protocol, and therefore (3) exercise performance would be improved during the initial, but not the latter, portion of the protocol.
Methods
Ethical approval
The experimental protocol was approved by the Institutional Review Boards of the University of Utah and the Salt Lake City Veterans Affairs Medical Center (reference no. 00062889), and conformed to the standards set by the Declaration of Helsinki, except for registration in a database. Written informed consent was attained after subjects were informed of the experimental protocol and the potential risks of participation.
Subjects
Eight subjects completed the testing after providing written informed consent. Unique analyses of the control data, independent of the current study, were previously published (Broxterman et al. 2017a). The results of the current study are from seven healthy men (age, 27 ± 5 years; stature, 178 ± 4 cm; and body mass, 78 ± 9 kg), as data from one subject were excluded due to technical difficulties during data collection. Subjects were instructed to abstain from vigorous activity during the 24 h preceding each visit to the laboratory and to arrive at the laboratory having abstained from food and caffeine during the preceding 3 h. Subjects reported to the laboratory a minimum of three times with at least 72 h between each visit.
Experimental protocol
A single‐leg intermittent isometric knee‐extensor exercise protocol (60 maximal voluntary contractions; MVCs) was performed during a familiarization visit and two subsequent experimental visits. The 60 MVCs were conducted over 5 min using a 3 s contraction and 2 s relaxation duty cycle, maintained by audio cues. Subjects performed the exercise in a semi‐recumbent position (∼15° elevation of the trunk) with the knee supported (∼45° knee joint angle) and the ankle fixed to an immovable strain gauge (SSM‐AJ‐250, Interface Inc., Scottsdale, AZ, USA). Non‐elastic straps were positioned over the hips and thigh to minimize extraneous movements. For the experimental visits, the 60 MVC protocol with 5 min of recovery was conducted inside a whole‐body magnetic resonance imaging (MRI) system under both CTRL and FENT conditions, with at least 72 h between visits. Testing order and leg strength (i.e. MVC peak force) were balanced across subjects. The integrated force, mean force, and peak force were determined for each of the 60 MVCs and end‐test force was defined as the mean force of the final six MVCs (Burnley, 2009). At the 60th MVC, a rating of perceived exertion (RPE) was obtained from the subjects using the Borg modified CR10 scale (Borg, 1998).
Intrathecal fentanyl administration
For the fentanyl administration, subjects adopted an upright seated posture with the torso slightly flexed. After the skin and subcutaneous tissue at the L3–L4 vertebral interspace were anaesthetized using 1% lidocaine (10 mg ml−1), a 25‐gauge Whitacre needle was advanced into the intrathecal space through a 20‐gauge spinal introducer needle. Correct placement was confirmed by free‐flowing cerebrospinal fluid, which was aspirated and injected with 0.025 mg of fentanyl (0.050 mg ml−1) in order to attenuate feedback arising from μ‐opioid receptor‐sensitive group III and IV leg muscle afferents. The upright seated position was maintained for at least 5 min prior to positioning for the exercise protocol. Previous studies have documented that this intrathecal fentanyl administration protocol does not result in fentanyl migration to the brain (Amann et al. 2009, 2011a; Hilty et al. 2011; Sidhu et al. 2014, 2015; Blain et al. 2016) and does not affect motor nerve activity or maximal force output (Grant et al. 1996; Wilson & Hand, 1997; Standl et al. 2001; Amann et al. 2009).
31P‐MRS
A clinical 2.9 Tesla MRI system (Tim‐Trio, Siemens Medical Systems, Malvern, PA, USA) operating at 49.9 MHz for 31P resonance was utilized for MRS. 31P‐MRS data acquisition was obtained using a dual 31P‐1H surface coil (110 mm 1H coil loop surrounded by the 31P single‐loop coil with a diameter of 125 mm) with linear polarization (Rapid Biomedical GmbH, Rimpar, Germany). The surface coil was secured with elastic straps at mid‐thigh level and advanced localized volume shimming was performed after a three‐plane scout proton image was acquired in order to ensure sampling of all major quadriceps muscles. Two fully relaxed spectra were acquired at rest (3 averages per spectrum and a repetition time of 30 s) prior to the commencement of the 60 MVC protocol. MRS data acquisition throughout exercise and recovery were performed using a free‐induction decay pulse sequence with a 2.56 ms adiabatic‐half‐passage excitation RF pulse, a repetition time of 2.5 s, a receiver bandwidth of 5 kHz, 1024 data points, and two averages per spectrum. Saturation factors were quantified by the comparison between fully relaxed (repetition time = 30 s) and partially relaxed (repetition time = 2.5 s) spectra.
Relative concentrations of intramuscular PCr, Pi and ATP were determined by a time‐domain fitting routine using the AMARES algorithm (Vanhamme et al. 1997) incorporated into CSAIPO software (Layec et al. 2008; Le Fur et al. 2010), while absolute concentrations were estimated assuming a resting [ATP] of 8.2 mm (Harris et al. 1974). Intracellular pH was calculated from the chemical shift difference between the Pi and PCr signals. The free cytosolic [ADP] was calculated from [PCr] and pH using the creatine kinase (CK) equilibrium constant (), with the assumption that PCr represents 85% of the total creatine content (Jeneson et al. 1995). Resting concentrations were calculated from the average peak areas of the two fully relaxed spectra. When Pi splitting was evident, the pH corresponding to each Pi pool was calculated separately as pH1 and pH2 on the basis of the chemical shift of each peak relative to PCr, such that the overall pH was then calculated as:
The concentration of the H2PO4ˉ was calculated as (Lanza et al. 2006):
Free cytosolic adenosine monophosphate (AMP) was calculated based on the equilibrium of the adenylate kinase reaction corrected for the effects of pH, assuming a free magnesium concentration of 1 mm (Golding et al. 1995). ATP free energy (ΔG ATP) was calculated using the following equation and constants (Kemp et al. 2001):
With (Golding et al. 1995), R = 8.3145 K−1 m −1 and T = 310 K. In all cases, relative amplitudes were corrected for partial saturation due to the repetition time relative to T 1 via the fully relaxed spectra acquired at rest.
ATP synthesis rates and ATP cost of contraction
The rate of ATP production from the breakdown of PCr through the creatine kinase reaction (ATPCK, mm min−1) was calculated from the change in [PCr] for each time point of the exercise period (Kemp & Radda, 1994):
Based on the sigmoid relationship between the oxidative ATP production rate (ATPOX, mm min−1) and free cytosolic [ADP], the rate of mitochondrial ATP production was calculated as:
in which K m (the [ADP] at half‐maximal oxidation rate) is ∼30 μm in skeletal muscle (Kemp & Radda, 1994), 2.2 is the Hill coefficient for a sigmoid function (Jeneson et al. 1996) and V max is the peak rate of in vivo oxidative ATP synthesis.
During exercise, changes in intramuscular pH result from glycogen breakdown to pyruvate and lactate, proton efflux, buffering capacity, protons produced by oxidative phosphorylation, and the consumption of protons by the CK reaction (Kemp & Radda, 1994). Assuming that the glycogenolytic production of 1 mol of H+, when coupled to ATP hydrolysis, yields 1.5 mol of ATP, the ATP production from anaerobic glycolysis (ATPGLY, mm min−1) can be deduced from the total number of protons () produced throughout exercise (Hochachka & Mommsen, 1983; Kemp et al. 1993; Kemp & Radda, 1994):
where
(in mm min−1) was calculated from the time‐dependent changes in [PCr] and from the stoichiometric coefficient (γ):
where γ is the proton stoichiometric coefficient of the coupled Lohmann reaction as previously described (Kushmerick, 1997). (in mm min−1) was calculated from the apparent buffering capacity βtotal (in Slykes, millimoles acid added/unit change in pH) and from the rate of pH changes:
where
where
in which βa was determined from the initial change in PCr (ΔPCri) and alkalinization of pH (ΔpH) (Conley et al. 1997):
was determined based on the dissociation constant of the buffer (K) according to the standard formula (Conley et al. 1998):
where K = 1.77 × 10⁻⁷. In agreement with previous studies and assuming that muscle is a closed system during exercise (Kemp et al. 1993; Conley et al. 1998), βbicarbonate was set to zero. (in mm min−1) was calculated from the factor m = 0.16/[1 + 10(6.1‐pH)], which accounts for the amount of protons produced through oxidative ATP production (Kemp et al. 1993, 1997):
(in mm min−1) was calculated for each time point of exercise using the proportionality constant λ relating proton efflux rate to ΔpH (Kemp et al. 1993, 1997):
This proportionality constant λ (in mm min−1 pH unit−1) was calculated during the recovery period:
During the recovery period, PCr is regenerated through the CK reaction as the consequence of oxidative ATP production in mitochondria. Thus, can be calculated from the rates of proton production from the CK reaction (, in mm min−1) and mitochondrial ATP production (, in mm min−1) on one side and the rate of pH changes on the other side. At this time, ATP production is exclusively aerobic and lactate production is considered negligible:
To improve precision, a modified version of this calculation was used (Kemp et al. 1993, 1997), in which the total proton disappearance (i.e. ∫Edt) is estimated cumulatively from the start of recovery and then fitted to an exponential function to obtain the initial recovery rate (V efflux).
The total ATPase rate (ATPTOTAL, in mm min−1) was calculated for each time point as:
and the anaerobic ATPase rate (ATPANA, mm min−1) was calculated for each time point as:
The ATP cost of contraction (in mm N−1) was calculated as the ratio between ATPTOTAL and the force integral. The rates of ATP synthesis and the ATP cost of contraction were calculated for each for each minute of the 60 MVC protocol and were normalized to the first minute of CTRL exercise.
PCr recovery kinetics
The [PCr] kinetics during the recovery period were described by a mono‐exponential curve:
where [PCr](t) is the [PCr] at a given time (t), [PCr]end is the [PCr] at task failure, Δ[PCr] is the amount of PCr resynthesized during the recovery period, and τ represents the time constant of the PCr offset kinetics. The initial rate of PCr resynthesis (V iPCr) was calculated from the derivative of the mono‐exponential equation at the onset of recovery:
where Δ[PCr] is the amount of PCr resynthesized during the recovery period and the rate constant (Kemp & Radda, 1994). V max was calculated using V iPCr and the [ADP] at task failure (Trenell et al. 2006):
where K m (the [ADP] at half the highest oxidative rate) is ∼30 μm in skeletal muscle (Kemp & Radda, 1994).
Model variables were determined with an iterative process by minimizing the sum of squared residuals (RSS) between the fitted function and the observed values. Goodness of fit was assessed by visual inspection of the residual plot and the frequency plot distribution of the residuals, with the chi square values and the coefficient of determination (r 2) calculated as follows:
Statistical analysis
The peak force per contraction, the integral force per contraction and the 31P‐MRS data were analysed using two‐way ANOVAs (condition × time) with repeated measures. Student's paired t test was performed for each minute when a significant interaction effect was detected. The peak force of the exercise protocol, cumulative integrated force for each minute, RPE and peak rate of mitochondrial ATP synthesis were compared between conditions using Student's paired t test. Within each condition, ATPOX for each minute was compared with the 95% confidence interval around V max to determine whether maximal oxidative ATP production was attained. Significance for the statistical analysis was accepted at P ≤ 0.05. Results are presented as means ± SD, except for in figures where SEM is used for clarity.
Results
Effect of afferent blockade on exercise performance and RPE
FENT had no effect on peak force production (FENT: 592 ± 121 vs. CTRL: 572 ± 135 N, P = 0.22). The integrated force per contraction significantly decreased over time with a significant condition × time interaction (Fig. 1). For the first minute of exercise, the integrated force was significantly greater for FENT than CTRL (17,373 ± 2731 vs. 16,197 ± 3049 N; Fig. 1), while there was no difference for the second to fifth minutes (40,068 ± 5803 vs. 40,772 ± 6365 N, P = 0.63). In both conditions, force did not change over the final six MVCs (P > 0.05) and the resulting end‐test force values were not different between conditions (FENT: 220 ± 52 vs. CTRL: 210 ± 41 N, P = 0.60). RPE at the 60th MVC was significantly lower for FENT than CTRL (4.3 ± 2.6 vs. 9.9 ± 0.4; Fig. 2).
Figure 1. Force production during the all‐out intermittent isometric single‐leg knee‐extensor exercise protocol.
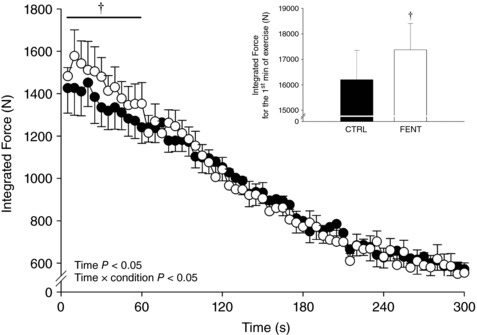
Seven subjects performed a series of 60 intermittent maximal voluntary contractions (3 s contraction, 2 s relaxation) over 5 min in both control (CTRL) and lumbar intrathecal fentanyl (FENT) conditions. The integrated force was determined per maximal voluntary contraction. Inset, the cumulative integrated force production for the first minute of exercise. Data are presented as means ± SEM. Significant time and interaction effects are indicated on the graph. †Significantly different from CTRL.
Figure 2. Rating of perceived exertion at the completion of the all‐out intermittent isometric single‐leg knee‐extensor exercise protocol.
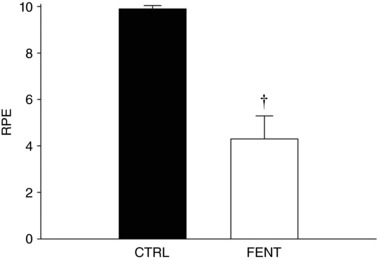
Ratings of perceived exertion (RPE) were obtained, using the Borg modified CR10 scale, from the subjects immediately upon completion of the exercise protocol in both control (CTRL) and lumbar intrathecal fentanyl (FENT) conditions. Data are presented as means ± SEM. †Significantly different from CTRL
Effect of afferent blockade on intramuscular metabolic perturbation
Recognizing the assumption that resting [ATP] was not different between FENT and CTRL, data required for the calculation of other metabolite concentrations at rest, baseline metabolic indices were not different between FENT and CTRL for [PCr] (FENT: 25.4 ± 4.1 vs. CTRL: 24.4 ± 1.6 mm, P = 0.32), [Pi] (FENT: 1.3 ± 0.2 vs. CTRL: 1.0 ± 0.2 mm, P = 0.92), [H2PO4ˉ] (FENT: 0.5 ± 0.1 vs. CTRL: 0.4 ± 0.1 mm, P = 0.95), pH (FENT: 7.00 ± 0.02 vs. CTRL: 6.99 ± 0.02, P = 0.48) and ΔG ATP (FENT: −65.5 ± 1.4 vs. CTRL: −66.5 ± 1.0 kJ mol−1, P = 0.15). All measured intramuscular variables changed significantly over time during the 60 MVCs and there were significant interaction effects only for [Pi], [H2PO4ˉ] and [ATP] (Fig. 3). There were no changes in intramuscular variables over the final six MVCs (P > 0.05) (Fig. 3). Intramuscular metabolite concentrations at the 60th MVC were significantly different between conditions for [Pi] (FENT: 37.4 ± 17.8 vs. CTRL: 27.6 ± 11.9 mm) and [H2PO4ˉ] (FENT: 25.0 ± 12.7 vs. 18.0 ± 8.5 mm), but not for [PCr] (FENT: 5.4 ± 2.4 vs. 5.0 ± 1.9 mm, P = 0.69), pH (FENT: 6.46 ± 0.07 vs. CTRL: 6.49 ± 0.04, P = 0.20) and [ATP] (FENT: 70.9 ± 28.4 vs. 78.8 ± 21.4%, P = 0.29; Fig. 3).
Figure 3. Intramuscular metabolites during the all‐out intermittent isometric single‐leg knee‐extensor exercise protocol.
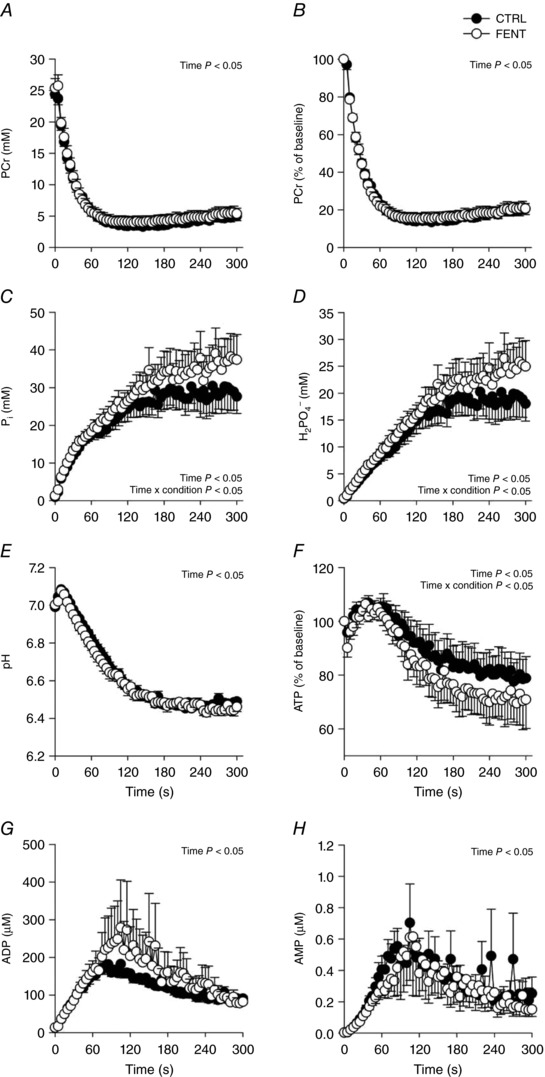
Intramuscular phosphocreatine (PCr, A and B), inorganic phosphate (Pi, C), diprotonated phosphate (H2PO4ˉ, D), pH (E), ATP (F), ADP (G) and AMP (H) were determined with phosphorous magnetic resonance spectroscopy (31P‐MRS) in both control (CTRL) and lumbar intrathecal fentanyl (FENT) conditions. Data are presented as means ± SEM. Significant time and interaction effects are indicated on the graphs.
Effect of afferent blockade on ATP synthesis rates, ATP cost of contraction and PCr recovery kinetics
For the first minute of exercise, CTRL values were as follows: ATPCK, 19.6 ± 1.3 mm min−1; ATPGLY, 8.8 ± 3.0 mm min−1; ATPANA, 28.4 ± 4.0 mm min−1; ATPOX, 45.8 ± 7.0 mm min−1; ATPTOTAL, 52.6 ± 5.2 mm min−1; and ATP cost of contraction, 0.04 ± 0.01 mm min−1 N−1. All ATP synthesis rates and the ATP cost of contraction changed significantly over time during the 60 MVCs. There were significant condition effects between FENT and CTRL for ATPCK, ATPGLY, ATPANA, ATPTOTAL and ATP cost of contraction, with significant interaction effects for ATPCK and ATP cost of contraction (Fig. 4). For the 60 MVCs, ATPANA was significantly greater (∼11%) for FENT than CTRL, arising from significantly greater ATPCK (∼9%) for the first minute and significantly greater ATPGLY (∼35%) throughout the 60 MVCs. ATPOX was not significantly different between FENT and CTRL (P = 0.14), and for both conditions ATPOX for each minute was within the 95% confidence interval of V max. There were no differences in the percentage contribution of ATPANA and ATPOX to ATPTOTAL between FENT and CTRL (P > 0.05; Fig. 4). For the PCr recovery kinetics, there were no differences between FENT and CTRL: amplitude, 23.9 ± 4.3 vs. 22.2 ± 4.2 mm, P = 0.15; V max, 34.4 ± 12.3 vs. 28.3 ± 5.6 mm min−1, P = 0.24; τ, 54.2 ± 13.4 vs. 54.9 ± 11.3 s, P = 0.89; V iPCr, 27.7 ± 7.6 vs. 24.6 ± 3.8 mm min−1, P = 0.391; and , 6.6 ± 2.8 vs. 4.3 ± 1.4 mm min−1, P = 0.07).
Figure 4. Adenosine triphosphate (ATP) synthesis rates and the ATP cost of contraction during the all‐out intermittent isometric single‐leg knee‐extensor exercise protocol.
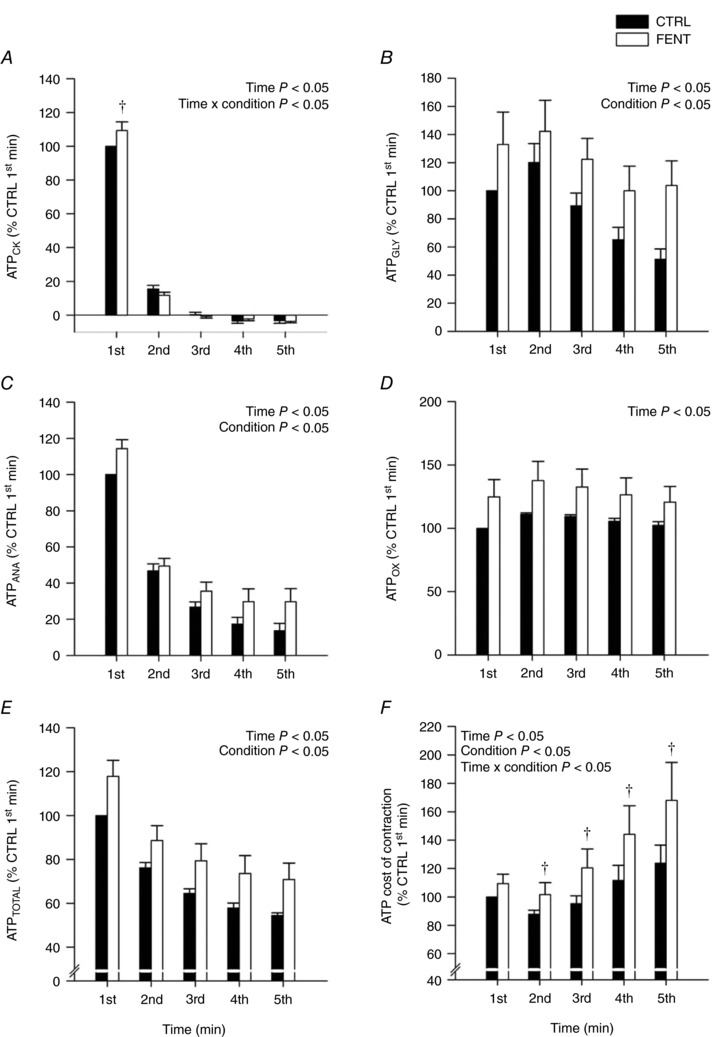
Rates of ATP synthesis through the creatine kinase reaction (ATPCK, A), anaerobic glycolysis (ATPGLY, B), cumulative anaerobic metabolism (ATPANA, C), oxidative phosphorylation (ATPOX, D), total ATPase rate (ATPTOTAL, E) and the ATP cost of contraction (F) were determined in both control (CTRL) and lumbar intrathecal fentanyl (FENT) conditions. These variables were calculated for each minute of the 60 MVC protocol and were normalized to the first minute of CTRL exercise. Data are presented as means ± SEM for each minute of exercise. Significant time, condition and interaction effects are indicated on the graphs. †Significantly different from CTRL at specific time point.
Discussion
This study sought to elucidate the influence of group III/IV muscle afferents on exercise performance during maximal small‐muscle mass exercise from a skeletal muscle bioenergetics perspective. Consistent with our first hypothesis, a greater total ATP production was sustained throughout the all‐out exercise protocol when group III/IV muscle afferent feedback was attenuated. This metabolic reserve was provided by the anaerobic energetic pathways of the active skeletal muscle. In support of our second hypothesis, when group III/IV muscle afferent feedback was attenuated, the ATP cost of contraction was exacerbated during the latter, but not the initial, portion of the exercise protocol. This finding reinforces the important role of group III/IV muscle afferents in maintaining efficient skeletal muscle contractile function during high‐intensity exercise. Supporting our third hypothesis, the attenuation of group III/IV muscle afferent feedback improved exercise performance (∼8%) during the initial, but not the latter, portion of the all‐out protocol. The time‐dependent alterations in exercise performance appear to have been the result of the ensemble product of the changes in total ATP production and the ATP cost of contraction. These findings reveal that group III/IV muscle afferents directly limit exercise performance during small muscle mass exercise, but, due to their critical role in maintaining skeletal muscle contractile efficiency, with time, the benefit of attenuating muscle afferents is negated.
Intramuscular metabolic perturbation
In the current study, a greater accumulation of Pi and H2PO4ˉ, and a greater depletion of ATP occurred during the all‐out exercise when feedback from the group III/IV muscle afferents was attenuated (Fig. 3). Of note, this greater accumulation of Pi and H2PO4ˉ was incurred despite no difference in PCr depletion between FENT and CTRL, which was likely due to the greater depletion of ATP (Fig. 3) and the substantial increase in glycolytic energy production (Fig. 4) during FENT compared to CTRL (Marsh et al. 1991; Chilibeck et al. 1998). These findings are consistent with two previous reports during both whole‐body cycling exercise (Blain et al. 2016) and submaximal small muscle mass exercise (Broxterman et al. 2017b). Collectively, these data demonstrate that group III/IV muscle afferents constrain the maximal level of intramuscular metabolic perturbation during severe intensity exercise, which appears to be consistent during both large and small muscle mass exercise (Hogan et al. 1999; Burnley et al. 2010; Vanhatalo et al. 2010, 2016; Chidnok et al. 2013). The intramuscular metabolic data from the current study have important implications for the influence of group III/IV muscle afferents on the development of neuromuscular fatigue. Specifically, the greater accumulation of Pi and H2PO4ˉ suggests a greater development of peripheral fatigue (Blain et al. 2016; Broxterman et al. 2017a), which, coupled with the similar fall in MVC between conditions, implies that the attenuation of group III/IV muscle afferent feedback decreased the development of central fatigue. These findings are consistent with previous demonstrations of reduced central fatigue and exacerbated peripheral fatigue development during whole‐body exercise with attenuated group III/IV muscle afferent feedback (Amann et al. 2009, 2011a; Sidhu et al. 2014, 2017; Blain et al. 2016). Importantly, the current study also reveals that an increased ATP cost of contraction is another factor, in addition to decreased oxygen delivery (Amann et al. 2011b), that may explain the exacerbated development of peripheral fatigue during exercise with attenuated group III/IV muscle afferent feedback.
Exercise performance and skeletal muscle biogenetics
Exercise performance has been unaltered or diminished with attenuation of group III/IV muscle afferent feedback, despite the lifting of constraints on motoneuronal output, intramuscular perturbation and neuromuscular fatigue (Amann et al. 2009, 2011a; Sidhu et al. 2014, 2017; Blain et al. 2016). However, it has, over time, been recognized that the exercise performance outcomes in these previous studies were likely the result of a diminished oxygen delivery to the working skeletal muscle (Amann et al. 2011b) leading to an exacerbated rate of intramuscular perturbation and neuromuscular fatigue development (Blain et al. 2016; Broxterman et al. 2017a). These effects offset any direct benefit of attenuating group III/IV muscle afferent feedback on exercise performance (Amann & Calbet, 2008). With this in mind, an important aspect of the current study is that oxygen delivery to the working skeletal muscle was likely similar between conditions, as indicated by the oxygen delivery‐sensitive variables of oxidative ATP synthesis, , and the peak rate of mitochondrial ATP synthesis (Kemp et al. 1993, 1997; Haseler et al. 1999, 2007; Layec et al. 2013; Broxterman et al. 2017b), facilitated by the substantial hyperaemia that occurs between contractions during intermittent isometric exercise (Lind & Williams, 1979; Wigmore et al. 2004, 2006). Interestingly, however, despite circumventing the issue of diminished oxygen delivery, overall exercise performance was still not altered by the attenuation of group III/IV muscle afferent feedback (Fig. 1). This finding is consistent with our previous report during submaximal exercise to task failure (Broxterman et al. 2017b). In both of these studies, the attenuation of group III/IV muscle afferent feedback exacerbated the ATP cost of contraction, which, as with previous reductions in oxygen delivery, appears to have offset the greater total ATP production resulting from the attenuation of group III/IV muscle afferent feedback on exercise performance (Figs 1 and 4).
A novel aim of the present study was, however, to perform a high time resolution assessment of maximal exercise performance and skeletal muscle bioenergetics. Importantly, this revealed a substantial improvement (∼8%) in exercise performance during the first minute of exercise (Fig. 1). Thus, it appears that for the first minute of exercise, attenuating group III/IV muscle afferent feedback likely unbridled motoneuronal output, which resulted in an increase in total ATP production which was translated into improved force production. Unlike subsequent time periods, the initial minute of exercise without muscle afferent feedback did not result in an increase in the ATP cost of contraction, facilitating the successful translation of the greater total ATP production into improved force production (Figs 1 and 4). The higher rate ATP synthesis was attributable to the anaerobic energetic pathways (i.e. creatine kinase and glycolysis). This reserve in anaerobic ATP production demonstrates that exercise performance in control conditions is not limited by the maximal capacity of skeletal muscle metabolism, but, rather, the group III/IV muscle afferents constrain exercise performance, likely through their direct effect on motoneuronal output (Amann et al. 2009, 2011a; Sidhu et al. 2014; Blain et al. 2016).
During the second to fifth minutes of the all‐out exercise, performance was not altered by the attenuation of group III/IV muscle afferent feedback (Fig. 1). The total ATP production during this portion of the protocol remained substantially elevated with the attenuated group III/IV muscle afferent feedback, likely as the result of the continued unbridling of motoneuronal output. However, this did not translate into an improved force production, as the ATP cost of contraction progressively increased due to the secondary effects of attenuating group III/IV muscle afferent feedback (Figs 1 and 4). Speculatively, these secondary effects may have included compromised afferent mediated reciprocal inhibition of antagonist muscle (Enoka & Duchateau, 2008; Martin et al. 2008; Kennedy et al. 2013), motor unit rotation during exercise (Bawa & Murnaghan, 2009), or alterations of motor unit firing rate during exercise (Bigland‐Ritchie et al. 1986). The current findings may also indicate that group III/IV muscle afferent feedback is important for the appropriate interplay between substrate level and oxidative phosphorylation during exercise, preventing an untenable rise in mitochondrial respiration stimulants. Overall, the time course dependent nature of exercise performance with attenuated group III/IV muscle afferent feedback, was likely the ensemble product of alterations in total ATP production and the ATP cost of contraction, as illustrated in Fig. 5.
Figure 5. Graphical illustration of the skeletal muscle bioenergetic influence on exercise performance during the all‐out intermittent isometric single‐leg knee‐extensor exercise protocol.
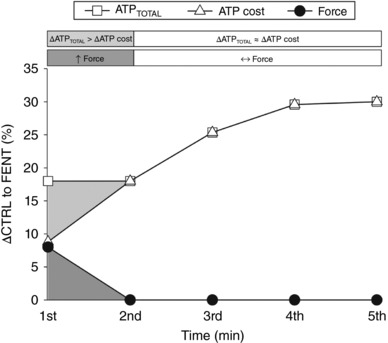
The percentage difference between control (CTRL) and lumbar intrathecal fentanyl (FENT) conditions (ΔCTRL to FENT) for integrated force, total adenosine triphosphate production (ATPTOTAL) and the ATP cost of contraction are plotted for each minute of the protocol. Integrated force was significantly greater in FENT than CTRL for the first minute of exercise (dark grey shading), when ATPTOTAL was significantly increased (light grey shading) with no significant change in the ATP cost of contraction. Integrated force was not significantly different between FENT and CTRL for the 2nd–5th min of exercise despite the sustained increase in ATPTOTAL, due to the significantly increased ATP cost of contraction in FENT compared to CTRL.
Implications for the force–duration relationship
The relationship between exercise intensity and exercise tolerance within the severe‐intensity domain is well‐described by a hyperbolic equation (Hill & Lupton, 1923; Hill, 1925; Monod & Scherrer, 1965; Moritani et al. 1981; Poole et al. 1988). The asymptote of this relationship defines the highest attainable steady state for aerobic energy production without continually utilizing the finite capacity for work above this asymptote, defined by the curvature constant of this relationship (Monod & Scherrer, 1965; Moritani et al. 1981; Poole et al. 1988; Jones et al. 2008; Copp et al. 2010; Vanhatalo et al. 2010; Dekerle et al. 2012; Broxterman et al. 2014, 2015a). The asymptote of this relationship can be determined from the end‐test force of the all‐out exercise protocol utilized in the current study (Burnley, 2009). Interestingly, the end‐test force was not affected by group III/IV muscle afferent attenuation (Fig. 1). Together with no effect on oxidative ATP production, this finding suggests that aerobic metabolism was not diminished by attenuating group III/IV muscle afferent feedback. Cumulating evidence supports the concept that group III/IV muscle afferents are critically involved in determining the curvature constant of the force–duration relationship (Broxterman et al. 2015b; Hureau et al. 2016). The current findings support this, as attenuation of group III/IV muscle afferent feedback increased exercise performance during the initial portion of the all‐out protocol, when the bioenergetic sources associated with the curvature constant are primarily utilized. However, as the curvature constant cannot be precisely determined with this specific all‐out exercise protocol (Burnley, 2009), this remains to be confirmed. Collectively, the current data suggest that group III/IV muscle afferents are likely critically involved in determining the curvature constant of the force–duration relation, while the asymptote of this relationship does not appear to be influenced by these muscle afferents.
Perception of effort during all‐out exercise
It is becoming increasingly apparent that, amongst other factors, group III/IV muscle afferent feedback directly influences the perception of effort during exercise (Amann et al. 2013). Recently, it was demonstrated that attenuation of group III/IV muscle afferent feedback reduced RPE by ∼50% at task‐failure during small muscle mass exercise (Broxterman et al. 2017b). In agreement with this previous study, RPE in the current study was reduced by ∼60% with the attenuation of feedback from group III/IV muscle afferents during all‐out small muscle mass exercise (Fig. 2). Thus, the current findings offer additional evidence that group III/IV muscle afferents influence the perception of effort during exercise.
Conclusions
This study revealed two novel findings regarding the influence of group III/IV muscle afferents on small muscle mass exercise performance. First, there is an anaerobic metabolic reserve within skeletal muscle that, when group III/IV muscle afferent feedback is attenuated, allows for a greater ATP production and integrated force generation compared to control conditions. Second, group III/IV muscle afferents are critically involved in maintaining efficient skeletal muscle contraction during the latter portion of an all‐out exercise protocol. As such, the time course‐dependent nature of all‐out exercise performance with attenuated group III/IV muscle afferent feedback was the ensemble effect of alterations in total ATP production and the ATP cost of contraction. Therefore, group III/IV muscle afferents directly limit exercise performance during small muscle mass exercise, but, due to their critical role in maintaining skeletal muscle contractile efficiency, with time, the benefit of attenuating muscle afferents is negated.
Additional information
Competing interests
The authors declare no competing interests.
Author contributions
The work was conducted at the Utah Vascular Research Laboratory (UVRL) housed in the Salt Lake City Veterans Affairs Hospital, Utah. All authors contributed to data collection/analysis and manuscript preparation. All authors have read and approved the final version of this manuscript and agree to be accountable for all aspects of the work in ensuring that questions related to the accuracy or integrity of any part of the work are appropriately investigated and resolved. All persons designated as authors qualify for authorship, and all those who qualify for authorship are listed.
Funding
This study was supported by NIH Heart, Lung, and Blood Institute grants (HL‐103786, HL‐116579, HL‐091830 and K99HL125756), Veterans Affairs Rehabilitation Research and Development Merit (E6910‐R and E1697‐R), Spire (E1572‐P and E1433‐P), Senior Research Career Scientist (E9275‐L) awards, and the Flight Attendant Medical Research Institute (YFEL141011).
Biography
Ryan M. Broxterman earned his PhD in physiology at Kansas State University in 2015. He is currently a Postdoctoral Fellow, mentored by Russell S. Richardson, in the Utah Vascular Research Laboratory (UVRL) housed in the Salt Lake City VA Medical Center Geriatric Research, Education, and Clinical Center (GRECC), as well as in the Department of Internal Medicine at the University of Utah. His research focuses on the integration of vascular, metabolic and neuromuscular function in the regulation of oxygen delivery and utilization in health and disease.

Edited by: Michael Hogan & Bruno Grassi
References
- Amann M, Blain G, Proctor LT, Sebranek JJ, Pegelow DF & Dempsey JA (2011a). Implications of group III and IV muscle afferents for high‐intensity endurance exercise performance in humans. J Physiol 589, 5299–5309. [DOI] [PMC free article] [PubMed] [Google Scholar]
- Amann M & Calbet JA (2008). Convective oxygen transport and fatigue. J Appl Physiol 104, 861–870. [DOI] [PubMed] [Google Scholar]
- Amann M, Proctor LT, Sebranek JJ, Pegelow DF & Dempsey JA (2009). Opioid‐mediated muscle afferents inhibit central motor drive and limit peripheral muscle fatigue development in humans. J Physiol 587, 271–283. [DOI] [PMC free article] [PubMed] [Google Scholar]
- Amann M, Runnels S, Morgan DE, Trinity JD, Fjeldstad AS, Wray DW, Reese VR & Richardson RS (2011b). On the contribution of group III and IV muscle afferents to the circulatory response to rhythmic exercise in humans. J Physiol 589, 3855–3866. [DOI] [PMC free article] [PubMed] [Google Scholar]
- Amann M, Venturelli M, Ives SJ, McDaniel J, Layec G, Rossman MJ & Richardson RS (2013). Peripheral fatigue limits endurance exercise via a sensory feedback‐mediated reduction in spinal motoneuronal output. J Appl Physiol 115, 355–364. [DOI] [PMC free article] [PubMed] [Google Scholar]
- Bawa P & Murnaghan C (2009). Motor unit rotation in a variety of human muscles. J Neurophysiol 102, 2265–2272. [DOI] [PubMed] [Google Scholar]
- Bigland‐Ritchie BR, Dawson NJ, Johansson RS & Lippold OCJ (1986). Reflex origin for the slowing of motoneurone firing rates in fatigue of human voluntary contractions. J Physiol 379, 451–459. [DOI] [PMC free article] [PubMed] [Google Scholar]
- Blain GM, Mangum TS, Sidhu SK, Weavil JC, Hureau TJ, Jessop JE, Bledsoe AD, Richardson RS & Amann M (2016). Group III/IV muscle afferents limit the intramuscular metabolic perturbation during whole body exercise in humans. J Physiol 594, 5303–5315. [DOI] [PMC free article] [PubMed] [Google Scholar]
- Borg G ( 1998). Borg's Perceived Exertion and Pain Scales. Human Kinetics, Champaign, IL, USA. [Google Scholar]
- Broxterman RM, Ade CJ, Craig JC, Wilcox SL, Schlup SJ & Barstow TJ (2015a). Influence of blood flow occlusion on muscle oxygenation characteristics and the parameters of the power‐duration relationship. J Appl Physiol 118, 880–889. [DOI] [PubMed] [Google Scholar]
- Broxterman RM, Ade CJ, Wilcox SL, Schlup SJ, Craig JC & Barstow TJ (2014). Influence of duty cycle on the power‐duration relationship: observations and potential mechanisms. Respir Physiol Neurobiol 192, 102–111. [DOI] [PubMed] [Google Scholar]
- Broxterman RM, Craig JC, Smith JR, Wilcox SL, Jia C, Warren S & Barstow TJ (2015b). Influence of blood flow occlusion on the development of peripheral and central fatigue during small muscle mass handgrip exercise. J Physiol 593, 4043–4054. [DOI] [PMC free article] [PubMed] [Google Scholar]
- Broxterman RM, Layec G, Hureau TJ, Amann M & Richardson RS (2017a). Skeletal muscle bioenergetics during all‐out exercise: mechanistic insight into the oxygen uptake slow component and neuromuscular fatigue. J Appl Physiol 122, 1208–1217. [DOI] [PMC free article] [PubMed] [Google Scholar]
- Broxterman RM, Layec G, Hureau TJ, Morgan DE, Bledsoe AD, Jessop JE, Amann M & Richardson RS (2017b). Bioenergetics and ATP synthesis during exercise: role of group III/IV muscle afferents. Med Sci Sports Exerc 49, 2404–2413. [DOI] [PMC free article] [PubMed] [Google Scholar]
- Burnley M (2009). Estimation of critical torque using intermittent isometric maximal voluntary contractions of the quadriceps in humans. J Appl Physiol 106, 975–983. [DOI] [PubMed] [Google Scholar]
- Burnley M, Vanhatalo A, Fulford J & Jones AM (2010). Similar metabolic perturbations during all‐out and constant force exhaustive exercise in humans: a 31P magnetic resonance spectroscopy study. Exp Physiol 95, 798–807. [DOI] [PubMed] [Google Scholar]
- Chidnok W, Fulford J, Bailey SJ, DiMenna FJ, Skiba PF, Vanhatalo A & Jones AM (2013). Muscle metabolic determinants of exercise tolerance following exhaustion: relationship to the “critical power”. J Appl Physiol 115, 243–250. [DOI] [PubMed] [Google Scholar]
- Chilibeck PD, McCreary CR, Marsh GD, Paterson DH, Noble EG, Taylor AW & Thompson RT (1998). Evaluation of muscle oxidative potential by 31P‐MRS during incremental exercise in old and young humans. Eur J Appl Physiol Occup Physiol 78, 460–465. [DOI] [PubMed] [Google Scholar]
- Conley KE, Blei ML, Richards TL, Kushmerick MJ & Jubrias SA (1997). Activation of glycolysis in human muscle in vivo. Am J Physiol Cell Physiol 42, C306–C315. [DOI] [PubMed] [Google Scholar]
- Conley KE, Kushmerick MJ & Jubrias SA (1998). Glycolysis is independent of oxygenation state in stimulated human skeletal muscle in vivo . J Physiol 511, 935–945. [DOI] [PMC free article] [PubMed] [Google Scholar]
- Copp SW, Hirai DM, Musch TI & Poole DC (2010). Critical speed in the rat: implications for hindlimb muscle blood flow distribution and fibre recruitment. J Physiol 588, 5077–5087. [DOI] [PMC free article] [PubMed] [Google Scholar]
- Dekerle J, Mucci P & Carter H (2012). Influence of moderate hypoxia on tolerance to high‐intensity exercise. Eur J Appl Physiol 112, 327–335. [DOI] [PubMed] [Google Scholar]
- Enoka RM & Duchateau J (2008). Muscle fatigue: what, why and how it influences muscle function. J Physiol 586, 11–23. [DOI] [PMC free article] [PubMed] [Google Scholar]
- Garland SJ & McComas AJ (1990). Reflex inhibition of human soleus muscle during fatigue. J Physiol 429, 17–27. [DOI] [PMC free article] [PubMed] [Google Scholar]
- Golding EM, Teague WE & Dobson GP (1995). Adjustment of Kʹ to varying pH and pMg for the creatine kinase, adenylate kinase and ATP hydrolysis equilibria permitting quantitative bioenergetic assessment. J Exp Biol 198, 1775–1782. [DOI] [PubMed] [Google Scholar]
- Grant GJ, Susser L, Cascio M, Moses M & Zakowski MI (1996). Hemodynamic effects of intrathecal fentanyl in nonlaboring term parturients. J Clin Anesth 8, 99–103. [DOI] [PubMed] [Google Scholar]
- Harris RC, Hultman E & Nordesjo LO (1974). Glycogen, glycolytic intermediates and high‐energy phosphates determined in biopsy samples of musculus quadriceps femoris of man at rest. Methods and variance of values. Scand J Clin Lab Invest 33, 109–120. [PubMed] [Google Scholar]
- Haseler LJ, Hogan MC & Richardson RS (1999). Skeletal muscle phosphocreative recovery in exercise‐trained humans is dependent on O2 availability. J Appl Physiol 86, 2013–2018. [DOI] [PubMed] [Google Scholar]
- Haseler LJ, Lin A, Hoff J & Richardson RS (2007). Oxygen availability and PCr recovery rate in untrained human calf muscle: evidence of metabolic limitation in normoxia. Am J Physiol Regul Integr Comp Physiol 293, R2046–R2051. [DOI] [PubMed] [Google Scholar]
- Hayward L, Wesselmann U & Rymer WZ (1991). Effects of muscle fatigue on mechanically sensitive afferents of slow conduction velocity in the cat triceps surae. J Neurophysiol 65, 360–370. [DOI] [PubMed] [Google Scholar]
- Hill AV (1925). The physiological basis of athletic records. Nature 116, 544–548. [Google Scholar]
- Hill AV & Lupton H (1923). Muscular exercise, lactic acid, and the supply and utilization of oxygen. Q J Med 16, 135–171. [Google Scholar]
- Hilty L, Lutz K, Maurer K, Rodenkirch T, Spengler CM, Boutellier U, Jäncke L & Amann M (2011). Spinal opiod receptor‐sensitive muscle afferents contribute to the fatigue‐induced increase in intracortical inhibition in healthy humans. Exp Physiol 96, 505–517. [DOI] [PubMed] [Google Scholar]
- Hochachka PW & Mommsen TP (1983). Protons and anaerobiosis. Science 219, 1391–1397. [DOI] [PubMed] [Google Scholar]
- Hogan MC, Richardson RS & Haseler LJ (1999). Human muscle performance and PCr hydrolysis with varied inspired oxygen fractions: a 31P‐MRS study. J Appl Physiol 86, 1367–1373. [DOI] [PubMed] [Google Scholar]
- Hureau TJ, Broxterman RM & Weavil JC (2016). The mechanistic basis of the power‐time relationship: potential role of the group III/IV muscle afferents. J Physiol 594, 7165–7166. [DOI] [PMC free article] [PubMed] [Google Scholar]
- Jeneson JA, Westerhoff HV, Brown TR, Van Echteld CJA & Berger R (1995). Quasi‐linear relationship between Gibbs free energy of ATP hydrolysis and power output in human forearm muscle. Am J Physiol Cell Physiol 37, C1474–C1484. [DOI] [PubMed] [Google Scholar]
- Jeneson JA, Wiseman RW, Westerhoff HV & Kushmerick MJ (1996). The signal transduction function for oxidative phosphorylation is at least second order in ADP. J Biol Chem 271, 27995–27998. [DOI] [PubMed] [Google Scholar]
- Jones AM, Wilkerson DP, DiMenna FJ, Fulford J & Poole DC (2008). Muscle metabolic responses to exercise above and below the “critical power” assessed using 31P‐MRS. Am J Physiol Regul Integr Comp Physiol 294, 585–593. [DOI] [PubMed] [Google Scholar]
- Kemp GJ & Radda GK (1994). Quantitative interpretation of bioenergetic data from 31P and 1H magnetic resonance spectroscopic studies of skeletal muscle: an analytical review. Magn Reson Q 10, 43–63. [PubMed] [Google Scholar]
- Kemp GJ, Roussel M, Bendahan D, Le Fur Y & Cozzone PJ (2001). Interrelations of ATP synthesis and proton handling in ischaemically exercising human forearm muscle studied by 31P magnetic resonance spectroscopy. J Physiol 535, 901–928. [DOI] [PMC free article] [PubMed] [Google Scholar]
- Kemp GJ, Taylor DJ, Styles P & Radda GK (1993). The production, buffering and efflux of protons in human skeletal muscle during exercise and recovery. NMR Biomed 6, 73–83. [DOI] [PubMed] [Google Scholar]
- Kemp GJ, Thompson CH, Taylor DJ & Radda GK (1997). Proton efflux in human skeletal muscle during recovery from exercise. Eur J Appl Physiol Occupat Physiol 76, 462–471. [DOI] [PubMed] [Google Scholar]
- Kennedy DS, McNeil CJ, Gandevia SC & Taylor JL (2013). Firing of antagonist small‐diameter muscle afferents reduces voluntary activation and torque of elbow flexors. J Physiol 591, 3591–3604. [DOI] [PMC free article] [PubMed] [Google Scholar]
- Kushmerick MJ ( 1997). Multiple equilibria of cations with metabolites in muscle bioenergetics. Am J Physiol Cell Physiol 41, C1739–C1747. [DOI] [PubMed] [Google Scholar]
- Lanza IR, Wigmore DM, Befroy DE & Kent‐Braun JA (2006). In vivo ATP production during free‐flow and ischaemic muscle contractions in humans. J Physiol 577, 353–367. [DOI] [PMC free article] [PubMed] [Google Scholar]
- Layec G, Bringard A, Vilmen C, Micallef J‐P, Le Fur Y, Perrey S, Cozzone PJ & Bendahan D (2008). Accurate work‐rate measurements during in vivo MRS studies of exercising human quadriceps. MAGMA 21, 227–235. [DOI] [PubMed] [Google Scholar]
- Layec G, Haseler LJ, Trinity JD, Hart CR, Liu X, Le Fur Y, Jeong E‐K & Richardson RS (2013). Mitochondrial function and increased convective O2 transport: implications for the assessment of mitochondrial respiration in vivo. J Appl Physiol 115, 803–811. [DOI] [PMC free article] [PubMed] [Google Scholar]
- Le Fur Y, Nicoli F, Guye M, Confort‐Gouny S, Cozzone PJ & Kober F (2010). Grid‐free interactive and automated data processing for MR chemical shift imaging data. MAGMA 23, 23–30. [DOI] [PubMed] [Google Scholar]
- Lind AR & Williams CA (1979). The control of blood flow through human forearm muscles following brief isometric contractions. J Physiol 288, 526–547. [PMC free article] [PubMed] [Google Scholar]
- Marsh GD, Paterson DH, Thompson RT & Driedger AA (1991). Coincident thresholds in intracellular phosphorylation potential and pH during progressive exercise. J Appl Physiol 71, 1076–1081. [DOI] [PubMed] [Google Scholar]
- Martin PG, Weerakkody N, Gandevia SC & Taylor JL (2008). Group III and IV muscle afferents differentially affect the motor cortex and motoneurones in humans. J Physiol 586, 1277–1289. [DOI] [PMC free article] [PubMed] [Google Scholar]
- McCartney N, Heigenhauser GJF & Jones NL (1983). Power output and fatigue of human muscle in maximal cycling exercise. J Appl Physiol Respir Environ Exerc Physiol 55, 218–224. [DOI] [PubMed] [Google Scholar]
- Monod H & Scherrer J (1965). The work capacity of a synergic muscular group. Ergonomics 8, 329–338. [Google Scholar]
- Moritani T, Nagata A, DeVries HA & Muro M (1981). Critical power as a measure of physical work capacity and anaerobic threshold. Ergonomics 24, 339–350. [DOI] [PubMed] [Google Scholar]
- Poole DC, Ward SA, Gardner GW & Whipp BJ (1988). Metabolic and respiratory profile of the upper limit for prolonged exercise in man. Ergonomics 31, 1265–1279. [DOI] [PubMed] [Google Scholar]
- Rossi A, Mazzocchio R & Decchi B (2003). Effect of chemically activated fine muscle afferents on spinal recurrent inhibition in humans. Clin Neurophysiol 114, 279–287. [DOI] [PubMed] [Google Scholar]
- Sargeant AJ, Hoinville E & Young A (1981). Maximum leg force and power output during short‐term dynamic exercise. J Appl Physiol Respir Environ Exerc Physiol 51, 1175–1182. [DOI] [PubMed] [Google Scholar]
- Sidhu SK, Weavil JC, Mangum TS, Jessop JE, Richardson RS, Morgan DE & Amann M (2017). Group III/IV locomotor muscle afferents alter motor cortical and corticospinal excitability and promote central fatigue during cycling exercise. Clin Neurophysiol 128, 44–55. [DOI] [PMC free article] [PubMed] [Google Scholar]
- Sidhu SK, Weavil JC, Venturelli M, Garten RS, Rossman MJ, Richardson RS, Gmelch BS, Morgan DE & Amann M (2014). Spinal μ‐opioid receptor‐sensitive lower limb muscle afferents determine corticospinal responsiveness and promote central fatigue in upper limb muscle. J Physiol 592, 5011–5024. [DOI] [PMC free article] [PubMed] [Google Scholar]
- Sidhu SK, Weavil JC, Venturelli M, Rossman MJ, Gmelch BS, Bledsoe AD, Richardson RS & Amann M (2015). Aging alters muscle reflex control of autonomic cardiovascular responses to rhythmic contractions in humans. Am J Physiol Heart Circ Physiol 309, H1479–H1489. [DOI] [PMC free article] [PubMed] [Google Scholar]
- Standl TG, Horn E, Luckmann M, Burmeister M, Wilhelm S & Schulte am Esch J (2001). Subarachnoid sufentanil for early postoperative pain management in orthopedic patients: a placebo‐controlled, double‐blind study using spinal microcatheters. Anesthesiology 94, 230–238. [DOI] [PubMed] [Google Scholar]
- Trenell MI, Sue CM, Kemp GJ, Sachinwalla T & Thompson CH (2006). Aerobic exercise and muscle metabolism in patients with mitochondrial myopathy. Muscle Nerve 33, 524–531. [DOI] [PubMed] [Google Scholar]
- Vanhamme L, van den Boogart A & Van Huffel S (1997). Improved method for accurate and efficient quantification of MRS data with use of prior knowledge. J Magn Reson 129, 35–43. [DOI] [PubMed] [Google Scholar]
- Vanhatalo A, Black MI, DiMenna FJ, Blackwell JR, Schmidt JF, Thompson C, Wylie LJ, Mohr M, Bangsbo J, Krustrup P & Jones AM (2016). The mechanistic bases of the power‐time relationship: muscle metabolic responses and relationships to muscle fibre type. J Physiol 594, 4407–4423. [DOI] [PMC free article] [PubMed] [Google Scholar]
- Vanhatalo A, Fulford J, DiMenna FJ & Jones AM (2010). Influence of hyperoxia on muscle metabolic responses and the power‐duration work relationship during severe‐intensity exercise in humans: a 31P magnetic resonance spectroscopy study. Exp Physiol 95, 528–540. [DOI] [PubMed] [Google Scholar]
- Vanhatalo A, Poole DC, DiMenna FJ, Bailey SJ & Jones AM (2011). Muscle fiber recruitment and the slow component of O2 uptake: constant work rate vs. all‐out sprint exercise. Am J Physiol Regul Integr Comp Physiol 300, R700–R707. [DOI] [PubMed] [Google Scholar]
- Wigmore DM, Damon BM, Pober DM & Kent‐Braun JA (2004). MRI measures of perfusion‐related changes in human skeletal muscle during progressive contractions. J Appl Physiol 97, 2385–2394. [DOI] [PubMed] [Google Scholar]
- Wigmore DM, Propert K & Kent‐Braun JA (2006). Blood flow does not limit skeletal muscle force production during incremental isometric contractions. Eur J Appl Physiol 96, 370–378. [DOI] [PubMed] [Google Scholar]
- Wilson LB & Hand GA (1997). The pressor reflex evoked by static contraction: neurochemistry at the site of the first synapse. Brain Res Brain Res Rev 23, 196–209. [DOI] [PubMed] [Google Scholar]