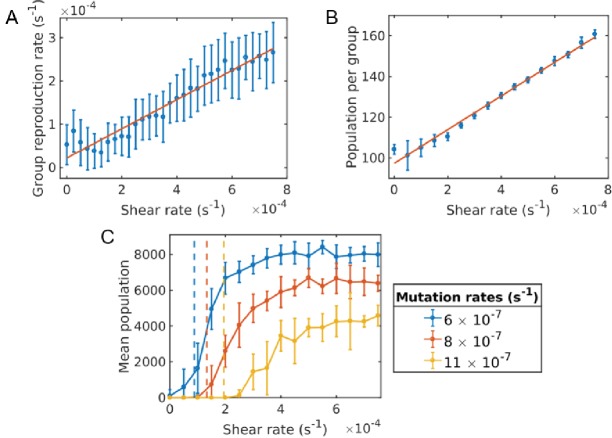
Figure 4. Critical shear for cooperativity for cheater-altruist system.
(A) Group fragmentation rate versus shear rate. We see that the group fragmentation rate increases linearly with the shear rate. (B) Group population versus shear rate. As the shear distorts and elongates the group, the average group population also increases linearly with shear. (C) Average population versus shear rate for different mutation rates. Simulations were run for a time of s and averaged over 10 runs for each shear rate and mutation rate. Error bars correspond to one standard deviation. Here, a mutation corresponds to a full cheater, with no public good secretion. The population goes extinct under larger mutation rates unless the shear rate is above the critical value. The critical shear values for different mutation rates are roughly obtained by 10 and are shown by the vertical dashed lines corresponding to curves of the same color. The Matlab code and data for this figure is provided in Figure 4—source data 1.

