Abstract
In order to identify and control the menace of destructive pests via microscopic image-based identification state-of-the art deep learning architecture is demonstrated on the parasitic worm, the soybean cyst nematode (SCN), Heterodera glycines. Soybean yield loss is negatively correlated with the density of SCN eggs that are present in the soil. While there has been progress in automating extraction of egg-filled cysts and eggs from soil samples counting SCN eggs obtained from soil samples using computer vision techniques has proven to be an extremely difficult challenge. Here we show that a deep learning architecture developed for rare object identification in clutter-filled images can identify and count the SCN eggs. The architecture is trained with expert-labeled data to effectively build a machine learning model for quantifying SCN eggs via microscopic image analysis. We show dramatic improvements in the quantification time of eggs while maintaining human-level accuracy and avoiding inter-rater and intra-rater variabilities. The nematode eggs are correctly identified even in complex, debris-filled images that are often difficult for experts to identify quickly. Our results illustrate the remarkable promise of applying deep learning approaches to phenotyping for pest assessment and management.
Introduction
Disease and pathogen detection processes in plants are classified into direct and indirect methods1. Direct detection techniques, such as molecular markers using polymerase chain reactions (PCRs) and deoxyribonucleic acid (DNA) arrays, have been widely studied and analyzed. Lately, indirect disease detection techniques, via imaging for instance, have dramatically improved, and there is a significant interest in developing techniques for fast and automated analysis of such images2. In this context, object classification and detection in images become critical2–5. In certain cases, objects to be detected and enumerated by imaging techniques are much fewer or less conspicuous in the presence of extraneous objects6. Such cases have been termed rare object detection problems, with specific examples including pathogen detection (e.g., sexual and asexual spores)7, plant part detection8 and identification of foreign or unwanted objects from samples with applications in health, food and plant sciences and industries1. Our current study of identifying and quantifying soybean cyst nematode (SCN) eggs recovered from the soil using microscopic images is one such scenario where we demonstrate the effectiveness of our proposed deep learning paradigm in pathogen assessment.
The SCN is an obligate parasitic worm that develops from eggs to adults in as little as 24 days9,10. Feeding on soybean roots by the nematodes can inhibit the growth of the plants, cause yellowish discoloration of the leaves and increase the plants’ risk to more severe infections of diseases such as brown stem rot and sudden death syndrome11. SCN damage in the US alone is estimated to account, on an average, for a yield loss of about 3.5 million metric ton (one-third of the total loss)12,13, equivalent to >$1 billion per year in value14. The nematode had been managed successfully for decades by growing non-host crops, such as corn, in alternating years with soybean varieties that were bred to be resistant to the nematode. But virtually all of the resistant soybean varieties possessed the same set of resistance genes and, consequently, SCN populations have developed increased ability to reproduce on resistant soybean varieties15, leading to yield loss of the resistant varieties. Because of the loss of effectiveness of resistance, there is renewed need to monitor SCN population densities by collecting soil samples and quantifying the numbers of SCN eggs present in the soil.
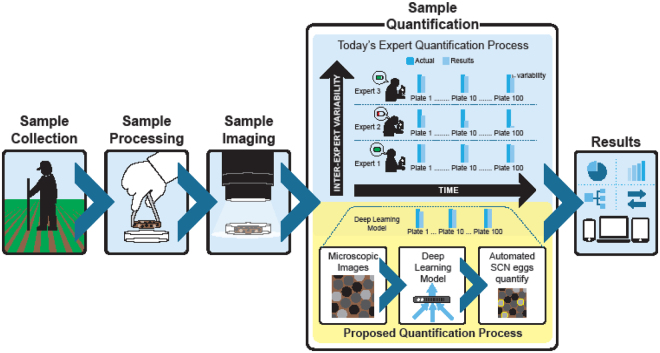
After collection of soil samples from the field, SCN cysts (dead SCN females containing eggs) and debris are separated from other soil matter in processes known as elutriation11 or wet-sieving and decanting16. The resulting suspension of SCN cysts and debris is crushed by some means, commonly using a rubber stopper on the surface of a sieve17, then the eggs are recovered on a sieve, suspended in water with acid fuchsin and heated to color the eggs a pink-magenta color18 (see Supplementary Fig. 1). A sample of the stained egg suspension (typically 1 ml) is taken and placed on a nematode-counting slide that facilitates manual counting by trained technicians19 using an optical microscope (see illustration in Supplementary Fig. 3). While all other stages of the sampling and extraction process have undergone some degree of mechanization20,21, and can now be done in a fairly automated fashion, counting the number of SCN eggs has not yet been successfully automated, in spite of significant efforts using image processing strategies. Prior to 2015, most image-processing-based approaches have only been marginally successful11, exhibiting highly inconsistent performance and requiring frequent tuning, thus, limiting utility and ensuring that manual, human, visual identification and counting remains the gold standard. The difficulties in automation are primarily due to the resemblance of eggs with pervasive inorganic and organic debris, as well as the variability in coloration and occlusion of the eggs that occurs with eggs extracted from different soil types. The accurate counting of SCN eggs is further exacerbated by the occurrence of relatively few eggs per plate or image, hence ‘rare object detection’ problem (see examples in Supplementary Fig. 1 to understand the complexity). Even manual quantification of the SCN eggs on the frames require sufficient training because the debris can easily be confused with the SCN eggs and vice versa. Furthermore, trained technicians may have different levels of training and experience and get fatigued during this manual search process leading to both intra-rater and inter-rater variabilities (Fig. 1). Therefore, accurately recognizing and counting SCN eggs is a serious bottleneck to high-throughput assessment of SCN population densities as manual, human, visual counting is both time consuming, as well as mistake-prone.
Figure 1.
Approach overview showing the workflow that leads to the automated quantification process as an alternative to the human expert quantification which suffers from intra-rater and inter-rater variabilities.
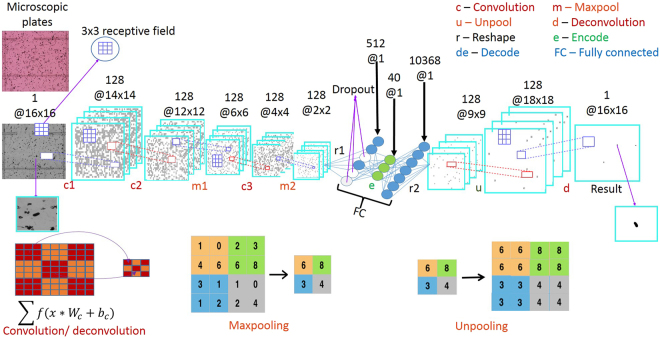
Deep learning approaches have recently had a transformative impact in image analytics, specifically in automatically learning complex patterns of interest for applications such as object recognition and scene understanding5, image de-noising and enhancement22, detection and labeling23. Within the deep learning paradigm, we design a novel end-to-end Convolutional Selective Autoencoder (CSAE)24 that possesses remarkable detection speed, consistency and accuracy in identifying SCN eggs across a wide variety of solution coloration, soil types and debris fields. The architecture was developed for this rare-object detection class of problems in such a manner that makes it robust to various data quality types without significant degradation in performance. A CSAE (illustrated in Fig. 2) has two main parts – the first part is called an encoder that learns to capture salient features from the input image in a layer-wise hierarchy while rejecting noise and other spurious disturbances, such that the patterns of interest in the input image can be faithfully reconstructed by the second part, called the decoder. The ‘selectivity’ aspect comes from the training procedure where the convolutional network model is trained in a way that it learns only to reconstruct an ‘egg’ pattern and mask/reject every other pattern in the input image. This supervised learning scheme uses a small set of microscopic images carefully annotated by experts to mark/highlight all SCN eggs to the best of their judgement.
Figure 2.
Deep Convolutional Selective Autoencoder architecture for rare object detection from images with application to SCN egg detection in cluttered microscopic images.
We train the CSAE with labeled patches (image segments smaller than the entire image frame) from 644 microscopic image frames obtained from soil samples collected in fall 2015 and processed to extract the SCN eggs. Upon training, the model scans through the test images, patch by patch, and then identifies if each patch contains an SCN egg. Note that the detection of SCN egg(s) in each patch is affected by the presence of neighboring objects in the patch. This is particularly important for detection in the ‘high-cluttered’ images. We therefore fuse information from multiple overlapping local patches to provide a high level of confidence in estimating the existence of an SCN egg in a particular patch. While a high degree of overlap has the potential to improve the detection performance, it does require the processing of a higher number of patches. Therefore, the degree of overlap among the patches is determined to achieve an optimal trade-off between the detection accuracy and the computational complexity (i.e., detection time). Details of the data acquisition, labeling of the data, training of the model, and fusion of patch-level model inferences are given in the Methods section.
Results and Discussion
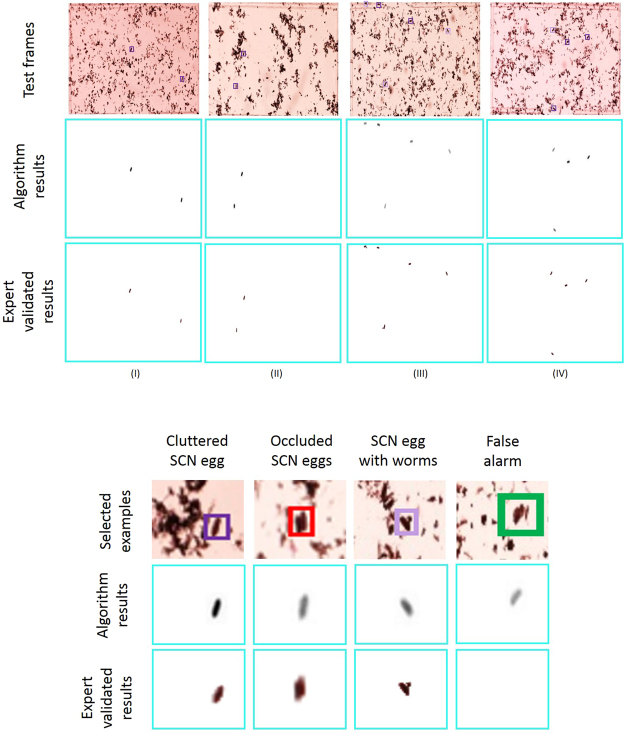
Testing data sets were collected in spring 2016 from two different SCN-infested fields with different soil characteristics. The first farm, ‘A’, had 24 test sets (each test set consisting of 50 microscopic image frames) that were ‘less-cluttered’, while the second farm, ‘B’, had 24 test sets (each test set consisting of 50 microscopic image frames) that were ‘high-cluttered’. The sets which have more eggs and debris lumped together in different regions of the microscopic images are termed ‘high-cluttered’, while the ‘less-cluttered’ group contains sets with mostly distinct SCN eggs and debris (For quantified definition of these image types, see Supplementary Section - Dataset and Supplementary Fig. 2). Figure 3 illustrates the robustness of deep learning model in identifying SCN eggs under such widely varying conditions. Since the sizes of the objects of interest (i.e., eggs with area of roughly 5000 μm2) and the debris are much smaller compared to the entire image frames, we demonstrate the efficacy of the CSAE framework by zooming into a few representative areas of certain defined frames. The highlighted examples in Fig. 3 illustrates the model’s robustness to some extreme cases. The first example in Fig. 3(a) shows an egg in a significantly cluttered background. The CSAE model can reliably reconstruct the egg with high confidence (evidenced by the high pixel intensity value of the reconstructed egg object) while masking the other objects. The second example in Fig. 3(b) shows the ability of the machine learning model to detect and reconstruct an SCN egg object, where it is occluded in the input frame. In the third representative example shown in Fig. 3(c), an interesting phenomenon is shown that is observed in some cases where a worm is coming out of the egg. The CSAE model is able to reconstruct the egg in this scenario. Lastly, we show one of the very few false alarms obtained from the test frames in Fig. 3(d). In this case, while the object detected as an egg does have significant similarities in shape and size with an actual egg, the model associates a low pixel intensity signifying the low confidence it has in making this prediction. This suggests that CSAE identified objects can be automatically triage and selectively remove to further improve object recognition (see Supplementary material). Most interestingly, we had a few instances where the CSAE purportedly had false alarms, which were later confirmed to be actual eggs missed by the human expert.
Figure 3.
Sample detection results with images from diverse environment and different background staining for a: (I) set B1 example, (II) set B2 example, (III) set B13 example, and (IV) set B9 example; the dark purple boxes indicate highly confident detection, the light purple box indicates the low confidence detections, the red box indicates occluded eggs and the green box is a false alarm, while the low intensity in reconstruction suggests low detection confidence of the model.
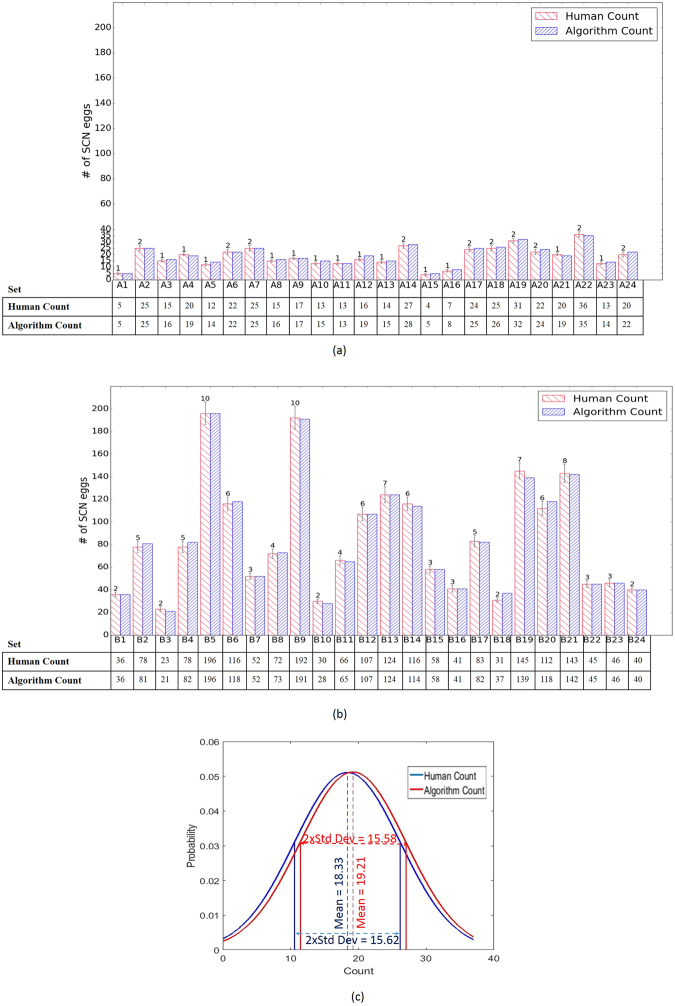
We provide the statistical summary of CSAE results in Fig. 4. First, we compare the machine counts on both ‘less-cluttered’ and ‘high-cluttered’ testing sets with human counts of SCN eggs. Note, each set count (human or machine) has 50 image frames. Error bars (+/−5%) are also included around the human counts for evaluating the machine counts. Egg counting performance is observed to be comparable with human experts for both the ‘less-cluttered’ and the ‘high-cluttered’ cases. While the ‘less-cluttered’ group in Fig. 4(a) have ≈92% (22 out of 24) of sets where detection accuracy is ≥95%, the ‘high-cluttered’ group in Fig. 4(b) have ≈96% (23 out of 24) of sets greater than or equal to 95% (More result frames are included in the Supplementary material). The ‘high-cluttered’ group contains more eggs alongside the debris and fewer misses hurt the detection less compared to the ‘less-cluttered’ group. We note however, that the ‘high-cluttered’ frames need a higher degree of overlap of patches (i.e., more computational time) to achieve the reported detection performance and the ‘less-cluttered’ frames have slightly less sensitivity to changes in the model learning hyper-parameters. However, more computational time issue is a mute argument with the availability of more powerful computers. A comparison of the distributions of the counts by human expert as well as machine is provided in Fig. 4(c). The distributions of both counts are seen to be close, judging by the mean values and the deviations around them. While the bar plots show overall egg count comparison for different test sets, we present detailed performance metrics in Table 1. The reported metrics are slight variants of the classical metrics such as false alarm and missed detection because it is infeasible to count the number of all objects in any frame as is required for the classical metric computation. Moreover, the few SCN eggs in each frame are already very laborious and time-consuming to count, therefore the debris, which are many more in number in the frames, will be rather unrealistic to count. The aggregated performance metrics show that our framework has significantly high degree of accuracy and robustness to noise and variability of the microscopic images. Furthermore, the imaging defects also include non-standard imaging processes (different image background lighting and orientations during the microscopic imaging), inconsistencies in intensity of colorization of eggs with the acid fuchsin stain, occlusion problems such as a non-egg blob on an egg, overlapping of SCN eggs and a worm (hatching juvenile) coming out of an egg.
Figure 4.
Statistics of transfer learning for spring 2016 image frames (total of 2400) testing results with model trained on fall 2015 (total of 644) frames for, (a) ‘less-cluttered’ group containing 24 sets labeled {A1, …, A24} of 50 frames, (b) ‘high-cluttered’ group containing 24 sets labeled {B1, …, B24} of 50 frames. The error bars are derived (as +/−5%) around the human counts for each of the image sets and (c) the distributions of the machine and human counts for the ‘high-cluttered’ and ‘less-cluttered’ results.
Table 1.
Performance metrics of algorithm on spring 2016 test sets, which are the ‘less-cluttered’ 24 sets labeled {A1, …, A24} having 50 frames, ‘high-cluttered’ group containing 24 sets labeled {B1, …, B24} of 50 frames and the aggregate performance of all the total 2400 testing images.
| Adapted metric | Formulae | ‘Less-cluttered’ group | ‘High-cluttered’ group | Aggregate |
|---|---|---|---|---|
| Average detection accuracy | ||||
| Average alarm-to-egg ratio | ||||
| Average miss-to-egg ratio | ||||
| Average precision | ||||
| F1- Score | 0.943 | 0.949 | 0.944 |
Error margin is found by taking 5% (i.e., the upper bound of the error bar) of the total human count for all image sets in each category.
Rapidly evolving algorithms in machine learning can lead to significant breakthroughs in complex plant phenotyping problems that have stubbornly resisted automation for decades25. Such approaches result in extremely consistent results that reliably relieve the expert of the monotony of dull repetitive tasks, while lowering quantification time and overall detection cost per sample.
In conclusion, a robust technique for identifying and counting rare objects in images have been proposed. The end-to-end convolutional selective autoencoder approach is trained for the current problem of searching for SCN eggs on microscopic images. A highly focused selectivity criterion is embedded in the training samples to aid CSAE discriminate the eggs from the highly similar debris. The current results show the robustness of the model, trained by the architecture, to identify the eggs despite the non-standardized lighting conditions, fuchsin coloring and clutter-level of the testing and training images. In general, CSAE reduces the cost of human counting as well as fatigue associated with it and therefore, can replace the manual practice of SCN egg counting. From a machine-driven SCN egg counting perspective, the current state-of-the-art, traditional computer vision technique using hand-crafted features11, claims to achieve a count within 10% of the expert counts over only few frames. In contrast, our CSAE model achieves an accuracy of around 96% and an overall F1-score of 0.944 on 2400 frames. CSAE is able to count 1440 frames/day/core (1 frame/minute) in very ‘high-cluttered’ frames, potentially reducing the number of days required for 108,000 frames (the number of frames considered in11) to only 70 days as opposed to 462 days as reported in11 using only a single core standard computer. However, in ‘less-cluttered’ frames the counting speed can increase dramatically to 242 frames/minute as we do not require significantly overlapping test patches from frames. With this speed, all 108,000 frames can be counted in <1 day. CSAE is also able to reduce cost of human counting as well as reduce fatigue associated with it. Importantly also, the method section will show how we reduce the cost of the extraction step by discarding the fuschin staining condition as we train the algorithm purely on grayscale images. Finally, we anticipate a proliferation of such ‘learning enhanced automation’ approaches that will have a transformative impact on agriculture, life and food sciences.
Some of the research directions that are currently being pursued are: (1) improving the object detection algorithm to handle occlusion of SCN eggs by debris as well as overlapping of multiple SCN eggs, (2) developing an easy interface such as a smart phone “app” for pathologists to easily estimate the SCN eggs on microscopic plates.
Methods
Soil sample and imaging
Dataset generation begins with collection of soil samples from SCN-infested fields by arbitrary placement of 25.4 mm diameter probes in a zigzag11 intervals on several farms in the state of Iowa of the United States. Soil samples were suspended in water, then sieved to separate root fragments and larger sized debris from the dead SCN females (called cysts) that are full of eggs16. The cysts recovered from the soil are physically crushed to break the cysts in order to release the SCN eggs held within17. Extracted SCN eggs and associated debris are placed in beakers with water and a few drops of acid fuchsin stain, heated to boiling, and then cooled18 when a 1 cm3 sample is placed in a nematode-counting slide. Images of the samples were taken under the microscope. To ensure that a wide variety of samples were used, two sets of soil samples collected from two fields each time were processed: the first was during fall 2015 and then the second, in the spring of 2016.
SCN marking and curation
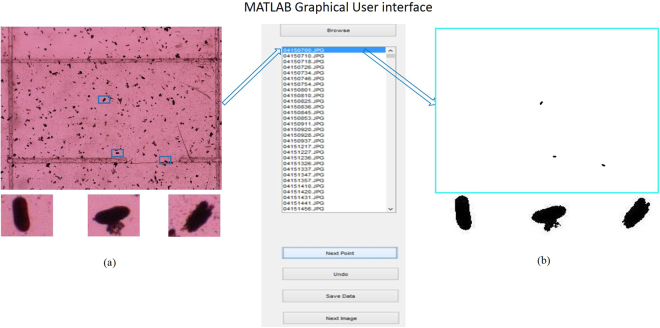
An easy-to-use marking tool was created to enable trained nematologists to label the eggs in the images. The tool was deployed on a touch-screen-enabled device as an app so that the location of the eggs can be marked. The location of every SCN egg is marked in each image and the pixel locations of each SCN egg stored into a database. The workflow of the mobile app, in its MATLAB based graphical user interface (GUI) development environment, is shown in Fig. 5. In the GUI, SCN eggs are the foreground objects, with the benefit of nematologists provided labels illustrated in Fig. 5(a), while all other non-egg objects are masked. The app shows in a sequential way, the set of microscopic frames opened while the highlighted one represents the annotated one.
Figure 5.
MATLAB GUI development of the mobile app that annotating the highlighted image of (a) based on expert information and producing the result in (b).
Each image in the dataset was labeled, i.e., the location of every SCN egg in each image was precisely marked by two nematologists working independently. The use of two independent nematologists enable the quantification of intra- and inter-rater variability resulting from the deep learning approach. This process took more than two weeks of effort by each trained nematologist.
Although the app does a decent job of separating the foreground from the background as desired, it does not learn any model to automate further detection. The operating principle of the app however provided some ideas for learning to automate the detection and counting process. We have 644 annotated images and corresponding raw images constituted the training images. The images exhibited a wide diversity of soil samples, coloration intensities and SCN number densities. Additionally, spring 2016 images served as testing dataset. After testing was done, the images and results were returned to experts for validating the algorithm’s performance.
Data preprocessing
The stained training images are converted back to gray-scale images (eliminating the requirement for fuchsin staining in the extraction stage) from all the training images. The pixels intensities of images, X and labels, Y pair, denoted by {(X1, Y1), …, (XI, YI)} are normalized from [0, …, 255] → [0.0, …, 1.0]. This important pre-processing step is included to reduce the effects of random disturbances other than debris that may not be averagely uniform in either the test or training examples.
Network training
The most intensive part of the analysis architecture was the training stage. The main idea in network training is to learn salient hierarchical features that are suitable for characterizing the SCNs26–28. Given I examples of M × N-dimension training images and labels that yield patches of sizes, m × n each, were randomly extracted from each of normalized training images XiMN and at corresponding positions in the labels, YiMN. The objects in the training patches are pose-centered in the selectivity function that is described later. At each convolution and deconvolution, a chosen (c × c) -size filter is convolved with a z0 –dimensional chosen mini-batches of stacked patches belonging to the training images. z1 –dimensional feature maps are derived with a rectified linear unit, ReLU2 activation, C, on the convolution that enforces local correlation. In the process, joint weights, Wcc and biases, bc are expressed as,
| 1 |
where, is the algorithm’s estimate, * is a convolution operator, and j is the number of mini-batches present in the training examples. After some convolution layers, the feature maps are maxpooled29 to enhance invariance property of the convolved maps. These layers are alternated to produce the depth of the convolutional network, sometimes interlacing random unit dropout30 to control over fitting. This is especially useful to dropout units in the fully connected layer to reduce the number of over-fitted parameters.
The fully connected or bottleneck layers is the feature embedding layer. Here, the most important units explaining the output are encoded and decoded for each chosen mini-batch as,
| 2 |
| 3 |
where represents the vectorized inputs, and are the encoded and decoded outputs respectively, E and D are encoder and decoder functions which are also ReLUs. The set: {W, b} are weights and biases for the subscripted functions.
An unpooling31 layer is added so that local neighbor’s features maps are again zoomed out by widening and stretching in a symmetric manner around the edge pixel based on the unpool. The output of the unpool layer is passed to a final deconvolution layer. The layer is similar to the convolution layer, and it helps to finally enforce local neighbors of the most effective feature mapping to the mini-batch label estimates. The estimates are then compared with the actual available training labels. Training for such comparison of the estimates and the labels is done in this case by optimizing an objective function formed by getting the error between the output estimate and the ground truth label of each local neighborhood. The optimization technique that is found most effective is based on the Nesterov momentum-based stochastic gradient descent method. The error in each case is back propagated to adjust the model parameters {W, b} in all the parameterize-able layers for a number of iteration called epochs. Such error plots are usually monitored and are a qualitative measure of the trainability of the algorithms. The model training was performed by reducing each labeled image into a set of non-overlapping patches with each patch either containing a single egg or no eggs. A total of labeled 1240360 image patches of (16 × 16) dimensions derived from images (M × N) = (480 × 640) that were collected in fall 2015 were used to train algorithm. A detailed breakdown of the total labeled image patches and their constituents is available (see Supplementary Table 1 for breakdown). The training architecture in Fig. 6 consists of convolution, maxpooling, reshape, fully connected, unpooling and deconvolution layers that are arranged in a hierarchical end-to-end manner. Unpooling and deconvolution layers facilitates architecture’s object recognition ability and confers the advantage of several more abstraction - layers32.
Figure 6.
Convolutional selective autoencoder training architecture with a key describing the abbreviations in the architecture and image transformations implemented by the named core layers of the convolutional autoencoder.
The architecture is an autoencoder31, because it has both the encoder and the decoder section. A review of the building blocks of such architectures can be found in literature2,33.
According to best practices in machine learning, training patches and corresponding labels are divided into 80% for training and 20% validating the algorithm, learning rate of 0.002 was improved by momentum of 0.975. Training is done on our graphics processing unit Titan Black machine having 2880 compute nodes and 6GB memory in Theano library (version 0.7)34, Lasagne (version 0.2) and Nolearn (version 0.1) wrappers of python. Filter sizes, (c × c) = (3 × 3) is found to be least costly in the mini-batches training where, z0 and z1 are each 128 patches. Training the model in Fig. 6 generates an overall of 743209 parameters (weights and biases).
Selectivity function
In order to tackle the specific class of problems, namely rare object detection, which is complicated by the large level of similarity between the soil debris and other spurious background noise elements to the object of interest (i.e., SCN egg), we improve the architecture’s discriminative ability by the introduction of a selectivity function. Selectivity is an intermediate process between the pixel-wise and super pixel segmentation which learns to label as positive only the bounding box containing the object of interest. The algorithm enables the model to learn how to discard units that are undesirable based on the bounding boxes.
The function only propagates the network activations/units that appear in patches that contain the fully visible SCN eggs, but rejects or masks activations/units that occur in patches where either the SCN eggs are not fully present or where there are no SCN eggs. Thus, apart from regular debris objects (that are visually quite different from eggs), the sets of units that are masked also include the debris that are visually similar to parts of eggs. Qualitatively, selectivity is a dynamic labeling function where the same bounding box can take on both an SCN egg at some point, while the image is masked as a debris at another point. A qualitative description of the function is captured in Fig. 7 and video-based illustration is provided in the attached Supplementary Video.
Figure 7.
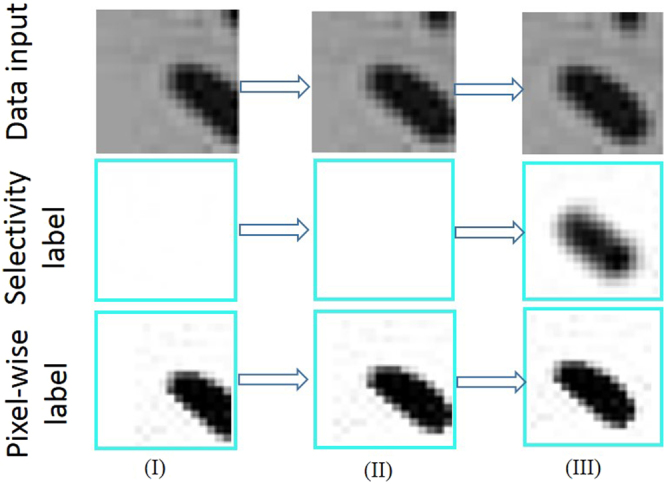
Patch-wise frames selected from video of the progression of an SCN egg example. Selectivity is seen to have superior properties than the pixel-wise semantic segmentation for solving similarity problem between the SCN eggs and debris.
Although, selectivity is a dynamic labeling technique, it is the major ingredient that enabled the autoencoder network training to achieve the tasks. In Fig. 7, the SCN egg data input of either (I) or (II) are similar to debris in such a manner that a vanilla autoencoder network trained for semantic segmentation on pixel-wise basis would confuse the SCN eggs with debris and increase the likelihood of false alarms, but the selectivity ensures that the occurrence of such false positives is curtailed. We observe that the pose centering ability of the network is due to the selectivity criteria included. Selectivity also improves the SCN egg features learning ability of the autoencoder leading to a better accuracy.
Network testing
At inference time, testing images were also patched to (m × n), similar to training images, but usually with local neighborhood overlap for effective fusion of local neighbor’s results. The number of patches for each test image is U × V.
| 4 |
sh and sw are step sizes in the vertical and horizontal image dimensions. We stress here that the step sizes in Equation 4 mostly affect the computation complexity, which increases as the step size reduces (being inversely proportional for sh, sw N, where N is the set of natural numbers). This implies that reducing either sh and sw leads to a nonlinear increase in the number of patches to be independently analyzed35.
Automated egg Counting
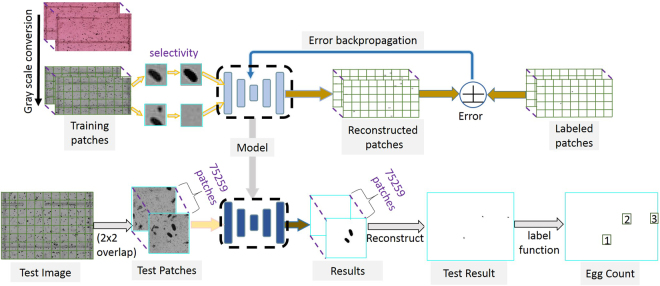
The detected eggs are then counted by using a matrix labeling function called bwlabel36. This simple image topology function is designed to count the number of connected components (blobs) that are activated in a binary conversion of an image. Its performance relies on the fundamental graph-theoretic definitions such as paths, components, neighbors, adjacency, among other terminologies. While there are deep learning networks which automates the counting of objects on frames37, the problem here uses a simple bwlabel function in order to ensure lower deployment overhead. The labeling algorithm begins with scanning along the vertices from the top-left node to the bottom-right node while assigning labels to the foreground pixels based on the labels of node of its adjacent neighbor. Then, equivalent labels are sorted into equivalent classes, after which different labels are assigned to the classes. Some more labels are then replaced with the labels assigned to the equivalent class in another scan through the image. The steps involved in the autoencoder implementation for the training and testing images are shown in Fig. 8. In all the 2400 frames, except 1 (test frame in Fig. 3 where multiple SCN eggs overlap), the counting tool was efficient, but an enhanced method is required for some rare occurrence of overlapping and/or occluded SCN eggs.
Figure 8.
Algorithm implementation highlighting the workflow for training (at the top level) the network (dashed box) in forward activation and backpropagation and testing (at the bottom level) the trained network (dashed box) on an unseen test frame.
Code and data availability
This protocol and source code, sample model, training and testing datasets are freely available for academic use in GitHub repository, https://github.com/pythonuser200/Convolutional_Selective_Autoencoder.
Electronic supplementary material
Acknowledgements
Authors are grateful to Iowa Soybean Association Award 450-46-04, USDA-NIFA Award 2017-67007-26151, and Iowa State University PIIR and PSI, USDA-CRIS IOW04314 project (Crop Genetic Improvement and Adaptation Using Gene Discovery, and Monsanto Chair in Soybean Breeding for providing the funds for the research. However, the credits of the imaging parts go to Matt Carroll and Jacob Ziggafoos, while Nigel Lee designed the app used for generating the training samples. We also thank Christopher Marett and Mark Mullaney for extracting the SCN cysts and eggs from the soils and also identifying and counting the eggs in the images.
Author Contributions
A.S. conceptualized the study, G.T. and A.K.S. managed the experimentation and data collection, A.A., S.S. and B.G. performed the data analytics and result generation. All authors contributed in writing and reviewing the manuscript.
Competing Interests
The authors declare no competing interests.
Footnotes
Electronic supplementary material
Supplementary information accompanies this paper at 10.1038/s41598-018-27272-w.
Publisher's note: Springer Nature remains neutral with regard to jurisdictional claims in published maps and institutional affiliations.
Contributor Information
Arti Singh, Email: arti@iastate.edu.
Soumik Sarkar, Email: soumiks@iastate.edu.
References
- 1.Sankaran S, Mishra A, Ehsani R, Davis C. A review of advanced techniques for detecting plant diseases. Computers and Electronics in Agriculture. 2010;72(1):1–13. doi: 10.1016/j.compag.2010.02.007. [DOI] [Google Scholar]
- 2.Krizhevsky, A., Sutskever, I. & Hinton, G. E. Imagenet classification with deep convolutional neural networks. Neural Information Processing Systems, pp. 1–9 (2012).
- 3.Singh A, Ganapathysubramanian B, Singh AK, Sarkar S. Machine Learning for High-Throughput Stress Phenotyping in Plants. Trends in Plant Science. 2016;2(2):110–124. doi: 10.1016/j.tplants.2015.10.015. [DOI] [PubMed] [Google Scholar]
- 4.Naik HS, et al. A real-time phenotyping framework using machine learning for plant stress severity rating in soybean. Plant Methods. 2017;13(23):1–12. doi: 10.1186/s13007-017-0173-7. [DOI] [PMC free article] [PubMed] [Google Scholar]
- 5. Girshick, R., Donahue, J., Darek, T. & Malik, J. Rich feature hierarchies for accurate object detection and semantic segmentation. Computer Vision and Pattern Recognition, pp. 1–8 (2014).
- 6.Johnson LE. Enhanced early detection and enumeration of zebra mussel (Dreissena spp.) veligers using cross-polarized light microscopy. Hydrobiologia. 1995;312:139–146. doi: 10.1007/BF00020769. [DOI] [Google Scholar]
- 7.Narayanasamy, P. Microbial Plant Pathogens-Detection and Disease Diagnosis. in Detection of Fungal Pathogens in Plants, Springer Link, pp. 5–199 (2010).
- 8.Will P, et al. Computer Vision cracks the leaf code. Proceedings of the National Academy of Sciences of the United States of America. 2015;113(12):3305–3310. doi: 10.1073/pnas.1524473113. [DOI] [PMC free article] [PubMed] [Google Scholar]
- 9. Niblack, T. L., Lambert, K. N. & Tylka, G. L. A Model Plant Pathogen from the Kingdom Animalia: Heterodera glycines, the Soybean Cyst Nematode. The Annual Review of Phytopathology no. 44, pp. 283–303 (2006). [DOI] [PubMed]
- 10.Lauritis JA, Rebois RV, Graney IS. Development of Heterodera glycines Ichinohe on Soybean, Glycine max (L.) Merr., under Gnotobiotic Conditions. Journal of Nematology. 1983;15(2):272–281. [PMC free article] [PubMed] [Google Scholar]
- 11.Syed, F. A. Development of an Automated System for Extraction and Quantification of Soybean Cyst Nematode (SCN) Eggs and Cysts, Chicago: Illinois Digital Environment for Access to Learning and Scholarship (IDEAL) (2015).
- 12.Allen TW, et al. Soybean Yield Loss Estimates Due to Diseases in the United States and Ontario, Canada, from 2010 to 2014. The American Phytopathological Society. 2017;18(1):19–27. [Google Scholar]
- 13.Koenning, S. R. & Wrather, A. J. Suppression of Soybean Yield Potential in the Continental United States by Plant Diseases from 2006 to 2009. Plant Health Progress, no, 10.1094/PHP-2010-1122-01-RS (2010).
- 14.Liu S, et al. A soybean cyst nematode resistance gene points to a new mechanism of plant resistance to pathogens. Nature Letter. 2012;492(7428):252–260. doi: 10.1038/nature11603. [DOI] [PubMed] [Google Scholar]
- 15.McCarville MT, Marett CC, Mullaney MP, Gebhart GD, Tylka GL. Increase in Soybean Cyst Nematode Virulence and Reproduction on Resistant Soybean Varieties in Iowa From 2001 to 2015 and the Effects on Soybean Yields. Plant Health Progress. 2017;18(3):146–155. [Google Scholar]
- 16.Gerdemann JW. Relation of a Large Soil-Borne Spore to Phycomycetous Mycorrhizal Infections. Mycologia. 1955;47(5):619–632. doi: 10.2307/3755574. [DOI] [Google Scholar]
- 17.Faghihi J, Feriss JM. An Efficient New Device to Release eggs From Heterodera glycines. Journal of Nematology. 2000;32(4):411–413. [PMC free article] [PubMed] [Google Scholar]
- 18.Niblack TL, Heinz RD, Smith GS, Donald PA. Density, Distribution, and Diversity of Heterodera glycines in Missouri. Supplement to Journal of Nematology. 1993;25(4S):880–886. [PMC free article] [PubMed] [Google Scholar]
- 19.Laboratory of Gregory L. Tylka. Routine soil processing for SCN egg counts. Iowa State University, [Online]. Available, http://www.plantpath.iastate.edu/tylkalab/routine-soil-processing-scn-egg-counts [Accessed 24 September 2016].
- 20.Burton, J. D. Soil sampling apparatus and method. US Patent 371,400, 9 November (2010).
- 21.Scheiderer, D., Grand, M., Maddux, D. & Delk, E. Soil Sampler. US Patent 285,865, 11 September (2014).
- 22.Lore, K. G., Akintayo, A. & Sarkar, S. LLNet: A deep autoencoder approach to natural low-light image enhancement. Elsevier Journal of Pattern Recognition, no. j_patcog 2016.06.008, pp. 1–13 (2016).
- 23. Farabet, C., Couprie, C., Najman, L. & LeCun, Y. Learning hierarchical features for scene labeling. IEEE Transactions on Pattern Analysis and Machine Intelligence, 1–15 (2013). [DOI] [PubMed]
- 24.Akintayo A, Lore KG, Sarkar S, Sarkar S. Prognostics of combustion Instabilities from Hi-speed Flame Video using A deep convolutional Selective Autoencoder. International Journal of Prognostics and Health Management. 2016;7(023):1–14. [Google Scholar]
- 25.Zhang J, et al. Computer vision and machine learning for robust phenotyping in genome-wide studies. Scientific Reports. 2017;7(44048):1–11. doi: 10.1038/srep44048. [DOI] [PMC free article] [PubMed] [Google Scholar]
- 26.Akintayo, A. J. “Hierarchical feature extraction from spatiotemporal data for cyber-physical system analytics,” PhD Theses. Iowa State University, Ames, IA 2017.
- 27.Akintayo A. & Soumik, S. “Hierarchical Symbolic Dynamic Filtering of Streaming Non-stationary Time Series data,” Signal Processing, vol. 151, pp. 76–88 (2018).
- 28.Stoecklein, D., Lore, K. G., Davies, M., Ganapathysubramanian, B. & Sarkar, S. Deep Learning for Flow Sculpting: Insights into Efficient Learning using Scientific Simulation Data. Scientific Reports7, 46368 (2017). [DOI] [PMC free article] [PubMed]
- 29. Scherer, D., Muller, A. & Behnke, S. Evaluation of pooling operations in convolutional architectures for object recognition. International Conference on Artificial Neural Networks, pp. 1–10 (2010).
- 30.Hinton, G. E., Srivastava, N., Krizhevsky, A., Sutskever, I. & Salakhutdinov, R. Improving neural networks by preventing co-adaptation of feature detectors. arXiv, no. 1207.0580v1, pp. 1–18 (2012).
- 31. Long, J., Shelhamer, E. & Darrell, T. Fully Convolutional Networks for semantic Segmentation. Computer Vision and Pattern Recognition, pp. 3431–3440 (2015). [DOI] [PubMed]
- 32.Eldan, R. & Shamir, O. The Power of Depth for Feedforward Neural Networks. [Online]. Available, https://arxiv.org/pdf/1512.03965.pdf 9 May (2016).
- 33.LeCun, Y. & Bengio, Y. Convolutional networks for images, speech and time-series. In The Handbook of brain Theory and Neural network. MIT Press (1998).
- 34.Bastien, F. et al. Theano: new features and speed improvements. arXiv, no. 1211.5590v1, pp. 1–10 (2012).
- 35.Akintayo, A. et al. “An end-to-end convolutional selective autoencoder approach to Soybean Cyst Nematode eggs detection,” in 22nd ACM SIGKDD Workshop on Data Science for Food, Energy and Water, San Francisco, CA, 2016.
- 36.McAndrew, A. Image Topology. In A Computational Introduction to Digital Image Processing. CRC Press, 25, pp. 307–314.
- 37.Cohen, J. P., Lo, H. Z. & Bengio, Y. Count-ception: Counting by Fully Convolutional Redundant Counting. arXiv:1703.08710 (2017).
Associated Data
This section collects any data citations, data availability statements, or supplementary materials included in this article.


